
Remember me


This study enrolled 360 men aged 43 years and older, recruited between January 2020 and December 2024 from the Urology Departments of Labbafinejad and Imam Khomeini Hospitals, Tehran, Iran. Among these, 180 had histologically confirmed prostate cancer (PCa), and 180 were diagnosed with benign prostatic hyperplasia (BPH), serving as the non-malignant control group.
Inclusion criteria for the PCa group:
Elevated total PSA levels (\u22654 ng/mL).
Abnormal digital rectal examination (DRE).
Histopathological confirmation of PCa via transrectal ultrasound-guided biopsy (TRUS).
Exclusion criteria:
Any prior oncologic treatment (e.g., surgery, radiotherapy, chemotherapy).
Declined informed consent.
The BPH control group included patients with non-malignant prostatic enlargement, confirmed via clinical assessment, PSA levels (\u22651.5 ng/mL), DRE, and negative biopsy.
All participants provided written informed consent. The study was approved by the Ethics Committee of the National Institute of Genetic Engineering and Biotechnology (NIGEB), Tehran, Iran (Ethics Code: IR.A.2020.2.11). All procedures followed national regulations and the Declaration of Helsinki.
Clinical assessment and laboratory measurementsFor PCa patients, data collected included age, tumor stage (TS), and ISUP grade. Biopsies were performed under ultrasound guidance using a 12 + X-G needle. Tissue samples were taken from 6 peripheral and 6 transitional zone regions, with an additional core from any suspicious lesion [15].
BPH diagnosis was based on PSA levels, DRE, and histological confirmation. PSA levels were measured using a human kallikrein 3/PSA ELISA kit. Prostate volume was assessed by TRUS, and weight calculated using the elliptical formula [16]. Table 1 summarizes clinical and demographic variables. PSA and prostate weight showed significant differences between PCa and BPH (p \u2264 0.0001); age did not differ significantly (p = 0.658).
Table 1 Baseline characteristics of prostate cancer (PCa) and benign prostatic hyperplasia (BPH) patients included in the study (n = 180 per group). Values are presented as mean ± standard deviation (SD), median, and range (minimum–maximum). Total PSA (tPSA) levels were significantly higher in the PCa group (p ≤ 0.0001), while prostate weight was significantly higher in the BPH group (p ≤ 0.0001). No statistically significant difference was observed in age between groups (p = 0.658)Whole-blood sampling and genomic DNA extractionFollowing a minimum 12-hour overnight fast, 3 mL of peripheral whole blood was collected from each participant into EDTA-containing vacutainer tubes. Samples were obtained retrospectively from both prostate cancer (PCa) and benign prostatic hyperplasia (BPH) patients. For PCa patients, blood collection occurred after digital rectal examination (DRE), serum total PSA testing, and histological confirmation of cancer via prostate biopsy, but prior to any surgical or oncologic intervention, including prostatectomy, chemotherapy, or radiotherapy.
All clinical procedures mentioned—including PSA testing, DRE, and biopsy—were part of the standard diagnostic pathway routinely performed by urologists, and were not carried out specifically for this study. Participants were recruited after diagnosis had been established, and no additional clinical evaluations were conducted for research purposes.
Genomic DNA was extracted immediately after sample collection, using the GeneAll® Exgene Blood SV Kit (GeneAll Biotechnology, Seoul, Korea), a rapid spin-column-based protocol that yields high-quality DNA in approximately 20 min. A total input of 3 mL whole blood was used per individual. Extracted DNA was stored at − 20 °C until further analysis.
DNA concentration was measured using a NanoDrop spectrophotometer (Thermo Scientific, Waltham, MA, USA). DNA quality and integrity were assessed by agarose gel electrophoresis, and purity was determined using the optical density ratio at 260 nm and 280 nm (A260/A280).
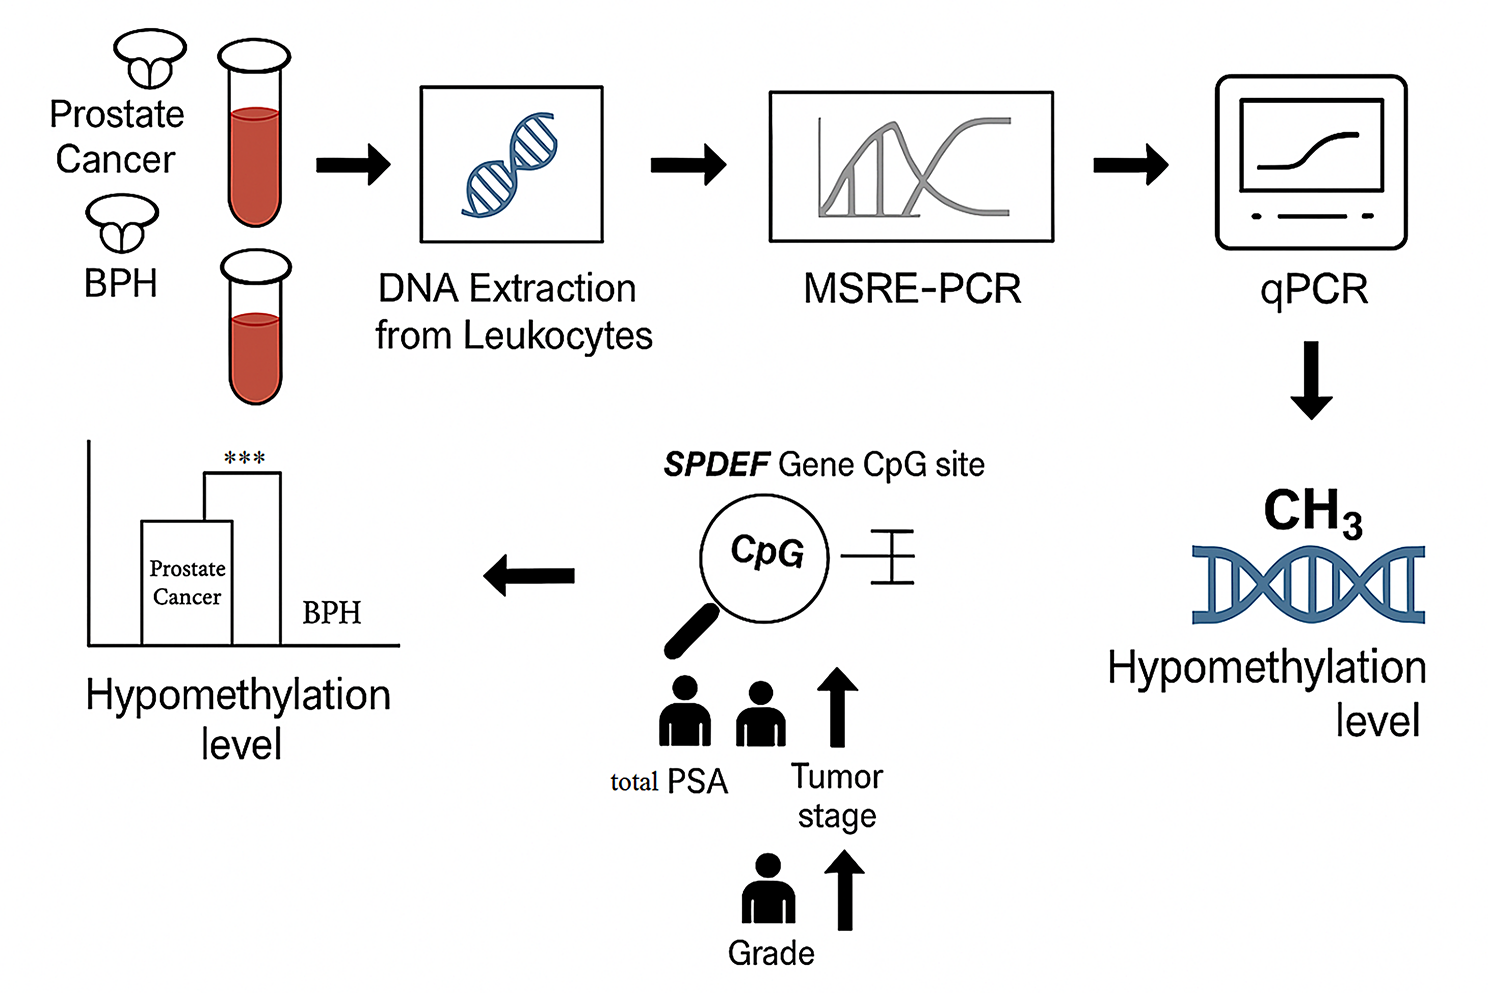
Methylation analysisGenomic DNA was isolated and subjected to methylation analysis at a target CpG site within the SPDEF promoter region (cg11346722). Two complementary PCR-based methods were employed:
MSRE-PCR (Methylation-Sensitive Restriction Enzyme PCR): Genomic DNA was digested with the HaeIII enzyme, which selectively cuts unmethylated sites. Amplification was performed using primers flanking the target site, and digestion efficiency was assessed via agarose gel electrophoresis.
Quantitative PCR (qPCR): The same primers were used in qPCR to quantitatively assess methylation. ΔCt values were obtained relative to undigested controls, and percentage methylation was calculated using the 2^–ΔCt method.
All samples were analyzed in duplicate for both assays, and data were used for comparative and statistical analyses.
Identification of DMRs in the GEO datasetsPublicly available DNA methylation microarray datasets, obtained from the NCBI Gene Expression Omnibus (GEO) database (https://www.ncbi.nlm.nih.gov/geo/geo2r/), were analyzed to identify differentially methylated regions (DMRs) in prostate cancer:
Differential methylation analysis was conducted using beta-values, and log2 fold-change (log2FC) values were calculated. Adjusted p-values were determined using the Benjamini–Hochberg method to control the false discovery rate (FDR) in the context of multiple comparisons [17].
To identify shared hypomethylated genes, we filtered for genes with values of − 1 < log₂FC ≤ 0. The overlap between the two datasets was assessed using the online Venn diagram tool provided by the Bioinformatics and Systems Biology group (http://bioinformatics.psb.ugent.be/webtools/Venn/).
Bioinformatic selection and primer design for CpG-specific MSRE-PCR targeting promoter hypomethylationPromoter and regulatory regions of the target gene were identified using the GeneCards database (https://www.genecards.org), focusing on regulatory elements associated with transcriptional control. The specific location of differentially methylated regions (DMRs) was determined using the SMART App (http://www.bioinfo-zs.com/smart/), which provides methylation profiles across 33 cancer types using data from The Cancer Genome Atlas (TCGA) [18].
The UCSC Genome Browser (GRCh38/hg38; http://genome.ucsc.edu) was used to visually inspect the SPDEF gene locus and promoter region of interest (chr6:34544344–34544482). CpG dinucleotides within the promoter were predicted using the EMBOSS CpGPlot/CpGReport tool (https://www.ebi.ac.uk/Tools/seqstats/emboss_cpgplot), applying standard thresholds for the observed-to-expected CpG dinucleotide ratio (Obs/Exp > 0.6) and GC content (> 50%) to identify regions likely to be involved in methylation regulation.
To identify suitable restriction enzyme recognition sites (not “islands”), the NEBcutter V2.0 tool (http://nc2.neb.com/NEBcutter2) was employed. Methylation-sensitive restriction enzymes (MSREs) were selected based on the presence of CpG dinucleotides within their recognition sequences.
To ensure that the methylation-sensitive restriction enzyme HaeIII was not inhibited and performed effective digestion, multiple quality control measures were implemented:
Positive digestion control: DNA from samples previously shown to be unmethylated at the SPDEF promoter (cg11346722) was used to verify HaeIII activity. Complete digestion in these samples was evidenced by a significant reduction or complete absence of PCR amplification.
Matched undigested controls: For each sample, an undigested aliquot (enzyme-free) served as a 100% methylated reference, enabling comparison of amplification levels.
Reproducibility: All digestion reactions were conducted in at least duplicate. Replicates showed high concordance in band intensity (MSRE-PCR) and ΔCt values (qPCR), confirming the reliability of digestion outcomes.
Optimal conditions: Digestions were carried out under the manufacturer-recommended conditions (2–3 h at 37 °C) using the appropriate buffer, followed by heat inactivation.
This multipoint quality control strategy ensured specific and effective digestion of unmethylated CpG sites and validated the robustness of the methylation assay used in this study. A schematic overview of the promoter region and enzyme recognition sites is presented in Fig. 1.
Fig. 1
Visualization of the HaeIII restriction site at the cg11346722 locus, located on chromosome 6 (chr6:34544344–34544482). The recognition sequence GG^CC is highlighted within the SPDEF promoter region, and the cleavage site of HaeIII is indicated by an arrow. This illustration is based on data from NEBcutter V2.0 (https://nc2.neb.com/NEBcutter2), which was used to identify methylation-sensitive restriction enzyme (MSRE) recognition islands relevant to the design of the MSRE-PCR assay
Primers for MSRE-PCR were designed flanking the selected MSRE recognition site using Primer3Plus (https://primer3plus.com/). Primer characteristics—including melting temperature, GC content, amplicon size, and specificity—were optimized for MSRE-PCR conditions. Final primer sequences and design parameters are provided in Supplementary S2_Table-S3.
CpG dinucleotide methylation analysis using MSRE-PCRMethylation-sensitive restriction enzyme PCR (MSRE-PCR) is a rapid and sensitive method for detecting DNA methylation by comparing digested and undigested DNA samples. It utilizes methylation-sensitive restriction enzymes that selectively cleave unmethylated CpG sites, followed by PCR amplification with gene-specific primers. This approach enables detection of even low-abundance methylated DNA without requiring bisulfite conversion [19, 20].
In contrast, alternative methods such as pyrosequencing are limited by short read lengths, difficulties in analyzing short sequences, and susceptibility to equipment-related run failures [21]. Bisulfite sequencing, while widely used, involves harsh chemical treatment that can degrade up to 90% of DNA, reducing yield and reliability [22, 23].
In this study, MSRE-PCR was applied to evaluate methylation at the SPDEF CpG dinucleotide (cg11346722) located in the promoter region. The restriction enzyme HaeIII (recognition site: 5′-GG^CC-3′; Takara, Shiga, Japan) was used to digest unmethylated DNA. Reactions were conducted in the manufacturer’s recommended buffer at 37 °C for 3 h, followed by enzyme inactivation at 95 °C for 10 min.
To verify enzyme activity and prevent inhibition, parallel reactions with previously characterized unmethylated DNA were included. Complete digestion was confirmed by a marked reduction or absence of PCR amplification. This validation was performed in quadruplicate.
Each 10 µL digestion reaction included 50 ng of genomic DNA, 0.5 µL of HaeIII, 1 µL of 10× buffer, and nuclease-free water. A non-digested control was prepared alongside.
PCR amplification of digested and undigested DNA was performed using 10 µL of 2× Taq PCR Master Mix (Ampliqon, Denmark), 1 µL of digestion product, 0.5 µL each of forward (5′-GACCCACTCGACGTATCTCT-3′) and reverse (5′-ACCTCAGACCACAGGCAGGC-3′) primers (10 pmol/µL), and nuclease-free water to a final volume of 20 µL. The amplicon size was 176 bp. Additional MSRE-PCR conditions, enzyme details, and recognition sequences are provided in Supplementary S2 _Table-S1.
PCR products were resolved on 1.5% agarose gels stained with ethidium bromide. Band intensities were analyzed using GelAnalyzer 23.1 software.
To minimize pipetting variability, all samples were processed in quadruplicate. Band intensities were normalized against undigested controls run on the same gel. All pipetting was performed using calibrated micropipettes and low-retention tips by a trained operator.
Band intensity ratios (digested/undigested) were calculated to determine the degree of hypomethylation. These results were subsequently validated by qPCR analysis (see Sect. 2.8).
Quantification of methylation status using quantitative PCR (qPCR)The MSRE-PCR assay described above provided a semi-quantitative assessment of SPDEF methylation. However, to account for potential variability due to gel resolution or pipetting inconsistencies, quantitative PCR (qPCR) was also performed to more precisely quantify methylation levels.
qPCR amplification was conducted on both digested and undigested DNA samples using a Rotor-Gene 6000 thermal cycler. The thermal cycling parameters and reaction conditions are listed in Supplementary S2 _Table-S1.
Methylation percentage was calculated using a ΔCt-based formula:
% Methylation = 100 × e^(–0.7 × ΔCt).
where ΔCt = Ct(digested)– Ct(undigested), and Ct is the cycle number at which fluorescence surpasses the detection threshold.
This formula assumes an amplification efficiency of approximately 100% and is based on the principle that methylated DNA remains intact after restriction enzyme digestion and is more efficiently amplified than unmethylated DNA, which is cleaved and thus yields a higher Ct value. A larger ΔCt indicates a greater degree of digestion and, therefore, a lower degree of methylation.
The exponential coefficient − 0.7 was empirically optimized in preliminary experiments and is consistent with coefficients reported in similar MSRE-qPCR workflows [24]. It reflects the relationship between DNA template concentration, enzymatic digestion efficiency, and amplification dynamics.
To validate this quantification method, a standard curve was established using commercially available control DNA at defined methylation levels (0%, 25%, 50%, 75%, and 100%), prepared by mixing fully methylated and unmethylated genomic DNA. These standards were processed under identical digestion and qPCR conditions as test samples. The resulting Ct values were plotted against log-transformed methylation percentages to construct a calibration curve, which demonstrated strong linear correlation (R² > 0.98). This confirmed the reproducibility and accuracy of the ΔCt-based formula and the appropriateness of the − 0.7 coefficient for this assay.
Sample grouping based on methylation levelsFor comparative analysis of SPDEF CpG dinucleotide hypomethylation with clinicopathological parameters such as tumor stage (TS), ISUP grade, and PSA subgroups, patient samples were stratified into groups according to their assigned clinical classifications. Hypomethylation levels were not used to pre-group samples. Instead, hypomethylation data were analyzed post hoc within each predefined clinical group to assess statistical associations. For correlation and comparison analysis, non-parametric tests (e.g., Kruskal–Wallis with Dunn’s multiple comparisons, and Mann–Whitney U test) were employed due to the ordinal nature and non-Gaussian distribution of clinicopathological variables (Fig. 2A-D).
Fig. 2
Correlation of SPDEF promoter hypomethylation with tumor stage and histological grade in prostate cancer. A, B-Group-wise comparison of SPDEF CpG hypomethylation levels across tumor stage (TS1–TS4) and ISUP grade groups (G1–G5) using the Kruskal–Wallis test followed by Dunn’s multiple comparisons. Hypomethylation levels increased progressively with advancing stage and grade. C, D-Linear regression analysis confirmed strong positive correlations between SPDEF hypomethylation and both tumor stage (r = 0.9574) and ISUP grade (r = 0.9348), with tight 95% confidence intervals and highly significant P values (< 0.0001). These results support the potential of SPDEF hypomethylation as a biomarker of prostate cancer progression
The assessment of the relationship between PSA levels and SPDEF promoter methylationTo assess the relationship between SPDEF promoter methylation and serum PSA levels, PSA values were treated as a continuous variable. Spearman’s rank correlation coefficient was used to evaluate the association between PSA levels and methylation percentages obtained via both MSRE-PCR and qPCR assays, given the non-normal distribution of clinical variables and the ordinal nature of PSA progression. This approach avoided subdivision of the diagnostic gray zone (4–10 ng/mL), in line with the reviewer’s recommendations, and provided a more robust statistical analysis (Fig. 3).
Fig. 3
Correlation between serum PSA levels and SPDEF promoter methylation measured by two PCR-based methods. Scatter plots show the relationship between serum PSA levels (ng/mL) and SPDEF promoter methylation percentages as quantified by (A) methylation-sensitive restriction enzyme PCR (MSRE-PCR) and (B) quantitative PCR (qPCR). Trendlines represent linear regression for visual interpretation. Spearman’s rank correlation coefficient (ρ) and associated p-values are displayed on each panel. Both methods revealed a moderate, statistically significant inverse correlation, indicating that higher PSA levels are associated with decreased methylation of the SPDEF promoter
In Silico analysis of SPDEF expression and immune cell infiltration in prostate cancerTo explore the potential relationship between SPDEF gene expression and immune cell infiltration in prostate cancer, we conducted an in silico analysis using the TIMER2.0 database (http://timer.cistrome.org/).
TIMER2.0 provides immune infiltration estimates based on gene expression data from TCGA datasets. We utilized the single-sample Gene Set Enrichment Analysis (ssGSEA) algorithm implemented in TIMER2.0 to assess correlations between SPDEF expression levels and infiltration of various immune cell types, including CD8⁺ T cells, in prostate adenocarcinoma (PRAD) samples. This analysis was exclusively computational and based on publicly available transcriptomic data. No experimental (wet-lab) validation was performed in this study. Future work may include biological validation of these associations to further elucidate the immunoregulatory role of SPDEF in the tumor microenvironment.
Analysis of statistical dataAll statistical analyses were performed using GraphPad Prism version 9.0.0 (GraphPad Software, La Jolla, CA, USA) and IBM SPSS Statistics version 26 (IBM Corp., Armonk, NY, USA). Data are presented as mean ± standard deviation (SD), unless otherwise specified.
Group-wise comparisons of SPDEF hypomethylation levels across tumor stages (TS1–TS4) and ISUP grades (G1–G5) were conducted using the Kruskal–Wallis test, followed by Dunn’s multiple comparisons to determine statistically significant differences between groups.
Spearman’s rank correlation coefficient was used to assess the relationship between SPDEF hypomethylation and ordinal clinicopathological parameters, including tumor stage and ISUP grade. Pearson’s correlation was applied only when evaluating relationships between continuous variables such as PSA levels and SPDEF methylation levels.
Receiver operating characteristic (ROC) curve analysis was conducted in GraphPad Prism to evaluate the diagnostic accuracy of SPDEF promoter methylation status in distinguishing prostate cancer from BPH. Sensitivity, specificity, and area under the curve (AUC) were calculated.
A p-value of < 0.05 was considered statistically significant in all tests.
Comments (0)