
Remember me
Leuprorelin was incubated at two different concentrations: 1 µM concentration was used with hepatic and extrahepatic rat in vitro models for clearance and half-life calculations, while 10 µM was used for the catabolite identification and the production of catabolite profiles. Additionally, 10 µM was the only concentration used for the further studies of NADPH-dependency in rat kidney cytosol with NADPH and DTT, human liver and kidney cytosol with NADPH and DTT in the presence of inhibitors, and with human liver and kidney S9 fractions in the presence of inhibitors to enable the comparison of catabolite profiles. The catabolite numbering was matched with our earlier work (Jyrkäs et al. 2023; Jyrkäs and Tolonen 2021) to ease the comparison with the results obtained in human hepatic and extrahepatic models.
Rat Hepatic In Vitro Models (Liver S9 Fraction and Hepatocytes)Leuprorelin was catabolized in all employed hepatic in vitro models, the rate of disappearance varying across the systems. The fastest disappearance was detected in the liver S9 fraction supplemented with NADPH, where the half-life was 3.6 min (Table 1). Without NADPH, the half-life increased nearly fourfold to 12.8 min. Leuprorelin was most stable in hepatocytes, where its half-life was 26 min. In total, fourteen catabolites were detected across these models (Fig. 1; Table 2). The highest number of catabolites, thirteen in total, was observed in the liver S9 fraction supplemented with NADPH. In hepatocytes, eleven catabolites were detected, while the fewest, seven catabolites, were observed in the liver S9 fraction without NADPH. Both the disappearance rate and catabolite profile indicate that NADPH significantly affected the catabolism of leuprorelin, similarly to what was observed earlier with corresponding experiments with human hepatic in vitro systems (Jyrkäs and Tolonen 2021).
Table 1 Half-lives (min) and intrinsic clearances (µl/min/mg of protein for S9, µl/min/million cells for hepatocytes, µl/min/ml for plasma) of leuprorelin in each metabolic modelFig. 1
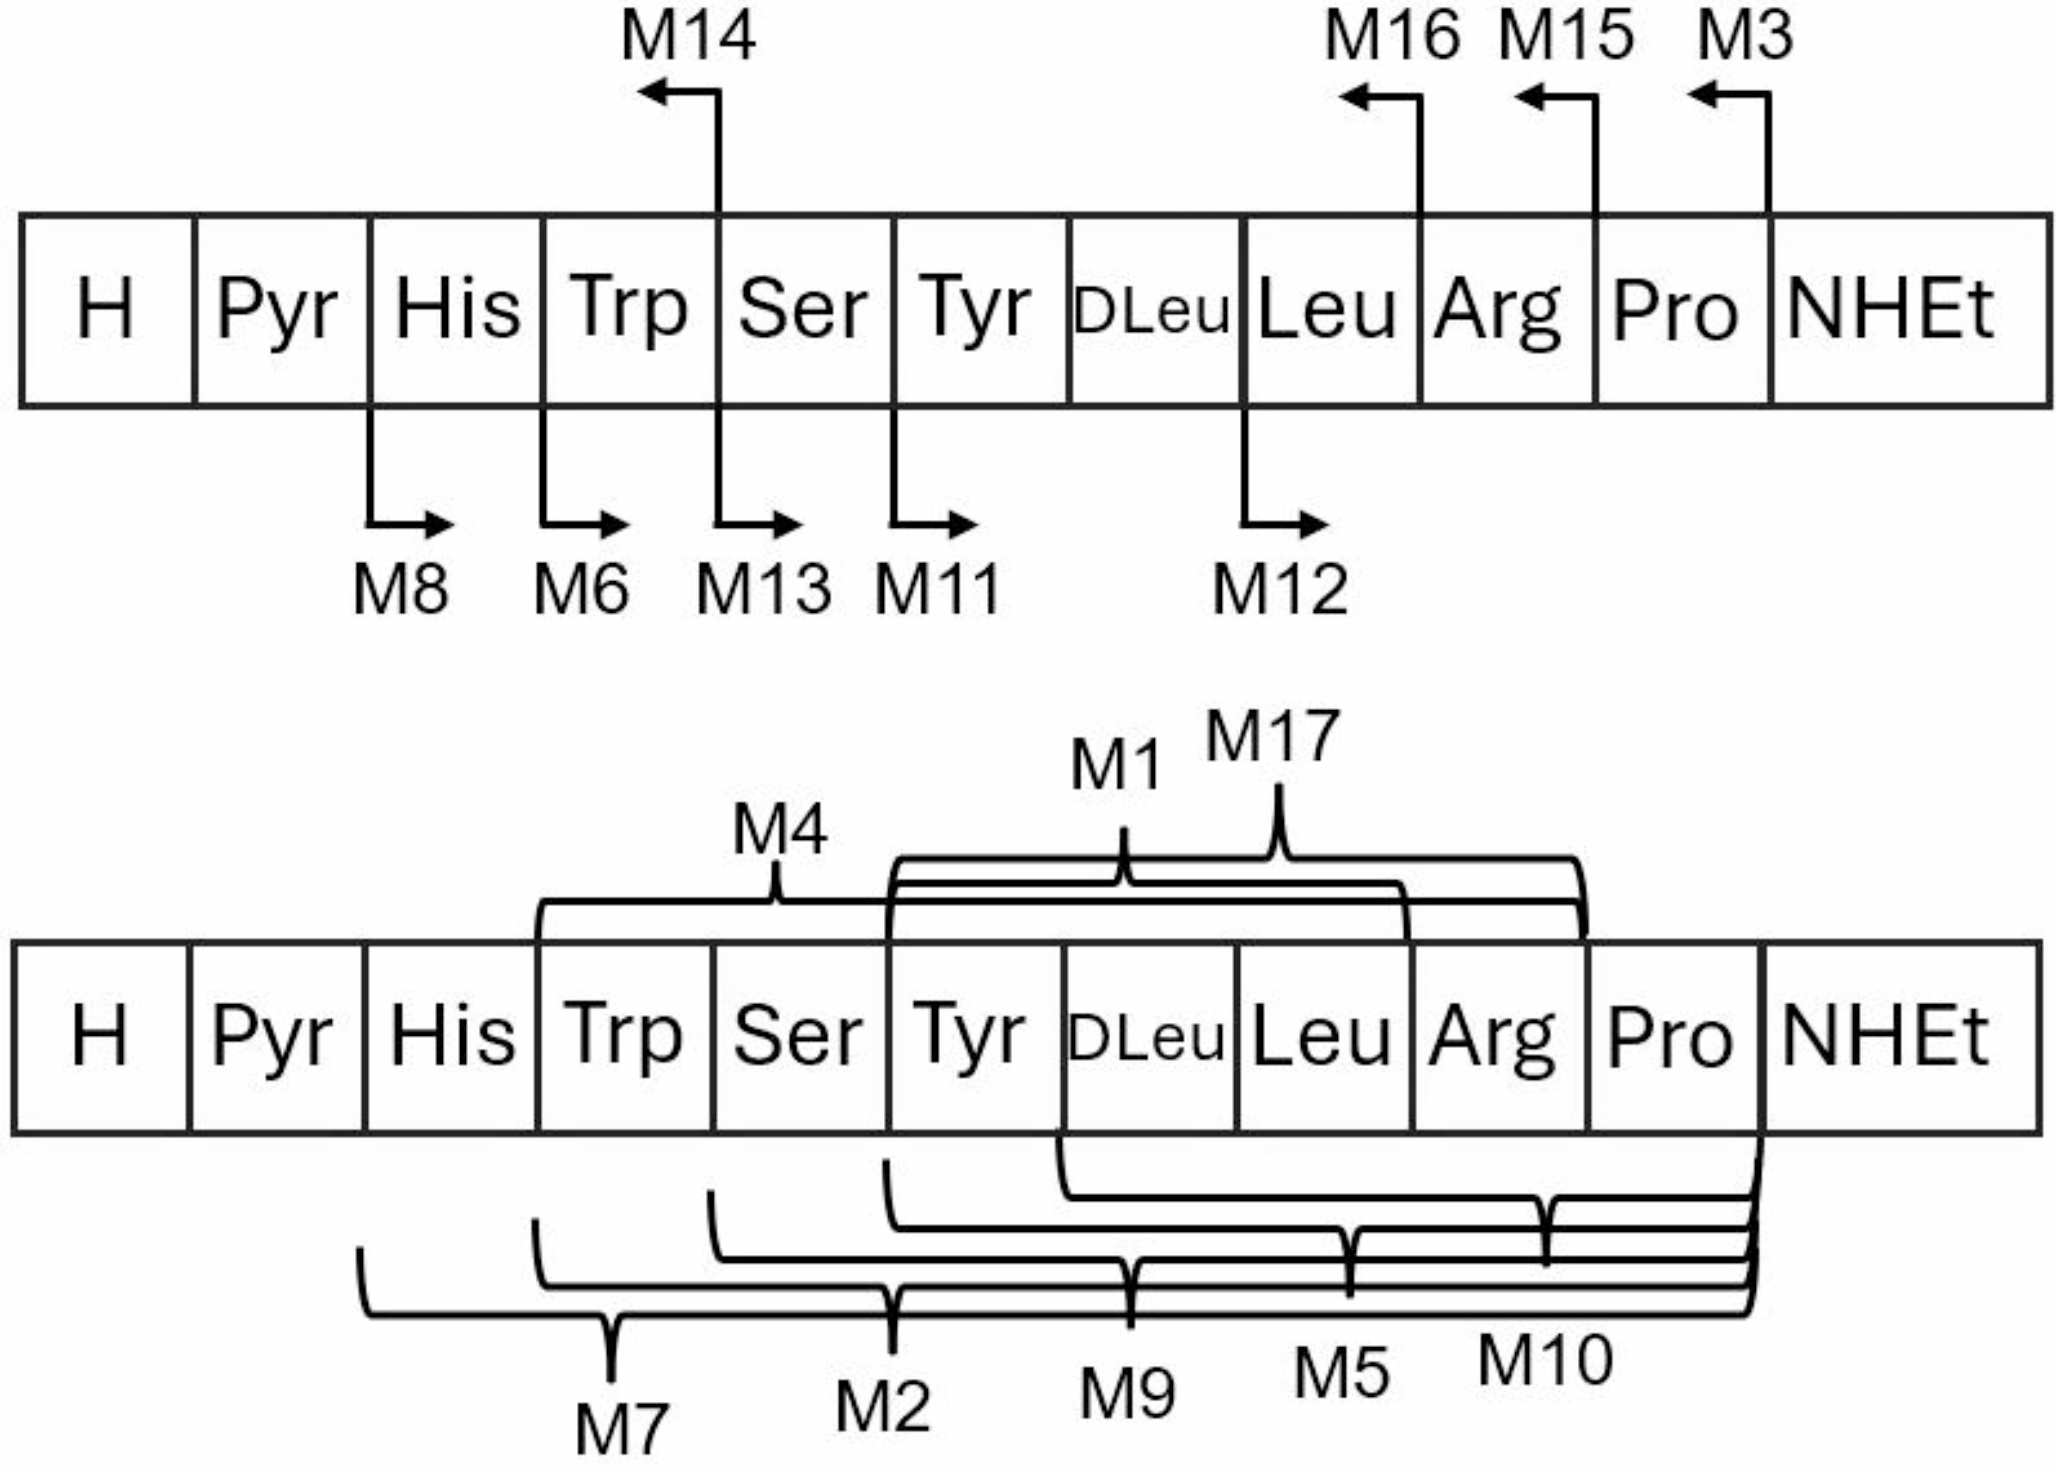
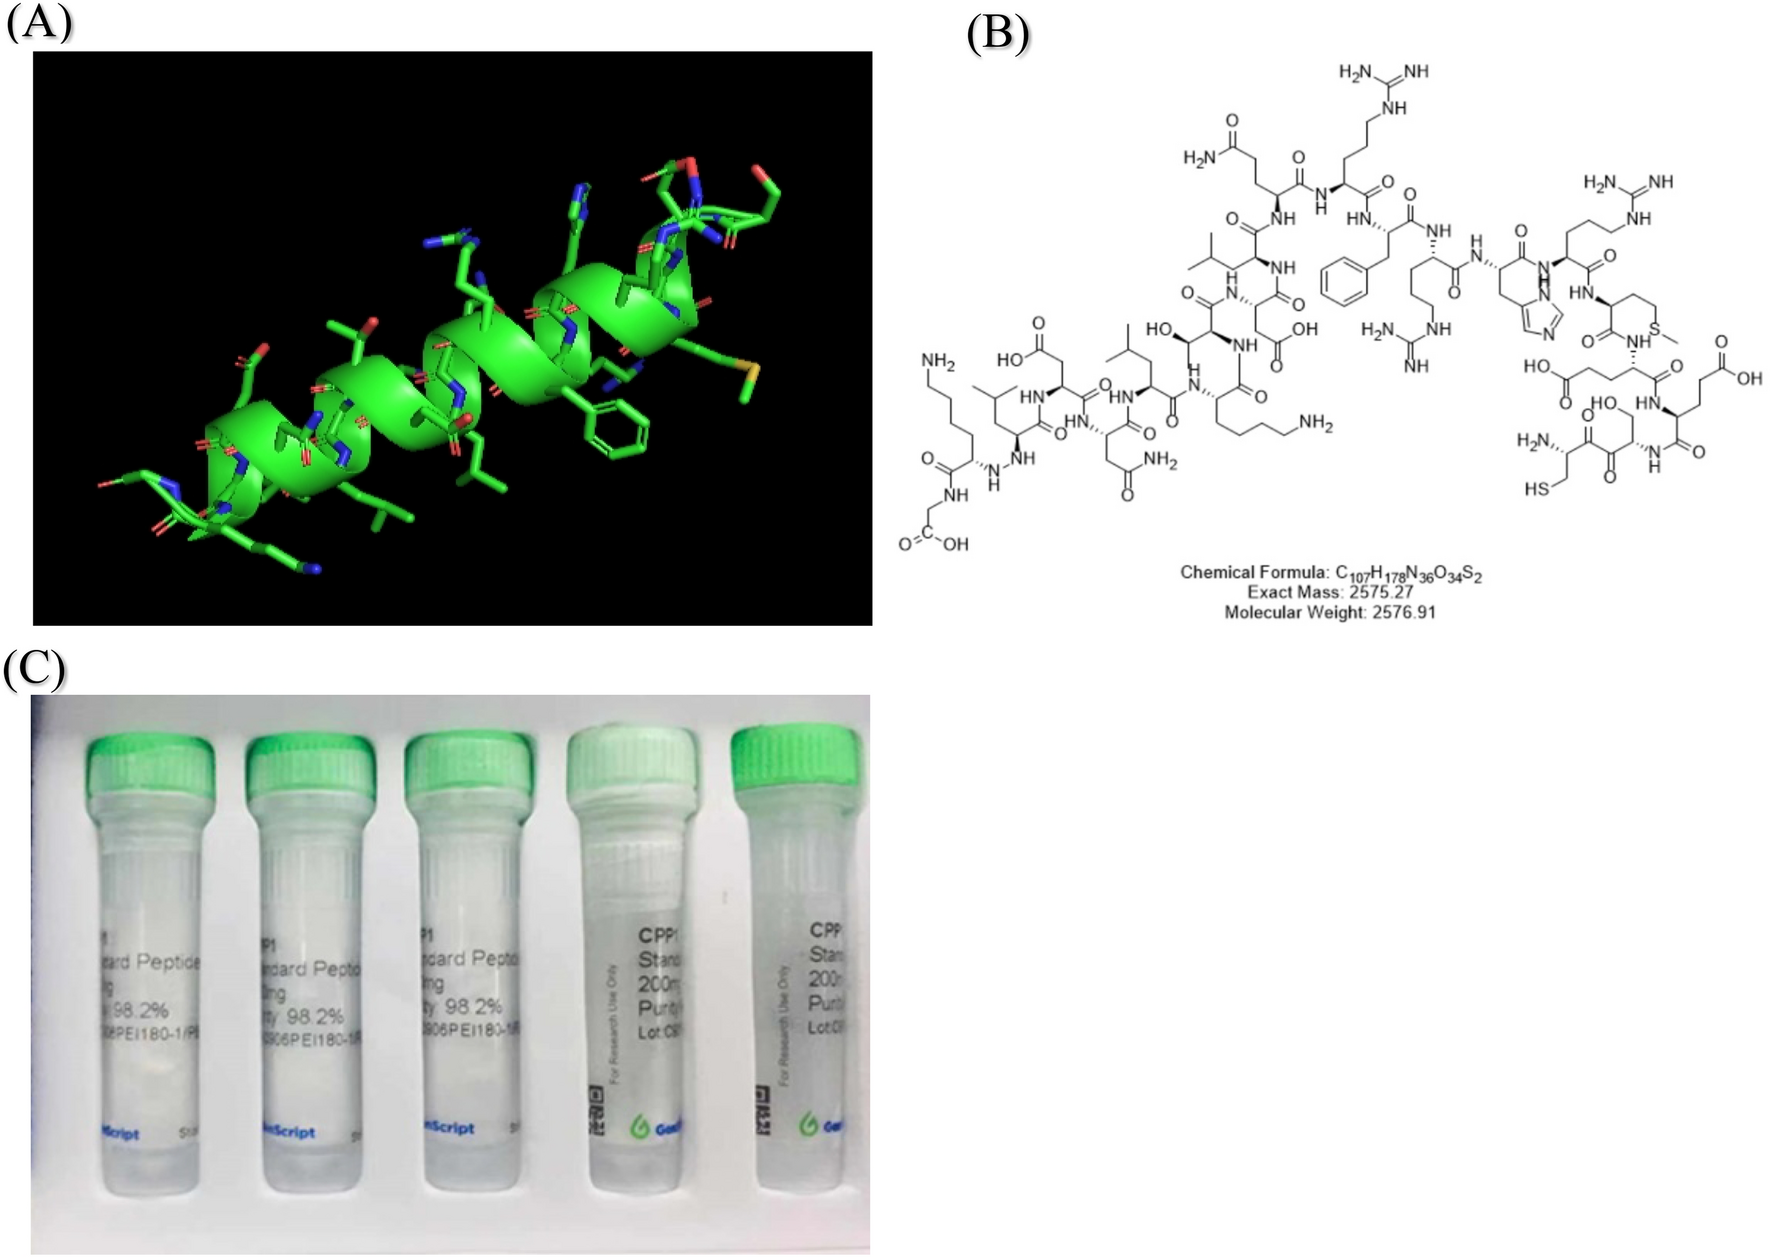
The sequence of leuprorelin and the detected catabolites, Pyr = pyroglutamic acid
Table 2 Catabolite profiles of leuprorelin in rat in vitro models, and in rat in vivo, presented as % of AUCs (0–60 min in vitro, 0–120 min in vitro plasma, 5–360 min in vivo plasma)In the absence of NADPH, the main catabolites were formed by exopeptidases. Clearly the most abundant catabolite M3 was formed via hydrolysis between proline and the N-ethylated C-terminus, and the abundances of other observed catabolites were very much lower. This is in line with the results obtained earlier with human liver S9 fraction (Jyrkäs and Tolonen 2021). On the other hand, in the presence of NADPH, the catabolite profile changed substantially. The main catabolites were M13 and M9, formed via hydrolysis of tryptophan and serine (M13), and additional cleavage between proline and the N-ethylated C-terminus (M9, i.e. combination of reactions in M3 and M13). The next abundant catabolites were related to the hydrolysis between serine and tyrosine (M11), followed by cleavage between proline and the N-ethylated C-terminus (M5, i.e. combination of reactions in M3 and M11). Furthermore, catabolites formed by hydrolysis between pyroglutamic acid and histidine (M7, M8) were more abundant than M3, which was followed by catabolites formed between histidine and tryptophan (M2, M6). The effect of NADPH on the catabolite profile was quite similar in rat liver S9 fraction than what observed earlier with human S9 fraction (Jyrkäs and Tolonen 2021). Small differences in the profiles between the rat data presented here and the earlier human data were observed, but those could be caused by a different processing of catabolite data, i.e. AUCs were used in this study, while percentual abundance at 60 min timepoint was used in the earlier assessment.
In natural GnRH, the bond between proline and glycine is cleaved by prolyl oligopeptidase, and therefore, the catabolite M3, formed via hydrolysis between proline and the N-ethylated C-terminus, is most likely produced by the same peptidase (García-Horsman et al. 2007). Prolyl oligopeptidase has an important role in human body and is ubiquitously expressed. In the sub-cellular fraction analysis, prolyl oligopeptidase activity was detected in all fractions, but the highest activity was detected in cytosol (Gass and Khosla 2007). The catabolism of both endogenous and therapeutic peptides typically begins with endopeptidases, followed by exopeptidases that cleave the ends of truncated peptide chains (Yao et al. 2018). Therefore, the addition of NADPH to the liver S9 fraction likely activates endopeptidases. Additionally, since the formation of both M8 (Pyr1-His2) and M6 (His2-Trp3) is increased, some other oligopeptidases, such as pyroglutamyl peptidases and thimet oligopeptidase, could also be activated (Cummins & O’Connor, 1998; Liu et al. 2021). The catabolite profile in rat hepatocytes resembled a combination of those observed in liver S9 incubations with and without NADPH. The main catabolite in hepatocytes was M3, but the combined abundances of M11, M13, and their further catabolites M5 and M9 are higher than those of the other catabolites. In contrast to the liver S9 fraction with NADPH, the catabolites formed via hydrolysis between histidine and tryptophan (M2 and M6) had lower abundance in hepatocytes, suggesting that the proteases responsible for cleaving this bond are likely cytosolic, as the permeability of leuprorelin through cell membrane is considered to be quite limited (Guo et al. 2004), since the GnRH-receptor is a transmembrane, G protein-coupled receptor, expressed on the surface of pituitary gonadotropic cells (Flanagan and Manilall 2017).
Rat Extrahepatic In Vitro Models (Kidney and Intestinal S9 Fraction, Plasma)In incubations with kidney and intestinal S9 fractions supplemented with NADPH, leuprorelin disappeared significantly faster in the kidney, with half-lives of 2.4 min and 90 min, respectively. In contrast, in the absence of NADPH, the half-lives were 84 min in the kidney and 130 min in the intestinal S9 fraction (Table 1). Thus, the effect of NADPH was much more pronounced in the kidney S9 fraction than in the intestinal S9 fraction. Leuprorelin was stable in rat plasma, with 90% of the initial concentration remaining after two hours of incubation.
A total of 10 catabolites were detected in incubations with extrahepatic enzyme sources (Fig. 1; Table 2). In the kidney S9 fraction supplemented with NADPH, five catabolites were detected, while nine catabolites were identified in the absence of NADPH. The clear main catabolite in the NADPH-supplemented incubation was M11, formed by hydrolysis between Ser4 and Tyr5, accounting for almost 84% of the total exposure. M11 was also the most abundant catabolite in the absence of NADPH, but its abundance was lower, at 32% of the total exposure, due to lower metabolic turnover. Moreover, M11 was further catabolized into M5. In the absence of NADPH, M3 and M15, both formed by exopeptidases from the N-ethylated C-terminus, had higher exposure compared to the NADPH-supplemented incubation.
In the intestinal S9 fraction, which was included in the study to enable comparison with already published human data (Jyrkäs et al. 2023), three catabolites were detected both in the NADPH-supplemented and non-supplemented incubations. The main catabolites in both conditions were M3, M11, and M13, with no significant difference in the catabolite profiles. This suggests that the endopeptidases activated by NADPH in the kidney S9 fraction are likely absent in the intestinal S9 fraction. Furthermore, in the incubation with rat plasma, five catabolites were detected, with relative abundances less than 0.5%. The formed catabolites were mostly formed by exopeptidases, as only M13, corresponding to a cleavage between tryptophan and serine, was derived from a cleavage between non-terminal amino acids. The catabolite with highest abundance was M15, cleaved between arginine and proline.
Rat In Vivo Results and the In Vitro CorrelationThe catabolite profile of leuprorelin was determined from rat plasma, after intravenous administration to Sprague Dawley rats. The in vivo plasma catabolite profile alongside those from liver, kidney, and intestinal S9 fractions (with or without NADPH), as well as rat hepatocytes and plasma, are presented in (Fig. 1; Table 2). In total, eight catabolites were detected in vivo. The two major catabolites were produced by a cleavage between serine and tyrosine (M11), and between leucines (M12), M11 having about 29% relative role of the total exposure, and M12 about 5.5%. Other catabolites, with abundances less than 1% of the total exposure, included M1, M3, M13, M14, M16, and M17. Of the rat in vitro models applied here, only the kidney S9 fraction was able to predict the major role of M11 (and M12) in vivo, and these were correctly predicted both in the absence and presence of NADPH. The kidney S9 fraction without NADPH showed the closest correlation to the in vivo catabolite profile, identifying seven out of the eight in vivo catabolites, with only M1 and M17 missing (both with an apparent exposure of 0.1%). Two catabolites, M5 (exposure 0.5%) and M15 (exposure 2.6%), were detected in the kidney S9 fraction without NADPH but were absent in vivo. When the kidney S9 fraction was supplemented with NADPH, the main in vivo catabolite M11 was also identified as a major catabolite in vitro. However, the overall catabolite profile was more dissimilar to the in vivo profile, with only five catabolites detected, two of which were absent in vivo. The incubation of leuprorelin with liver S9 fraction without NADPH suggested M3 to be the main catabolite, while in the incubation supplemented with NADPH the main catabolite was M13, formed via hydrolysis between tryptophan and serine. Both M3 and M13 were significantly overpredicted in these models. Furthermore, the catabolite profile of the liver S9 without NADPH underpredicted the number and identity of the catabolites, while liver S9 supplemented with NADPH overpredicted the number of catabolites and strongly underpredicted the in vivo main catabolites. In rat hepatocytes, again the role of M3 was strongly overpredicted, and roles of in vivo main catabolites M11 and M12 were underpredicted. With intestinal S9 fraction, the stability of leuprorelin was overpredicted, and the number of catabolites was underpredicted, while the main catabolite was misidentified. Lastly, rat plasma predicted leuprorelin to be more stable and misidentified the catabolites. As a conclusion, for leuprorelin, the best in vitro model was kidney S9 fraction without NADPH, as it predicted the closest number of catabolites, and the main catabolite most accurately using AUC.
Further Studies of NADPH-dependencyAs a follow up to our earlier investigations of leuprorelin in human in vitro models, and the corresponding rat in vitro results presented above (Jyrkäs et al. 2023; Jyrkäs and Tolonen 2021), the mechanism of NADPH-dependency of leuprorelin in vitro catabolism was further studied in human liver and kidney S9 fractions by co-incubating leuprorelin with two broad spectrum protease inhibitors from Sigma-Aldrich and Roche, and two selective inhibitors of carboxylesterases (Brandt et al. 1980) (BNPP) and serine proteases (Turini et al. 1969) (PMSF). The components of Roche’s inhibitor cocktail are kept classified by the supplier, but Sigma-Aldrich has revealed the components to be AEBSF, aprotinin, bestatin, E-64, leupeptin and EDTA. AEBSF is structurally related to PMSF and is therefore also a serine esterase inhibitor (Powers et al. 2002). Aprotinin is a broad-spectrum serine protease inhibitor (Wei et al. 2024), while bestatin is an inhibitor of various aminopeptidases, inhibiting the exopeptidase activity on N-terminus of a peptide substrate (Umezawa et al. 1976). E-64 is a cysteine protease inhibitor, which does not react with thiol-groups of non-protease enzymes (Hanada et al. 1978; Hashida et al. 1980), while leupeptin inhibits wide range of serine proteases, but also some cysteine and threonine proteases (Marathe et al. 2019). EDTA is able to chelate various metals, such as zinc, and therefore acts as a metalloprotease inhibitor, but due to the chelating activity, trypsin-like proteases, i.e. serine proteases, might also be affected by the removal of calcium ions needed to stabilize their structure (Soussou et al. 2023). Effect of the inhibitors in the catabolite profiles are presented in Tables 3 and 4.
Table 3 In vitro catabolite profiles of leuprorelin in human liver S9 incubation, in the absence and presence of protease/peptidase inhibitors and with (+) and without (−) NADPHTable 4 In vitro catabolite profiles of leuprorelin in human kidney S9 incubations, in the absence and presence of protease/peptidase inhibitors, and with (+) and without (-) NADPHAs previously reported, a strong NADPH-dependency of leuprorelin catabolism was observed in both liver and kidney S9 fractions. In liver S9 fraction incubation in the absence of NADPH and inhibitors, the clear main catabolite was M3, formed via hydrolysis of the ethylamide-group from C-terminus. As the M3 is the only major catabolite in the incubation, the inhibitors did not show any clear effect on the catabolite profile, mainly governed by formation of M3. However, in the presence of Sigma-Aldrich inhibitor cocktail, the half-life was increased to 39 min compared to 33 min in the absence of inhibitor (data not shown), and the formation of minor catabolites M5, M9, M11, M14 and M16 was fully inhibited. In the presence of NADPH, the next abundant NADPH-dependent catabolites were M2, M5, M6, M7, M8, M9, M11 and M13, and formation of all these catabolites were either fully or strongly decreased by Sigma-Aldrich cocktail, and the formation of M3 was increased to the same level as in the incubation without inhibitor in the absence of NADPH. Furthermore, the half-life in the presence of Sigma Aldrich inhibitor cocktail increased to 33 min, compared to 12 min in the absence of inhibitors, i.e. to the same value as in the incubation without NADPH. Other employed inhibitors also partially decreased the formation of these NADPH-dependent catabolites, but not at the same level as Sigma-Aldrich cocktail. Based on the data, PMSF and Roche cocktail have about equal inhibitory effect towards this catabolite formation, while BNPP has the lowest effect. Similar trends were also detected in the incubation with kidney S9 fraction. In the absence of NADPH, M3 was the main catabolite without inhibitors. Additionally, M11 (Ser4-Tyr5), M15 (Arg8-Pro9) and M16 (Leu7-Arg8) also had relative abundances higher than 1%. Sigma-Aldrich inhibitor cocktail inhibited M11, M15 and M16 almost completely, while few new additional minor catabolites were detected. Both Roche cocktail and PMSF were also able to partially inhibit the formation of M15. The effects on the half-lives were small: the presence of Sigma-Aldrich cocktail and PMSF increased the half-lives slightly, while both Roche cocktail and BNPP shortened the half-lives (data not shown). When the incubation was supplemented with NADPH, the catabolite profile changed significantly, as already reported. M11 was the main catabolite, formed via hydrolysis between Ser4 and Tyr5, followed by M5, with an additional cleavage of N-ethylamide. M3 was the next abundant catabolite, followed by M13 and M12 (hydrolysis between Trp3-Ser4 and DLeu6-Leu7). Sigma-Aldrich cocktail had the greatest effect on the catabolism, as the formation of both M11 and M5 were significantly reduced in the presence of the inhibitor. While the amount of these catabolites was reduced, the relative abundances of catabolites derived from N-terminus, namely M8/M7 and M6/M2, increased. Yet, the half-life of leuprorelin in the presence of Sigma-Aldrich cocktail nearly doubled from 10 min to 19 min. The other inhibitors had smaller effects on the catabolism of leuprorelin in kidney S9 fraction.
As a next step in investigation of the NADPH-dependency on the formation of leuprorelin catabolites, additional incubations were performed with rat kidney cytosol, as well as with human liver and kidney cytosol, as the involved enzymes were previously concluded to be cytosolic (Jyrkäs et al. 2023). As the cytosolic environment is reductive in nature, and some proteolytic enzymes need reducing milieu to be activated, also the effect of artificial reducing milieu was studied (Saito et al. 2003; Trivedi et al. 2009). Dithiothreitol (DTT) is a commonly used redox reagent, which was first discovered in the 1960s and has been used since to keep proteins in their reduced form (Cleland and Wallance 1964; Getz et al. 1999). Furthermore, when the stability of some GnRH-analogs was studied in the past, the incubations were supplemented with DTT (Berger et al. 1991). The catabolite profile in the rat kidney cytosol supplement with either NADPH or DTT and in the absence of both is presented in Table 5, while the corresponding data with human liver and kidney cytosol is shown in Table 6. The profiles in the rat kidney cytosol incubations supplemented with NADPH and DTT are closely similar, with M13 as the clearly most abundant catabolite, followed by M6, M8 and M11, while in the absence of NADPH or DTT, the leuprorelin is relatively stable and M3 is the most abundant catabolite. This suggests that also the NADPH-dependency is possibly caused by a process maintaining reducing milieu. The results in human kidney cytosol were very similar to those in rat kidney cytosol, i.e. similar NADPH-and DTT dependency was detected, and the incubation supplemented with DTT provided identical catabolite profile. M11 and M13 were the most abundant NADPH/DTT-dependent catabolites in human kidney cytosol, but as a species difference the next abundant catabolites in human were M5 and M9, instead of M6 and M8 that had higher roles in the rat.
Table 5 In vitro catabolite profiles of leuprorelin in rat kidney cytosol incubations in the absence and presence of NADPH and DTTTable 6 In vitro catabolite profiles of leuprorelin in human liver and kidney cytosol incubations in the absence and presence of NADPH and DTTOn the contrary, results with human liver cytosol were different. NADPH-dependency was not detected, resulting similar catabolite profile with and without NADPH, with M3 as the clear main catabolite, being a slight surprise as a clear NADPH dependency was obtained in our earlier work with human liver S9 fraction (Jyrkäs and Tolonen 2021). However, in the DTT supplemented incubation of human liver cytosol the turnover of leuprorelin was higher and, the catabolic profile different with decreased role of M3 and clearly increased role for catabolites M6, M7, M8, M9, M11 and M13 i.e. the same catabolites for which NADPH-dependency was observed in earlier experiments (tissue and species dependently). The liver cytosol incubations were repeated to assure that NADPH was added to the incubation, and similar profiles were produced.
There exist relatively few biological processes that utilize NADPH to maintain the reductive environment within the cell and which can reduce an intracellular disulfide bond. The thioredoxin system, which consists of NADPH, thioredoxin reductase (TrxR) and thioredoxin (Txr) is an important disulfide reductase system, providing electrons for a large range of enzymes, which is also active in subcellular fractions of cytosol and mitochondria (Lu and Holmgren 2014; Pires et al. 2022). The second important NADPH-dependent reductase system comprises of glutathione-disulfide (GSSG) and its reductase (Gsr). In TrxR, the electrons of NADPH reduce the disulfide of Txr, resulting in NADP+ and Trx-dithiol. With Gsr, the electrons from NADPH reduce GSSG to two free glutathiones (Miller et al. 2018). Based on the results presented here, it is not possible to distinguish these systems, and there is much cross-talk between these systems: Gsr can act as a backup of TrxR to reduce Trx (Du et al. 2012). Additionally, thioredoxin system is also able to reduce oxidized GSH (Tan et al. 2010). The reducing milieu controlled by both thioredoxin reductase and glutathione reductase could be mimicked by DTT, as it might also change the conformation of the proteases by reducing the intramolecular disulfide bonds. For example, serine proteases contain multiple disulfide bonds that must be formed to activate the protein (Steitz and Shulman 1982). Additionally, it has been reported that pyroglutamyl peptidase I has a strict requirement for thiol-reducing agent, such as DTT (Cummins & O’Connor, 1998). Since GnRH is a substrate of pyroglutamyl peptidase I, the catabolites M7 and M8 are both most likely formed by this omega peptidase (Awade et al. 1994; Browne and O’Cuinn 1983; Dando et al. 2003), and due to their increased abundance in liver cytosol in the presence of DTT and in kidney cytosol with NADPH or DTT, it can be concluded that at least this preparation/lot of liver cytosol is missing glutathione reductase, thioredoxin reductase, or parts of these systems.
To further identify the type of involved proteases in human, several protease inhibitors were used together with human liver or kidney cytosol. The selected inhibitors were aprotinin, leupeptin and EDTA, as they were also included in Sigma-Aldrich cocktail inhibitor. As already mentioned, aprotinin is a broad-spectrum serine protease inhibitor, while leupeptin not only inhibits wide range of serine proteases, but also some cysteine and threonine proteases, and due to its broad effect on various proteases, was included. EDTA was included due to its broad inhibitory effect on metallopeptidases. Additionally, both NADPH and DTT were included separately. The results are presented in Figs. 2 and 3 In the presence of aprotinin and leupeptin, only very minor inhibition was detected in liver or kidney cytosol with or without DTT or NADPH. Still, the role of serine proteases in the degradation of leuprorelin cannot be fully excluded, as some serine proteases are not inhibited by either aprotinin or leupeptin. For example, neurotrypsin, which is expressed in human neural system, is not inhibited by either aprotinin or leupeptin (Rawlings and Salvesen 2013). In the presence of EDTA, clearly changed catabolite profiles were observed both in the liver cytosol and kidney cytosol. As above, the catabolite profiles in liver cytosol in the absence and presence of NADPH were identical, and no clear inhibitory effect by EDTA was observed, although in the presence of NADPH, the formation of M3 was slightly decreased. In the incubation with liver cytosol supplemented with DTT, EDTA partially inhibited the formation of catabolites formed by a hydrolytic cleavage between histidine and tryptophan (M2 and M6); tryptophan and serine (M9 and M13), and serine and tyrosine (M5 and M11). Additionally, the formation of catabolites M7 and M8, cleaving pyroglutamic acid followed by the cleavage of N-ethylated C-terminus, were increased in the presence of EDTA. The stabilization of pyroglutamyl peptidase I activity in the presence of EDTA has been reported before, and the slight increase of catabolites M7 and M8 might be contributed to this effect (Szewczuk and Kwiatkowska 1970; Tsuru et al. 1982). Furthermore, a slight increase was also detected for the formation of catabolite M15, a hydrolysis between arginine and proline. The results suggest that the formation of M2, M6, M9, M13, M5 and M11 is at least partially catalyzed by metalloproteases. Wesche et al. (Wesche et al. 2022) incubated leuprorelin with cathepsin G, neutrophil elastase, and trypsin (serine proteases) and MMP12 (metalloprotease). Of these proteases, both trypsin and MMP12 were able to cleave leuprorelin between histidine and tryptophan. Additionally, the inhibition of endopeptidases increases the relative catabolism via omega and exopeptidases, as increase was detected for M7, M8 and M15.
Fig. 2
The effect of leupeptin, aprotinin and EDTA on leuprorelin catabolite profiles in human liver cytosol (HLC) in the absence and presence of NADPH and DTT
Fig. 3
The effect of leupeptin, aprotinin and EDTA on leuprorelin catabolite profiles in human kidney cytosol (HKC) in the absence and presence of NADPH and DTT.
In kidney cytosol supplemented with NADPH or DTT, formation of catabolites M5 and M11, formed via hydrolysis between serine and tyrosine was partially inhibited, similarly to liver cytosol (in the presence of DTT). Furthermore, the formation of catabolites M7 and M8, related to the cleavage of pyroglutamic acid, was not increased in the presence of EDTA, but rather slightly inhibited. The formation of M15, hydrolysis between arginine and proline, increased slightly in the presence of EDTA, as does the formation of catabolites related to the cleavage between tryptophan and serine (M9 and M13), suggesting that there are likely organ-dependent differences (liver vs. kidney) in proteases involved in formation of these abundant NADPH-dependent catabolites M9 and M13. Furthermore, the catabolite profiles and catabolic turnover of leuprorelin were similar in the kidney cytosol incubations supplemented with NADPH or DTT.
DiscussionIn general, the leuprorelin catabolite profiles produced with rat and human derived (described in our earlier work) hepatic in vitro enzyme sources were quite similar. The main catabolites in S9 fraction in the absence of NADPH and in hepatocytes were the same, i.e. M3 in S9 fraction and M3, M11 and M13 in hepatocytes. In the incubation with liver S9 fraction supplemented with NADPH, slight differences were observed between the species, as M13 was the main catabolite in rat, while M7 was the main catabolite in human, although followed by M13. The number of catabolites detected in hepatic in vitro models between rat and human were also relatively similar. On the contrary, in extrahepatic enzyme sources, some rather large interspecies differences were observed. In the incubation with kidney S9 fraction supplemented with NADPH, main catabolite in both human and rat was M11, but while multiple other catabolites were detected in human, the catabolic turnover in rat kidney S9 fraction mostly resulted in M11. The difference in the number of detected catabolites was notable, as 14 catabolites was detected in human, and only five in rat. Furthermore, in the incubations with kidney S9 fraction in the absence of NADPH, M3 was the major catabolite in human, while M11 was the main catabolite in rat. In this system, the number of catabolites was almost similar, as eight catabolites were detected in human and nine in rat. Lastly, no interspecies differences in the catabolite profiles of leuprorelin in intestinal S9 fraction or plasma were detected, as all systems produced the same major catabolites (in the case of intestinal S9 fraction) or leuprorelin was stable, as in plasma. Generally, results correlate well between human and rat derived models, but some, unpredictable differences can be observed in models from different tissues.
The published data on in vivo catabolism of leuprorelin is relatively scarce, but four in vivo catabolites of leuprorelin in both human and nondisclosed “animals” have been reported (Chia 2021; Sofianos et al. 2008), of which three were also detected as circulating catabolites in rat in vivo described here. The missing catabolite in this study was dipeptide M-IV (PyrH), corresponding to M6, which was detected in hepatic in vitro models in rat and human, and with human kidney S9 fraction in the presence of NADPH and plasma. It might be that this catabolite is human specific and is therefore not formed in rat in vivo. The pentapeptide M-I (YLLRPNHEt), which corresponds to catabolite M11, was the main catabolite detected in rat in vivo, and was also detected in the incubations with most in vitro systems, being absent only in rat in vitro plasma incubation. Both tripeptides, M-II (YLL, corresponding to catabolite M1) and M-III (PyrHW, M14) were minor catabolites in rat in vivo and were also absent in most of the in vitro models. Surprisingly, the second most abundant catabolite in rat in vivo, tripeptide M12 (LRPNHEt), has not been reported in the literature.
Recently, a report on the current industry practices on the studies on the metabolism and excretion of therapeutic peptides was published (He et al. 2023). The therapeutic peptides were divided into three categories: linear peptides with proteinogenic amino acids, linear peptides with non-proteinogenic amino acids, and cyclic peptides. Leuprorelin is a linear peptide with non-proteinogenic amino acids, but none of the therapeutic peptides were as small as leuprorelin, as most of the therapeutic peptides in this class had more than 25 amino acids. The most used in vitro metabolism system for the therapeutic peptides in this category among the industry was plasma, followed by tissue homogenate. Additionally, hepatocytes and liver S9 fraction were also often used. Based on the results of this study, kidney S9 fraction offers an additional model to be considered in the development of therapeutic peptides, and in this case provided the best in vitro–in vivo correlation. Additionally, depending on the route of administration of the peptide and its target, the supplementation of the incubation with either NADPH or DTT could be valuable, especially when identifying potential catabolic hotspots in reductive environment i.e. in the cell for cell-penetrating peptides (Gori et al. 2023).
Comments (0)