scRNA-seq data processing
10×Genomics scRNA-seq data (GEO accession GSE174574) [24] was analyzed in Python using the Scanpy package. Cells with over 20,000 UMIs, > 20% mitochondrial genes, or potential doublets were excluded. Batch effects were corrected with BBKNN, and the top 3000 variable genes were used for principal component analysis. Two-dimensional visualization was done via TSNE. Clusters were annotated based on known markers and merged when expressing the same marker set. Differentially expressed genes and volcano plots were generated using the SCP pipeline in R.
Bulk RNA-Seq data processing
We will first read the scRNA-seq data using R to obtain 10x Genomics single-cell data from the GEO database (accession number GSE174574). Quality control will be performed on each sample, selecting cells with between 500 and 20,000 unique molecular identifiers (UMIs) and excluding those with a mitochondrial gene percentage greater than 25% for further analysis. We will utilize the DoubletFinder package (https://github.com/chris-mcginnis-ucsf/DoubletFinder) to remove doublets from the dataset.To correct for batch effects between groups, we will apply the Harmony algorithm (https://github.com/immunogenomics/harmony) for sample integration. Following data normalization and scaling, we will identify the 3,000 most variable genes in the dataset for principal component analysis. We will then use the FindClusters function for unsupervised clustering and visualize the results with UMAP.Clusters will be annotated based on previously identified marker genes and merged if they express the same set of marker genes. Clusters categorized as microglia will be extracted for differential expression analysis. All figures will be generated using built-in functions from the Seurat (v4.4) workflow and ggplot (v3.5.1) from the R tidyverse package.
Ethics and animals
This study was approved by the Institutional Animal Care and Use Committee of the First Affiliated Hospital of Soochow University and followed NIH animal care standards. Wild-type C57BL6/J mice were obtained from the Chinese Academy of Sciences, and CX3CR1Cre/ERT2 mice from the Shanghai Nanfang Research Center. All mice were housed in pathogen-free conditions on a 12-hour light/dark cycle with food and water access. Male mice aged 8–12 weeks (20–25 g) were used for in vivo experiments.
Establishment of MCAO/R model in mice
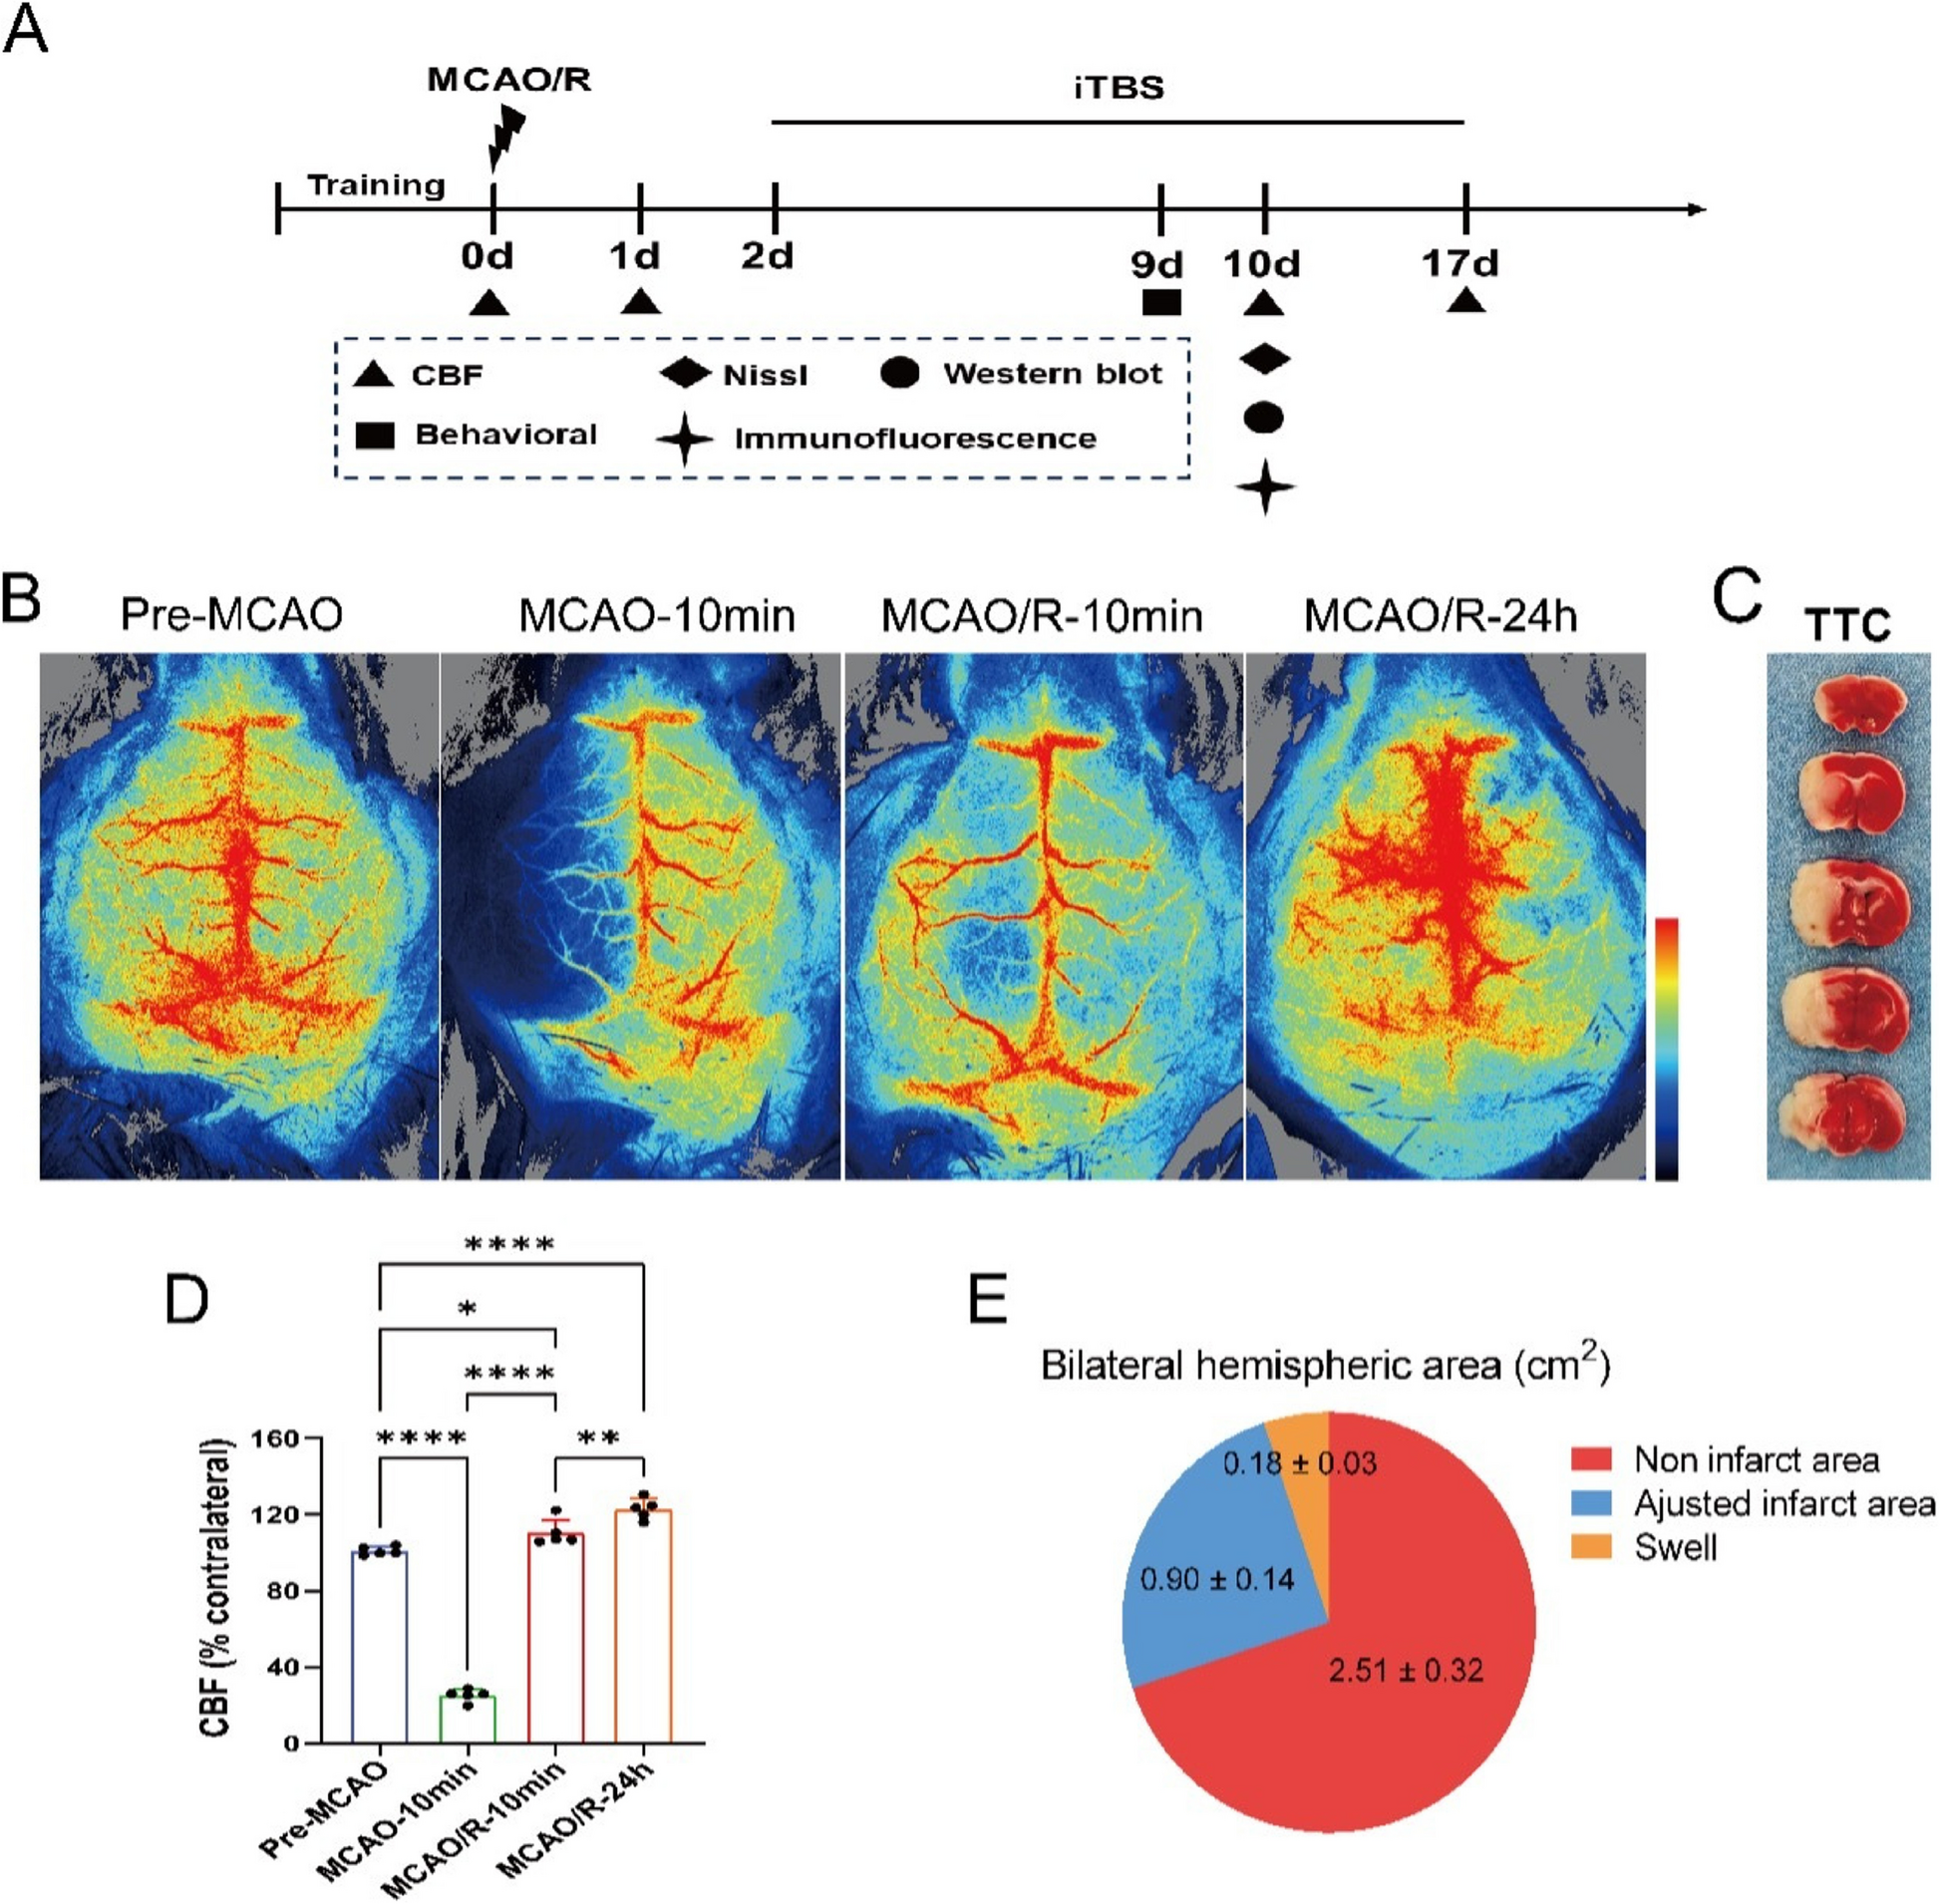
Mice were anesthetized with 3% isoflurane, maintained at 1.5%, and a midline neck incision was made to expose the right common (CCA), external (ECA), and internal carotid arteries (ICA). A 6–0 silicone-coated filament was inserted via the ECA into the ICA to occlude the middle cerebral artery (MCA), inducing ischemia for approximately 1.5 h, after which the filament was withdrawn to allow reperfusion [25]. Sham-operated mice underwent the same procedure without filament insertion.
Cd74 knockdown in microglia via CX3CR1Cre/ERT2 mice and DIO-Sequence AAV
CX3CR1Cre/ERT2 mice (B6.129P2(C)-Cx3cr1tm2.1(cre/ERT2)Jung/J) were anesthetized with 3% isoflurane, maintained at 1.5%, and positioned in a stereotaxic frame (RWD Life Science, Shenzhen, China). A total of 1 µl of either rAAV-SFFV-DIO-mCherry-5’miR-30a-shRNA (Scramble) or rAAV-SFFV-DIO-mCherry-5’miR-30a-shRNA (CD74) virus (5 × 10^12 vg/µL) was injected into three target sites (2.0 mm lateral; +0.5, 0, -0.5 mm anterior-posterior to bregma; 1.5 mm depth) at 0.06 µl/min using a microsyringe pump. After injection, the syringe was left in place for 10 min. Fourteen days post-injection, tamoxifen (75 mg/kg, Selleck, China) was administered intraperitoneally for five consecutive days to activate Cre recombinase expression.
2, 3, 5-Triphenyltetrazolium chloride (TTC) staining
Mice were sacrificed 3 days post-MCAO/R, and brains were sectioned into 1-mm coronal slices. These were incubated in TTC solution (Jiancheng Biotech, Nanjing, China) for 15–30 min at 37 °C in the dark. Infarct volume, adjusted for edema, was calculated using ImageJ software with the formula: [(contralateral hemisphere volume - non-infarct area of ipsilateral hemisphere) / (contralateral hemisphere volume × 2)] × 100%.
Western blot analysis
Brain tissues were homogenized in ice-cold lysis buffer (Beyotime, Shanghai, China) containing protease inhibitors. After centrifugation at 12,000 rpm for 20 min at 4 °C, protein concentrations in the supernatant were determined using a BCA assay kit (Beyotime). Proteins (20 µg per lane) were separated on a 12% SDS-PAGE gel, transferred to PVDF membranes (Millipore, USA), and blocked with 5% BSA (Biosharp, Hefei, China) for 1 h. Membranes were incubated overnight at 4 °C with the primary antibody (CD74, 1:200, #77274, Cell Signaling Technology, USA), followed by HRP-conjugated secondary antibody at room temperature for 1 h. Bands were detected by enhanced chemiluminescence, quantified with ImageJ (NIH), and β-tubulin was used as a loading control.
Immunofluorescent analysis
Mouse brain tissue was perfused, fixed with paraformaldehyde, and dehydrated in a sucrose gradient for 2 days. The tissue was then frozen and sectioned into 20 μm coronal slices. Mounted sections were fixed in paraformaldehyde for 15 min, antigen-repaired for 15 min, and permeabilized with 0.1% Triton for 10 min. Sections were blocked with 5% BSA, incubated with primary antibodies overnight at 4 °C, followed by secondary antibodies at room temperature for 1 h. Nuclei were counterstained with DAPI, and fluorescence images were captured using an Olympus VS200 microscope (Olympus, Tokyo,apan).
Enzyme-linked immunosorbent assay (ELISA)
Infarcted hemispheres from MCAO/R mice and corresponding hemispheres from sham controls were collected and homogenized in 0.9% saline 3 days post-MCAO/R. After centrifugation, the supernatant was analyzed for inflammatory cytokines using an ELISA kit (Bioswamp, Wuhan, China), with cytokine concentrations determined from OD values.
Quantitative real-time PCR (qRT-PCR)
Total RNA was extracted from brain tissue using TRIzol (Invitrogen) following the manufacturer’s instructions. cDNA was synthesized with the High-Capacity RNA-to-cDNA Kit (Invitrogen). Target gene mRNA levels were quantified by real-time PCR using PowerUp SYBR Green Master Mix (Thermo Fisher Scientific, USA) and normalized to β-actin. Primer sequences were as follows: IL-1β (F: TCGCAGCAGCACATCAACAAGAG, R: AGGTCCACGGGAAAGACACAGG); TNF-α (F: ATGTCTCAGCCTCTTCTCATTC, R: GCTTGTCACTCGAATTTTGAGA); IL-6 (F: CTCCCAACAGACCTGTCTATAC, R: CCATTGCACAACTCTTTTCTCA); β-actin (F: GGCTGTATTCCCCTCCATCG, R: CCAGTTGGTAACAATGCCATGT).
Rotarod test
Motor function was evaluated in mice at 3, 5, 7, 14, and 28 days following MCAO/R using the Rotarod test. Each group consisted of 10 mice, which were placed on a rotating cylinder that gradually accelerated. The time taken for the mice to fall off the rod was recorded as the fall latency. Prior to the surgery, the mice underwent five days of training. On the first two days, they were trained once daily on a slow-rotating rod (accelerating from 0 to 10 rpm over 30 s). On the third day, the mice were trained on both low-speed and high-speed rods, with acceleration from 4 to 40 rpm over 2 min. On the fourth day, the mice were trained twice on the high-speed setting, and on the fifth day, they were trained three times at high speed. The data collected on the fifth day were used as baseline measurements for comparison.
Adhesive removal test
The adhesive removal test was employed to assess motor coordination deficits in mice following stroke. A piece of adhesive tape (0.4 × 0.3 cm²) was applied with consistent pressure to the medial aspect of the left forelimb. The mice were then placed into a transparent cage, and the time required for them to contact and remove the tape was measured, with a maximum duration of 120 s. Prior to surgery, the mice underwent training for five consecutive days, with three trials per day. Testing was conducted at 3, 5, 7, 14, and 28 days after the stroke model was established.
Open field test
The open field test was employed to evaluate changes in exploratory behavior and neuropsychiatric function following cerebral ischemia in mice. The apparatus consisted of a plastic enclosure (40 × 50 × 40 cm) equipped with an automated video recording system. The floor of the box was divided into 4 × 4 grids, with the central four grids designated as the central zone. Mice were placed in the center of the field, and their spontaneous activity was recorded for 10 min. Key parameters, such as average speed and total distance traveled, were calculated. Additionally, the time spent in the central zone and the frequency of entries into this area were quantified. For acclimatization, each mouse was placed in an empty box for 15 min over five consecutive days. Testing began 24 h after the last acclimation session.
Statistical analysis
Data were analyzed using GraphPad Prism (version 8.0, USA) and presented as means ± SEM. For comparisons between two groups, an unpaired two-tailed Student’s t-test was applied. For multiple group comparisons, one-way ANOVA with Tukey’s post hoc test was used. For two-way comparisons with two factors, two-way ANOVA followed by Bonferroni’s or Tukey’s post hoc analysis was performed. Statistical significance was set at p < 0.05.


Comments (0)