Animals
This study used SPF-grade male C57BL/6 mice (8 weeks old, 22–24 g) from Shanghai Jihui Experimental Animal Co., Ltd. Upon arrival, the animals were acclimatized for 2 weeks before the start of the experiments. The mice were housed in a temperature-controlled environment (22 ± 1 °C, 50 ± 1% humidity) with a 12-h light/dark cycle and ad libitum access to food and water. The euthanasia of the mice was performed via the intraperitoneal injection of sodium pentobarbital (100 mg/kg–150 mg/kg). This work was performed in accordance with the principles of the Declaration of Helsinki. Approval was granted by the Animal Care and Use Committee of Huashan Hospital, Fudan University (Approval No. 2021 JS Huashan Hospital-128).
Focal cerebral ischemia/reperfusion
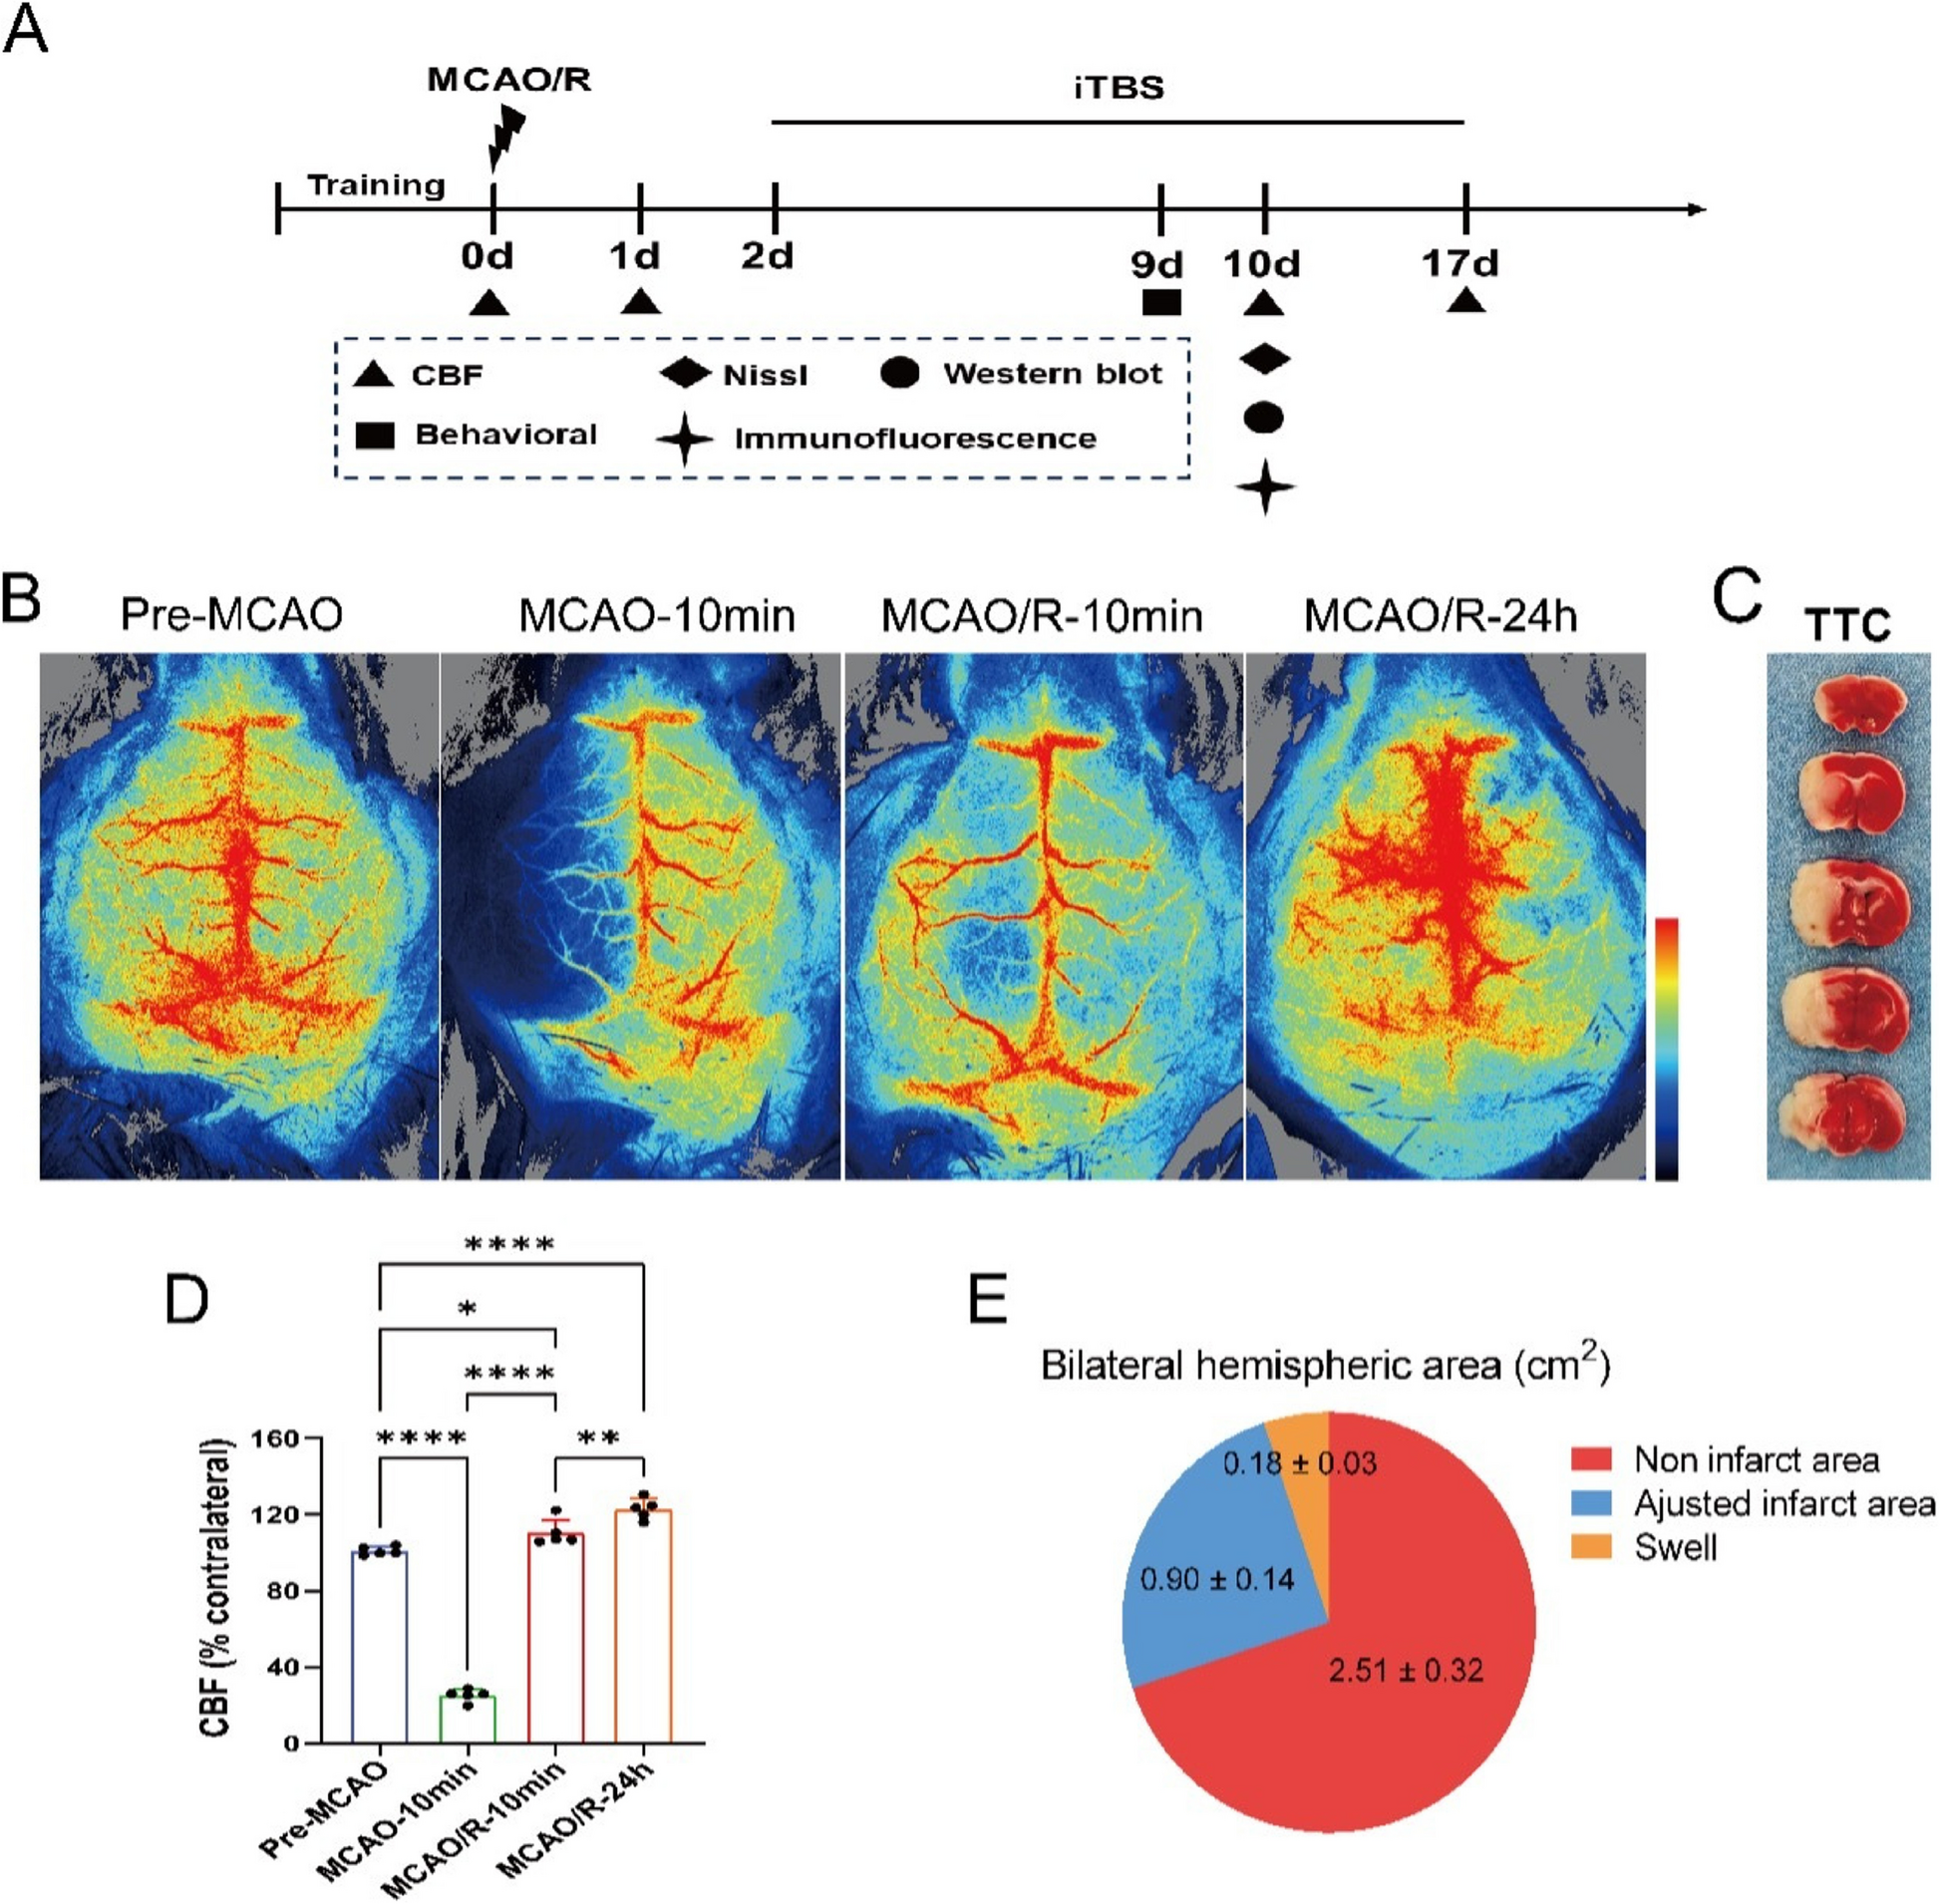
Focal cerebral ischemia/reperfusion was induced by occlusion of the left middle cerebral artery (MCAO), followed by reperfusion. The mice were anesthetized with 1% pentobarbital sodium (100 mg/kg, intraperitoneally) and positioned supine on a heating pad to maintain body temperature (37.0 ± 0.3 °C). A midline neck incision was made to isolate the left common carotid artery (CCA), external carotid artery (ECA), and internal carotid artery (ICA). The CCA and ICA were ligated, and the ECA was incised to insert a silicone-coated 6–0 suture (602156PK; Doccol Corp, USA). The ECA stump was flipped, and the ICA ligation was loosened to advance the suture until resistance indicated focal ischemia onset. After 60 min of ischemia, the suture was removed to allow reperfusion, followed by closure of the neck incision in layers. A topical application of bupivacaine was used for pain relief, and the mice were placed in a warm cage for recovery. In the sham groups, the same protocol was used as in the MCAO/R group, but the middle cerebral artery was not occluded. Instead, a surgical incision is made, and the vessel is manipulated without inducing ischemia.
Cerebral blood flow (CBF) detection
Cerebral blood flow changes in the mice were measured via a laser speckle flow imaging system (RWD Life Science, Shenzhen, China). After MCAO, the mice were secured in a stereotaxic frame, and a midline incision was made to expose the skull and maintain the hydrogel. The imaging system was activated to locate the target brain region, and parameters, including the image processing mode, spatial filtering constant, frame rate, and recording mode, were set. CBF measurements were taken at baseline, 10 min postischemia, 10 min postreperfusion, and on days 1, 10, and 17 postreperfusion.
Animal grouping
In the experiment, the number of mice in each experimental group was n = 15–25, with the sample size determined on the basis of preliminary experiments, considering Type I error (α), power (1–β), and the modeling success rate. This experiment used the random number table method for grouping (1) the sham group (n = 15), (2) the MCAO/R group (n = 25), and (3) the MCAO/R + iTBS group (n = 25). Throughout the experiment, we made every effort to ensure that all experimental groups were subjected to identical conditions, including proper personnel arrangements, optimal temperature, normal animal physiological rhythms, and the use of blinded detection and data analysis to minimize the influence of both subjective and objective factors.
rTMS treatment
rTMS was delivered via a device (CCY-II, Wuhan Yirui Medical Equipment, China) with a 64 mm circular coil (peak magnetic output of 3.46 T). Needle electrodes were used to assess motor-evoked potentials (MEPs) in the contralateral gastrocnemius muscle. The resting motor threshold (RMT) was defined as the minimum output required to elicit MEP peak amplitudes exceeding 50 μV in at least 5 of 10 trials, with the average RMT set at 25% of the maximum output (20–30%). The stimulation intensity was set at 100% of the average RMT. The mice in the iTBS group received two daily sessions (10 bursts at 50 Hz, repeated 20 times at 5 Hz intervals) starting 48 h post-MCAO/R injury, with sessions spaced 6 h apart for 7 or 14 days. The sham groups received the same protocol with the coil positioned 15 cm above the head. Prior to iTBS, the mice underwent adaptive grip training to acclimate to the stimulation.
Behavioral assessmentsOpen field test
The open field test was used to assess exploratory behavior in mice following cerebral ischemia. The experimental setup consisted of a three-dimensional white plastic arena (40 × 40 × 50 cm) and an animal motion tracking system (EthoVision XT15, Noldus, Netherlands). After the system settings were adjusted, the mice were placed at the center of the open field, and their freely moving trajectories were recorded for 5 min. The EthoVision system was used to analyze the total distance traveled and the average speed of each mouse within the arena.
Cylinder test
The cylinder test was used to evaluate forelimb usage asymmetry in mice with cerebral ischemia. The apparatus consisted of a transparent cylinder (8 cm diameter, 15 cm height) with mirrors and a high-definition slow-motion camera. The mice were placed in the cylinder, and the frequency with which each forelimb (left, right, or both) touched the walls was recorded over 5 min. The laterality index was calculated via the following formula: Laterality Index = (left + 0.5 × both)/(right + left + both) × 100%.
CatWalk gait test
Gait function was assessed via the CatWalk XT gait analysis system (Noldus, Netherlands). A high-speed camera recorded the mouse parameters as they traversed a glass walkway. The mice were acclimatized for 3 days prior to testing. In a quiet, dimly lit room, each mouse was recorded to complete the gait task at least three times. The key metrics included walking duration, standing time, limb swing time, speed, gait cycle, average walking speed, stride length, and gait frequency.
2,3,5-Triphenyltetrazolium chloride (TTC) staining
TTC staining was used to assess the infarct area in the mice after cerebral ischemia. The mice were deeply anesthetized with 1% pentobarbital sodium and underwent cardiac perfusion with cold 1X PBS. The brains were extracted and sectioned into 2 mm thick slices via a mouse brain mold along the coronal plane. The slices were incubated in 2% TTC solution (Solarbio, China) at 37 °C in the dark for 20 min, followed by fixation in 4% neutral-buffered formaldehyde (pH 7.4) for 5 min. Unstained areas (white) represent the infarct regions. The infarct area and total hemispheric area were calculated via ImageJ software (National Institutes of Health, USA). The edema index was determined by dividing the left hemisphere area by the right hemisphere area, and the actual infarct area was calculated by dividing the infarct area by the edema index.
Tissue preparation
Animal samples were subjected to protein blotting, Nissl staining, ELISA for inflammatory factor detection, and immunofluorescence staining. Brain tissue samples were collected via cardiac perfusion with 1 × PBS and subsequently extracted. The tissue was coronally sectioned around the infarct area and quickly frozen in liquid nitrogen before being stored at −80 °C. For Nissl and immunofluorescence staining, brain tissue was perfused with 1 × PBS, fixed in 4% PFA at 4 °C for 24 h, and then dehydrated through 10%, 20%, and 30% sucrose solutions before being sectioned with a cryostat.
Nissl staining
Nissl staining was used to assess neuronal damage in the peri-infarct region after cerebral ischemia. The frozen sections were dehydrated through 70%, 95%, and 100% ethanol (5 min each) and washed three times with 1 × PBS (5 min per wash). The sections were stained with Nissl staining solution (crystal violet) for 5 min at 37 °C in the dark and rinsed three times with ddH2O. The samples were subsequently processed in Nissl differentiation solution for 3 min at room temperature, fixed in anhydrous ethanol for 5 min, air-dried, and mounted with neutral resin.
TdT-mediated dUTP nick end-labeling (TUNEL)
The TUNEL assay was performed using a kit (Solarbio, China) to detect in situ apoptosis of neurons [22]. The apoptosis index was calculated as the number of TUNEL-positive cells divided by the total number of cells in each field of view. Observations were conducted via an Olympus Fluorview-3000 confocal microscope (Olympus Optical Co., Japan).
Immunofluorescence staining
Frozen brain tissue Sects. (30 µm thick) were subjected to immunofluorescence staining. The sections were washed three times with 1 × PBS (10 min each), and a hydrophobic barrier was drawn around the edges via an immunohistochemical pen. The samples were incubated with BSA containing 0.3% Triton X-100 (Sigma, Germany) for 20 min, followed by 40 min with additional BSA. The following primary antibodies were applied overnight at 4 °C: anti-NeuN (Abcam, 1:300, UK), anti-NeuN (Proteintech, 1:300, USA), anti-C3d (R&D Systems, 1:200, USA), anti-S100A10 (Proteintech, 1:200, USA), anti-GFAP (Proteintech, 1:300, USA), anti-GFAP (Cell Signaling Technology, 1:300), anti-CD31 (R&D Systems, 1:200, USA), anti-IBA1 (FUJIFILM WAKO, 1:300, Japan), anti-CD86 (Abcam, 1:200, UK), and anti-CD206 (R&D Systems, 1:300, USA) antibodies. After being washed three times with 1 × PBS (5 min each), the sections were incubated with an Alexa Fluor-conjugated secondary antibody (Abcam, 1:1000, UK) for 1.5 h. Finally, the sections were mounted with anti-fade medium containing DAPI (Solarbio, China) for nuclear staining. The samples were observed with an Olympus Fluorview-3000 confocal microscope (Olympus Optical Co., Japan), and ImageJ software (National Institutes of Health, USA) was used for quantitative analysis of the immunofluorescence intensity in each experimental group. The morphological counting analysis in this section involved selecting three distinct fields of view from the peri-infarct region of each brain section for each experimental group of mice and calculating the average value.
Transcriptome sequencing and analysis
The sequencing technique used was total transcriptome sequencing. The experimental group consisted of 3 samples, and the control group also had 3 samples. The experimental animals were C57BL/6 mice with a stable genotype. The covariate is set at 0.1, the target effect between the experimental group and control group is 1.5, and the false positive rate is 0.05. The statistical power of this experimental design, calculated in RNA Seq Power, is 0.91. The RNA transcriptome sequencing methodology used was described in our previous report [22]. Total RNA was extracted from brain tissue via Trizol reagent (Invitrogen, USA) per the manufacturer's instructions. RNA quantity and purity were assessed with a microultraviolet spectrophotometer, and integrity was verified via an Agilent 2100 Bioanalyzer and agarose gel electrophoresis. The RNA libraries were constructed via the TruSeq RNA Library Prep Kit, and sequencing was performed by LC-Bio Technology Co., Ltd. (Hangzhou, China).
Statistical analysis
Statistical analysis and data plotting were conducted via GraphPad Prism 9.0 software (GraphPad Software Inc., San Diego, USA). The data are presented as the means ± standard errors of the means (SEMs). The 3σ rule was applied, assuming that the data followed a normal distribution. It is estimated that 99.73% of the data points lie within three standard deviations of the mean, and any values outside this range are considered outliers. No experimental data points were excluded from this study. Differences between groups were compared via one-way analysis of variance (ANOVA), whereas statistical comparisons between two groups were conducted via unpaired t tests. A p value of < 0.05 was considered statistically significant.


Comments (0)