
Remember me

Results are structured as follows: We first report within-culture (UK, followed by Japan), and subsequently cross-culture analyses. Within each section, we first report confirmatory analyses relating to our pre-registered hypotheses, followed by exploratory analyses. For the purpose of readability and logical progression, the order in which confirmatory analyses are presented is different than that initially set out in the pre-registration.
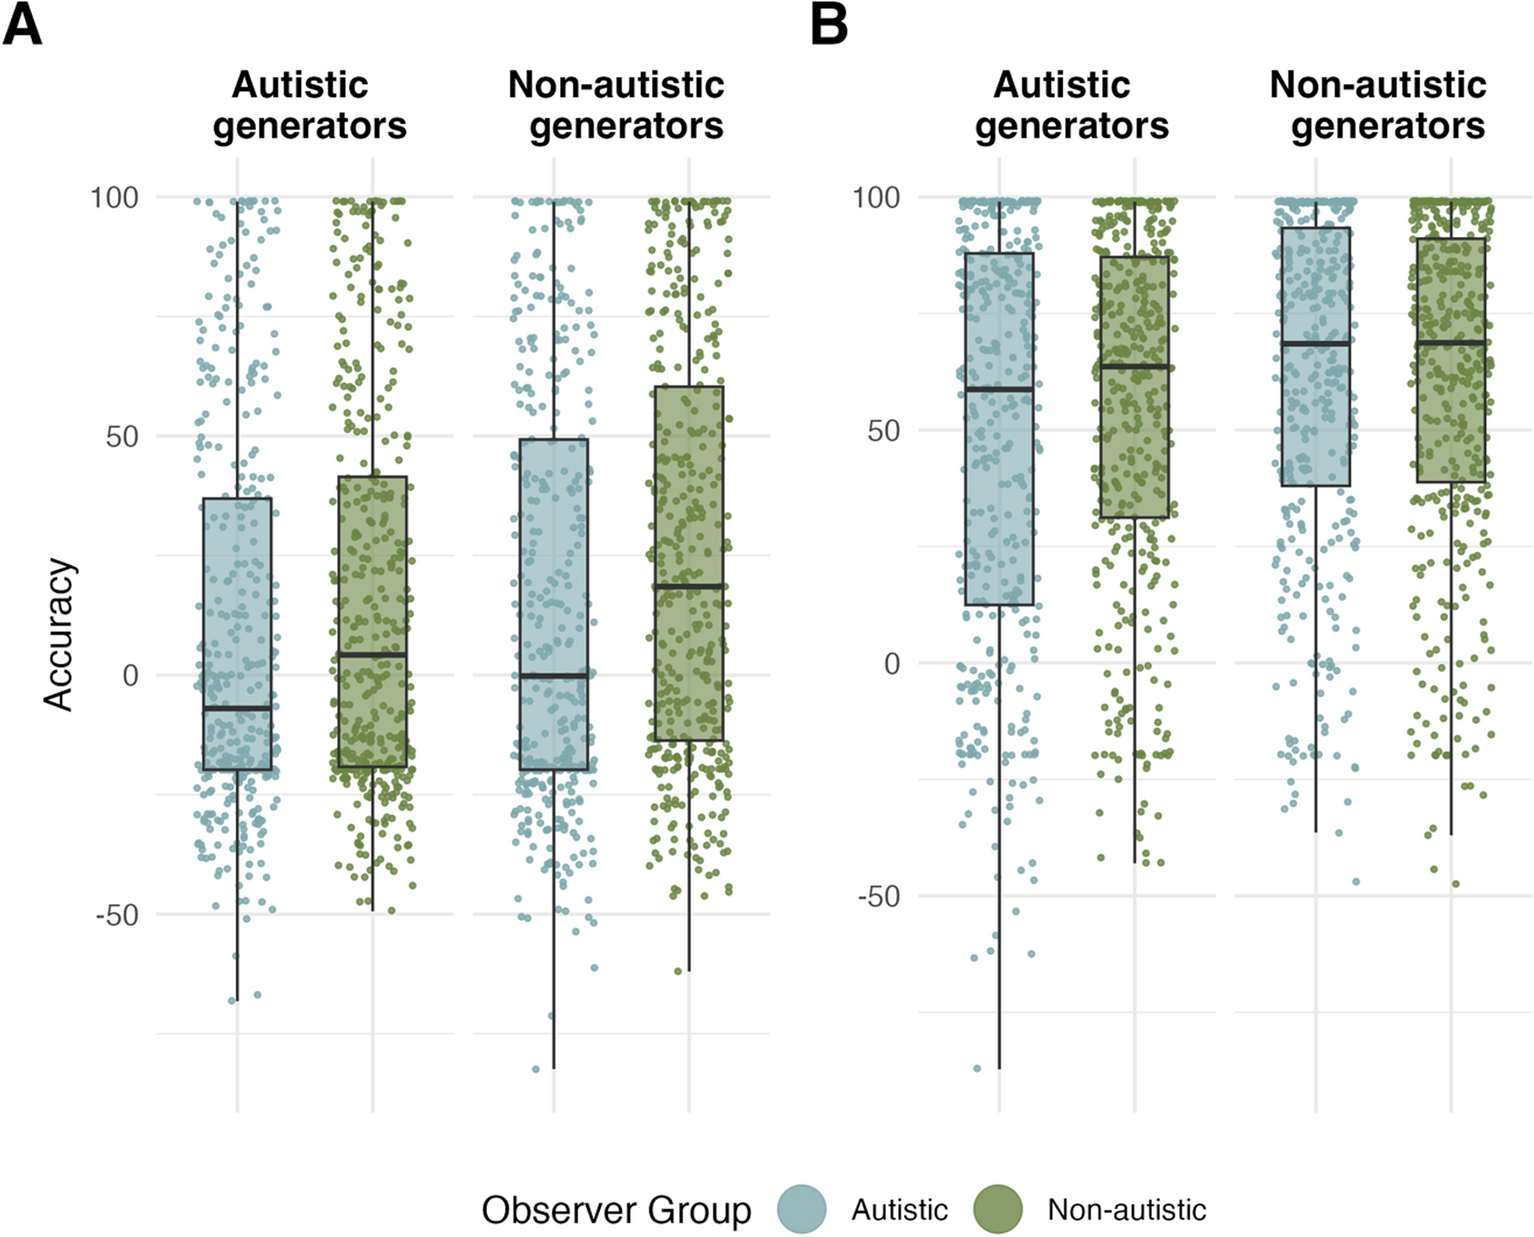
Within-culture analyses: UKUK non-autistic adults exhibit poorer mentalising performance when interpreting animations created by autistic participantsWe had two pre-registered hypotheses specifying our expectation that our results would replicate the findings of Edey et al. [26]. Hypothesis 2 predicted that non-autistic adults would struggle more to accurately interpret animations created by the autistic relative to their own generator group. Hypothesis 4 predicted that, as in Edey et al. [26], autistic participants would not show the same own-group benefit and thus exhibit comparable performance for animations generated by autistic and non-autistic groups. To test this, we used a Bayesian mixed-effects model (Model UK.1) with random intercepts and slopes for each predictor term varying by subject ID and animation ID (unique identifier for each animation), fitted to accuracy (see Animations Task) and the dummy coded predictors generator group (termed gen in effect indices; autistic [aut] vs non-autistic [non-aut]; reference level = non-aut) and observer group (termed obs in effect indices; autistic [aut] vs non-autistic [non-aut]; reference level = non-aut). To allow direct comparisons to the results in Edey et al. [26], this first model was fitted to accuracy in the mental state condition only. When only regarding mental state animations, there was a trend towards an effect for the contrast of autistic and non-autistic generators among non-autistic observers, indicating that overall, non-autistic adults tended to perform worse when interpreting animations created by autistic, relative to non-autistic adults (\(_\) = − 7.06, CrI = [− 15.55, 1.40]; \(P(E\mu <0)\) = 0.95; Note that, although strongly left-leaning, there is increased uncertainty around this effect). Post-hoc contrasts further showed that among autistic observers, there was no difference in performance between animations generated by the autistic or non-autistic group (\(_\) = − 4.07, CrI = [− 14.00, 5.65]), supporting hypothesis 4. Finally, considering animations created by the other group, autistic and non-autistic adults performed comparably, as indicated by a lack of interaction between observer group and generator group (\(_\) = 2.99, CrI = [− 4.31, 10.40], \(_\) = 14.30, CrI = [6.70, 21.90], \(_\) = 15.50, CrI = [8.14, 23.50]; Fig. 1A).
Fig. 1
Accuracy by observer and generator group, UK data only for A mental-state animations. Autistic and non-autistic observers viewing animations created by autistic generators (left); non-autistic generators (right). B Non-mental state animations. Autistic and non-autistic observers viewing animations created by autistic generators (left); non-autistic generators (right). Central marks of box plots correspond to the median; outer hinges correspond to the first and third quartiles (25th and 75th percentiles). Upper and lower whiskers extend to largest and lowest values at most 1.5 * IQR of the hinge
We then explored whether the results above depended on mental state condition by adding the dummy-coded factor mental state (mental vs non-mental; reference level = mental) to Model UK.1 (Model UK.2). Within non-autistic observers, this model showed a stronger, robust effect for generator group, with no interaction between mental state condition and generator group (mental state: \(_\) = − 8.60, CrI = [− 15.60, − 1.60], \(P(E\mu <0)\) = 0.99; mental- vs non-mental state: \(_\) = 2.34, CrI = [− 7.11, 11.85], Fig. 1B), suggesting that the non-autistic observer group struggled to interpret animations generated by autistic adults, regardless of whether they conveyed mentalistic interactions or not, and thereby adding further support for hypothesis 2. Similarly, considering hypothesis 4, among autistic observers, there was no interaction between generator group and mental state condition, indicating that the lack of own-group benefit in this group did not depend on whether animations contained mentalistic interactions or not (\(_\) = − 3.59, CrI = [− 15.13, 7.24]). Finally, this model showed no three-way interaction of generator group, observer group, and mental state (\(_\) = − 5.90, CrI = [− 14.50, 2.77], suggesting that autistic and non-autistic participants showed comparable performance for other group-generated animations regardless of mental state condition.
In UK participants, movement similarity predicts accuracy for non-mental state animations generated by autistic participants onlyPrevious literature suggests that individuals use visuo-motor representations of their own movements to interpret the movements of others, and that higher kinematic similarity between agent and observer facilitates mentalising in the observer [32,33,34]. Although it is possible that there are fundamental differences in such putative motor simulation processes between autistic and non-autistic individuals (evidence is highly inconclusive; see Yates & Hobson [87]), a plausible alternative explanation for poorer mentalising performance in autistic individuals in previous studies employing animation tasks may be that there was little kinematic overlap between the (mostly experimenter-created) animation stimuli and the autistic participants’ own movements. If the latter notion is true, one should expect to observe a positive effect of movement similarity on mentalising accuracy among both autistic and non-autistic observers when stimuli are used which are representative of a broad spectrum of movement kinematics. Our hypothesis 5 thus predicted that we would observe an effect of movement similarity in the UK sample, irrespective of observer group.
Jerk difference was calculated by first subtracting the mean jerk (jerk was calculated as the third order non-null derivative of the raw positional data; for more details, see Schuster et al. [33]) of each video a participant rated from their own jerk values (derived from their animation of the same word), and then taking the absolute magnitude of those values. Thus, jerk difference serves as an index to observer-animator movement similarity, wherein lower values reflect higher jerk similarity. To test hypothesis 5, we ran a Bayesian mixed-effects model (Model UK.3) fitted to accuracy, jerk difference, the dummy-coded factor mental state (mental vs non-mental; reference level = mental) and their interaction with random intercepts for subject ID and animation ID and a random slope for all predictor terms varying by subject ID. This model revealed a negative effect of jerk difference (or a positive effect of movement similarity) for both mental- and non-mental state animations (\(_\) = − 2.00, CrI = [− 3.96, − 0.03];
\(P(E\mu <0)\) = 0.98; \(_\) = 1.10, CrI = [− 2.80, 5.06]), suggesting that participants showed higher accuracy for animations wherein movements were more similar to their own. Adding the factor observer group to Model UK.3 (Model UK.4) resulted in a preserved effect for jerk difference (albeit with slightly increased uncertainty surrounding the effect: \(_\) = − 2.51, CrI = [− 5.11, 0.04]; \(P(E\mu <0)\) = 0.97), and did not reveal an interaction between observer group and jerk difference (\(_=\) 0.96, CrI = [− 2.31, 4.27]), suggesting that this effect did not depend on autism diagnosis and thereby supporting hypothesis 5. An exploratory model (Model UK.5) excluding observer group, but including the predictor generator group (autistic vs non-autistic; reference level = non-autistic) showed an interaction between jerk difference, generator group and mental state (\(E\mu\) = − 6.07, CrI = [− 11.82, − 0.27], \(P(E\mu <0)\) = 0.98), indicating a stronger negative effect of jerk difference for non-mental-, but not mental-state, animations, when those were created by the autistic-, relative to the non-autistic generator group (average marginal jerk difference trend for non-mental state, gen = autistic: \(E\mu\) = − 4.01, CrI = [− 8.34, 0.28], gen = non-autistic: \(E\mu\) = 3.75, CrI = [− 0.71, 8.00]; Fig. 2A).
Fig. 2
Effect of jerk difference by mental state and A generator group, UK data only (all participants viewing animations generated by non-autistic generators [left], autistic generators [right]), B observer culture (UK observers viewing animations generated by all participants [left], Japanese observers viewing animations generated by all participants [right])
In sum, within the British culture, non-autistic participants performed more poorly when interpreting animations generated by the autistic- relative to their own group, while autistic participants did not show such own-group advantage. Accuracy for other-group-generated animations was comparable across autistic and non-autistic adults. Finally, both autistic- and non-autistic observers showed an effect of movement similarity, but only for those animations generated by the autistic group.
Within-culture analyses: JapanJapanese non-autistic adults show comparable performance when interpreting animations generated by Japanese autistic and non-autistic adultsOur pre-registered hypothesis 1 predicted that the bi-directional mentalising difficulties in non-autistic adults observed in Edey et al. [26] would be culturally independent, and stated that Japanese non-autistic adults would perform worse when interpreting animations generated by Japanese autistic, relative to non-autistic participants. To test this hypothesis, we ran a Bayesian mixed-effects model equivalent to Model UK.1 on Japanese data only (Model JP.1), fitted to accuracy and the dummy-coded predictors observer group (autistic vs non-autistic; reference level = non-autistic) and generator group (autistic vs non-autistic; reference level = non-autistic), for mental state animations only. Among non-autistic observers, the model revealed no effect of generator group (\(_\) = 0.17, CrI = [− 8.61, 9.21]; Fig. 3A), suggesting that Japanese non-autistic adults performed equally well when interpreting animations generated by other Japanese autistic and non-autistic adults, and thus not supporting our hypothesis 1.
Fig. 3
Accuracy by observer and generator group, Japanese (JP) data only for A mental-state animations. Autistic and non-autistic observers viewing animations created by autistic generators (left); non-autistic generators (right). B Non-mental state animations. Autistic and non-autistic observers viewing animations created by autistic generators (left); non-autistic generators (right). Central marks of box plots correspond to the median; outer hinges correspond to the first and third quartiles (25th and 75th percentiles). Upper and lower whiskers extend to largest and lowest values at most 1.5 * IQR of the hinge
Exploratory post-hoc contrasts further showed that there was also no difference in performance among autistic observers between animations generated by the autistic or non-autistic group (\(_\) = − 3.15, CrI = [− 12.61, 6.50]). Finally, regarding animations generated by the other group, there were no differences between autistic and non-autistic observers in the Japanese sample (\(_\) = − 3.28, CrI = [− 9.89, 3.34], \(_\) = 38.40, CrI = [29.80, 47.30], \(_\) = 32.30, CrI = [23.40, 40.60], see Fig. 3A).
To test possible differences between mental and non-mental state animations, the dummy-coded variable mental state (mental vs non-mental; reference level = mental) was added to Model JP.1 (Model JP.2). There were no interactions between observer group or generator group and mental state in this model, indicating that the lack of group differences in mentalising performance in the Japanese sample did not depend on whether animations displayed mentalistic or purely action-based interactions (see Table S7, Fig. 3B).
Jerk difference does not predict mentalising accuracy within the Japanese sampleBased on prior literature suggesting culturally dependent display rules and a lower tendency to communicate internal states using body movements in collectivist cultures such as Japan [54], we expected that movement similarity will play a lesser role in mentalising within the Japanese sample. Our hypothesis 7 accordingly stated that the effect of jerk difference on mentalising accuracy will be less strong within Japanese, relative to UK participants. We first examined whether there was any effect of jerk difference present within the Japanese sample by fitting a Bayesian mixed-effects model with random intercepts for subject ID and animation ID and a random slope for all predictor terms varying by subject ID to accuracy and the covariate jerk difference, the dummy-coded factor mental state (mental vs non-mental; reference level = mental) as well as their two-way interaction (Model JP.3). This model revealed no effect of jerk difference for mental state animations (\(_\) = 0.11, CrI = [− 2.27, 2.57]), and no interaction between jerk difference and mental state (\(_\) = − 1.34, CrI = [− 6.07, 3.27]), suggesting that within Japanese participants, movement similarity between agent and observer did not facilitate accurate interpretations of the animations. Two further exploratory models, one with the predictor observer group, and another with generator group (both factors: autistic vs non-autistic; reference level = non-autistic) added (Model JP.4, JP.5) showed no interactions between jerk difference and either of the groups (see Tables S9, S10), indicating that the lack of effect for movement similarity was independent of autism diagnosis.
Overall, among Japanese participants there were no differences in mentalising accuracy between autistic and non-autistic adults, and Japanese adults did not show any effect of movement similarity.
Cross-culture analysesThere is a stronger negative trend for jerk difference among UK, compared to Japanese observersTo formally test our hypothesis 7 (see above), we fitted a new model (Model JPUK.1) to accuracy and the predictors jerk difference, mental state (mental vs non-mental; reference level = mental), and observer culture (JP vs UK; dummy-coded, reference level = UK), as well as all possible two- and three-way interactions, with random intercepts for subject ID and animation ID and a random slope for all predictor terms varying by subject ID. This model revealed a small negative trend for jerk difference for UK observers for both mental and non-mental state animations (mental state: \(E\mu\) = − 1.31, CrI = [− 2.83, 0.19]; \(P(E\mu <0)\) = 0.95; note there is increased uncertainty around this effect; non-mental vs mental state: \(E\mu\) = 1.52, CrI = [− 0.91, 4.02]), and a three-way interaction between jerk difference, observer culture, and mental state (\(_\) = − 4.02, CrI = [− 7.61, − 0.53]; \(P(E\mu <0)\) = 0.98). Post-hoc contrasts showed a more positive slope for jerk difference among Japanese observers for mental (\(_\) = − 1.94, CrI = [− 3.83, − 0.10], Fig. 2B) but not non-mental state (\(_\) = 2.09, CrI = [− 1.30, 5.59]) animations, suggesting a lower influence of movement similarity on mentalising performance within Japanese observers.
Japanese autistic adults show better mentalising performance than all UK participantsThe latter model further revealed a main effect of observer culture, indicating that Japanese adults showed better mentalising performance relative to UK adults across mental- and non-mental state animations (mental state: \(_\) = 8.49, CrI = [3.26, 13.71], \(P(E\mu <0)\) = 0.99; mental- vs non-mental state: \(_\) = 0.15, CrI = [− 5.53, 5.23]). To further test whether this difference in mentalising accuracy was driven by the lower mentalising accuracy observed in UK autistic observers, observer group (autistic vs non-autistic; reference level = non-autistic) was added to the previous model (JPUK.2). An interaction between observer culture and observer group (\(_\) = 9.65, CrI = [0.73, 18.51], \(P\left(E\mu >0\right)\) = 0.98) and post-hoc contrasts showed that indeed, across both mental and non-mental state animations, Japanese non-autistic participants showed better mentalising performance relative to UK autistic (mental state: \(E\mu\) = 9.35, CrI = [2.23, 16.53]), but not to UK non-autistic (mental state: \(E\mu\) = 3.84, CrI = [2.58, 10.34]) adults. Contrasts further showed that Japanese autistic individuals exhibited better mentalising accuracy than both UK autistic (mental state: \(E\mu\) = 13.57, CrI = [6.24, 20.56]) and non-autistic adults (mental state: \(E\mu\) = 8.11, CrI = [0.41, 15.04], see Fig. 4). Note that we had no specific hypotheses about any cross-cultural differences in mentalising performance, therefore the latter results should be considered exploratory.
Fig. 4
Accuracy by observer culture and observer group, for A mental-state animations. UK autistic and non-autistic observers viewing animations generated by all other participants (left); Japanese autistic and non-autistic observers viewing animations generated by all other participants (right). B Non-mental state animations. UK autistic and non-autistic observers viewing animations generated by all other participants (left); Japanese autistic and non-autistic observers viewing animations generated by all other participants (right). Central marks of box plots correspond to the median; outer hinges correspond to the first and third quartiles (25th and 75th percentiles). Upper and lower whiskers extend to largest and lowest values at most 1.5 * IQR of the hinge. UK = British culture, JP = Japanese culture
All autistic participants show higher accuracy for animations generated by Japanese autistic adultsOne critical tenet of mismatch theories such as the double empathy problem is that there should be higher degrees of mutual understanding between individuals of the same neurotype. While indeed, cultural differences (e.g., different display rules [54]) may lead to mentalising difficulties between individiuals of two different cultures comparable to those observed between different neurotypes [26, 88, 89], autistic individuals have also been found to show a lower degree of social conformity [68,69,70]. Hypothesis 3 thus stated that we expected there to be no difference in performance between the two autistic groups when rating animations generated by autistic people of their own, relative to the other culture. To test this, a Bayesian mixed-effects model (Model JPUK.3) was fit to accuracy within autistic groups only and the dummy-coded predictors mental state (mental vs non-mental; reference level = mental), observer culture (JP vs UK, reference level = UK) and generator culture (JP vs UK, reference level = UK), as well as all possible interactions between predictors. Random intercepts and slopes were fit for all predictor terms varying by subject ID and animation ID. Model contrasts revealed an effect of generator culture for UK observers (mental state: \(_\) = 8.30, CrI = [0.46, 16.09], \(P(E\mu >0)\) = 0.98; non-mental vs. mental state: \(_\) = − 3.12, CrI = [− 13.57, 7.20]), indicating that this autistic group performed better when animations were created by the other, relative to their own culture. There further was an interaction of observer and generator culture (mental state: \(_\) = 8.91, CrI = [2.72, 14.92], \((E\mu >0)\) = 0.99; non-mental vs. mental state: \(_\) = − 3.57, CrI = [− 11.70 4.67]), suggesting that Japanese autistic individuals interpreted animations of their own culture with higher accuracy than those generated by UK participants. A lack of interactions with mental state suggests that these results did not depend on whether animations displayed mentalistic or action-based interaction. In essence, both autistic groups performed better for animations that were created by Japanese autistic, relative to UK autistic generators, and thus do not lend support to hypothesis 3.
Autistic adults do not exhibit higher movement jerk than non-autistic adultsFinally, hypothesis 6 concerned differences in motor performance between autistic and non-autistic participants for both Japanese and British cultures. Given extensive literature suggesting that autistic individuals exhibit higher jerk across a range of movements (e.g., [26, 35, 36, 38]), we hypothesised that we would observe higher movement jerk in the autistic, relative to the non-autistic groups in our task, independent of culture. To test this, a Bayesian linear mixed-effects model was fit to mean jerk and the dummy-coded predictor variable group (autistic vs non-autistic, reference level = non-autistic), with random intercepts for subject ID and random slopes for the effect of group varying by subject ID (Model JPUK.4). This model showed no effect for group (\(_\) = 0.06, CrI = [− 0.22, 0.34]), indicating no difference in mean jerk between autistic and non-autistic adults. To test the possibility that potential differences between groups depended on the type of word that was animated, word (levels arguing, surprising, teasing, following, searching, dancing; coded as deviation contrast), as well as the two-way interaction of word and group, were added as predictors to the previous model (Model JPUK.5). Model JPUK.5 revealed an interaction between the contrasts for ‘arguing’ and group, suggesting lower jerk values among autistic, relative to non-autistic participants for this word (\(_\)= − 0.30, CrI = [− 0.61, − 0.00], \(P(E\mu <0)\) = 0.98). Post-hoc contrasts showed that there was a smaller difference in jerk between the words teasing and arguing, and searching and arguing, for autistic compared to non-autistic generators (\(_\) = − 0.47, CrI = [− 0.86, − 0.09], \(_\) = − 0.40, CrI = [− 0.80, − 0.02]; non-autistic: \(_=\)− 1.06, CrI = [− 1.33, − 0.80], \(_=\)− 1.35, CrI = [− 1.61, − 1.08]; autistic: \(_=\)− 0.59, CrI = [− 0.88, − 0.32], \(_=\)− 0.94, CrI = [− 1.25, − 0.65], Fig. 5). We further added the dummy-coded factor culture (JP vs UK, reference level = UK) to the latter model to confirm that, as hypothesised, there was no difference in jerk between the autistic groups of each culture (Model JPUK.6). In this new model, there was increased uncertainty around the original interaction of group and ‘arguing’ within the UK sample (\(_\)= − 0.34, CrI = [− 0.76, 0.10], \(P(E\mu <0)\) = 0.94), no main effect for culture (\(_\) = − 0.05, CrI = [− 0.29, 0.19]) or group (\(_\) = 0.20, CrI = [− 0.20, 0.61]), and no interaction between group and culture (\(_\) = 0.20, CrI = [− 0.19, 0.60]). Edey et al. [26] speculated that one possible reason for their observation of an own-group mentalising benefit in the non-autistic, but not the autistic group, may have been the higher levels of movement similarity they observed among their non-autistic participants. Given in the present study, we found the same lack of own-group benefit in the UK autistic group, we explored whether this group also exhibited higher movement variability. To this end, we first calculated a proxy for jerk variability as the coefficient of variation (CV) of jerk values within each culture and group for each of the words, resulting in 6 jerk variability values per culture and group. A mixed-effects model (JPUK.7) was fit to jerk variability, predicted by the two dummy-coded factors group (autistic vs non-autistic, reference level = non-autistic), culture (JP vs UK, reference level = UK), and their two-way interaction, with a random intercept for word. For UK generators, this model revealed a strong effect of group (\(_\) = 0.43, CrI = [0.21, 0.65], \(P(E\mu <0)\) = 0.99), while there was no main effect of culture (\(_\) = 0.03, CrI = [− 0.20, 0.25]) and an interaction between group and culture (\(_\) = − 0.36, CrI = [− 0.67, − 0.04], \(P(E\mu <0)\) = 0.99), suggesting higher jerk variability among autistic generators in the UK, but not the Japanese sample (contrast for jerk variability within the Japanese sample: \(_\) = 0.07, CrI = [− 0.15, 0.30]; Fig. 6).
Fig. 5
Average jerk across word types, by generator group, for A the whole sample, B the Japanese sub-sample and C the UK sub-sample. Central marks of box plots correspond to the median; outer hinges correspond to the first and third quartiles (25th and 75th percentiles). Upper and lower whiskers extend to largest and lowest values at most 1.5 * IQR of the hinge. Aut = Autistic, non-aut = non-autistic
Fig. 6
Coefficient of variability (CV) of jerk by generator group and word, for A UK and B Japanese participants
Comparing British and Japanese cultures, our results show that, while there was no difference in mentalising performance between non-autistic adults, Japanese autistic participants interpreted animations with higher accuracy than both British groups. While British participants utilised their own movements to interpret the movements generated by others, Japanese participants did not show evidence for such mechanism. Furthermore, amongst autistic participants, animations generated by Japanese autistic adults were interpreted with higher accuracy than those made by UK participants. Finally, there was no difference in average movement jerk between autistic and non-autistic participants, however UK autistic participants showed higher movement variability relative to British non-autistic adults.
Comments (0)