Study design and participants
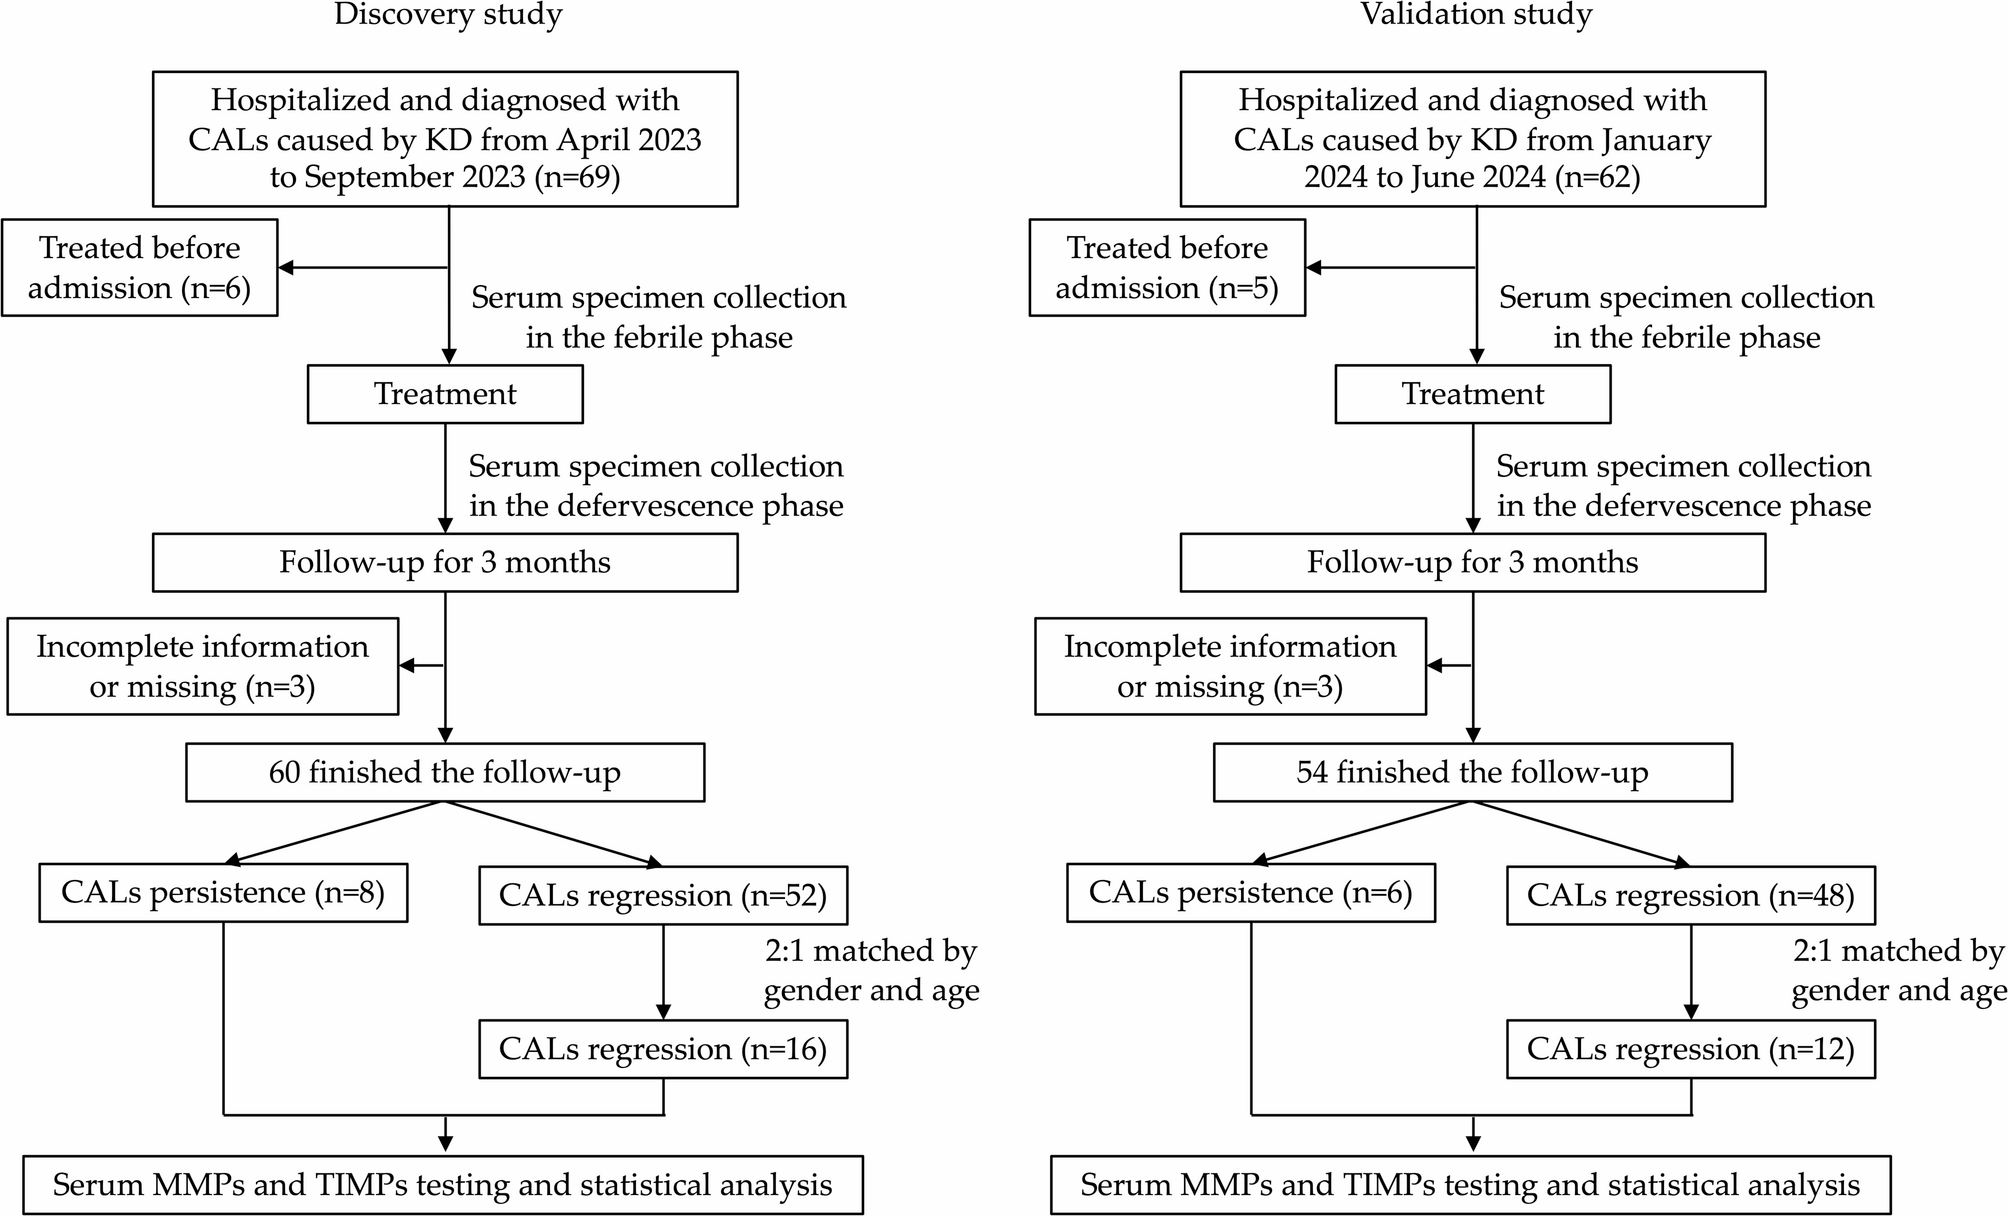
Children who were initially diagnosed with CALs caused by KD in the Department of Cardiology, Children’s Hospital affiliated to Capital Institute of Pediatrics from April 2023 to June 2024 were recruited in the nested case-control study.
The inclusion criteria were as follows: (1) age less than 18 years; (2) first-time hospitalized KD patients (KD was confirmed according to the criteria by the American Heart Association [2]); (3) patients with CALs (defined as Z-value ≥ 2.0 [2]) in the febrile phase. The study was conducted prior to the publication of the American Heart Association Update (December 2024) regarding Kawasaki Disease. Therefore, we referred to the 2017 edition of Diagnosis, Treatment, and Long-Term Management of Kawasaki Disease: A Scientific Statement for Health Professionals From AHA; (4) one parent or guardian of children signed informed consent.
The exclusion criteria were as follows: (1) patients were treated before admitted to our hospital; (2) incomplete clinical data; (3) unwilling to cooperate with the treatment and follow-up.
After admission, patients were treated promptly with IVIG (2 g/kg over 8–12 h intravenous injection) and oral aspirin (30–50 mg/kg/day, three times a day). For IVIG-resistant patients (defined as persistent or recrudescent fever at least 36 h and < 7 days after completion of first IVIG infusion [2]), second IVIG infusion and methylprednisolone were given. For KD shock syndrome (KDSS, based on the American Heart Association Guidelines [2]), vasoactive drugs and methylprednisolone were used in the acute stage. And after acute stage, low-dose aspirin (3–5 mg/kg/day, once a day) was administered for 12 weeks for all patients. For IVIG-resistant and KDSS patients, they would take oral prednisone in addition and gradually reduce the dosage and stop it for 2 to 4 weeks.
Follow-up was conducted through outpatient. Children with CALs persisted after 3 months were enrolled as CALs persistence group. CALs persistence was defined as any coronary artery Z-value remaining ≥ 2.0 after 3 months. The CALs regression group consisted of children with CALs regressed who were matched with the CALs persistence group by gender and age at a ratio of 2:1.
Clinical data collection and coronary artery assessment
All demographic characteristics included gender, age (years), initial IVIG treatment days (days), total fever days (days), the IVIG-resistant cases, and the rate of KDSS were collected. Transthoracic echocardiography was performed in the febrile phase (before treatment) and during follow-up week 2, month 1, month 2, and month 3. The internal lumen diameter of the proximal right coronary artery (RCA), left main coronary artery (LMCA), proximal left anterior descending artery (LAD), and left circumflex coronary artery (LCX) was measured at each time-point. CALs were defined as Z-score ≥ 2.0 according to the criteria of Kobayashi Z-score adjusted for body surface area [15]. CAL numbers were compared between groups. For patients with multiple coronary artery lesions, the main CAL refers to the coronary artery with the maximum Z-value and we compared the maximum Z-value between groups.
Serum specimen collection
Fasting venous blood of the participants were collected in the febrile phase (before IVIG infusion) and the defervescence phase (afebrile 48–72 h after initial treatment). The blood was kept at room temperature for 2 h and centrifuged at 3,000r/min for 10 min. Subsequently, the supernatant was acquired and immediately frozen at -80℃ until further detection.
MMP antibody array
Serum levels of MMP-1, -2, -3, -8, -9, -10 and -13 and TIMP -1, -2 and -4 in the discovery study were measured simultaneously using the Quantibody® Human MMP Array 1 from Raybiotech (Raybiotech, Norcross, GA, USA). An 80ul detection antibody cocktail was added to each well. The antibody-targeted selected MMPs and TIMPs were fixed at a specific position on the surface of the array glass. The MMPs and TIMPs in the serum was recognized by the corresponding antibody, and combined with the Cy3 equivalent dye conjugated streptavidin to detect the binding cytokines. The signal was visualized using a fluorescent dye using an InnoScan 300 microarray scanner (Innopsys, Carbonne, France) and detected using a Cy3 (532 nm) wavelength (green channel).
Enzyme-linked immunosorbent assay (ELISA)
To verify the results obtained from the discovery set, ELISA kits (Catalog No: ml058676V, ml058617V, ml568710V; Elabscience, China), were used to detect the levels of MMP-8, MMP-9 and TIMP-1 in the validation subjects, according to the manufacturer’s instructions. The resultant color was measured at 450 nm in a microtiter plate spectrophotometer. The concentrations of MMP-8, MMP-9 and TIMP-1 were determined by interpolation from a standard curve.
Statistical analysis
R language (version 4.1.2) was used to screen differentially expressed proteins acquired from MMP antibody arrays. The analysis method was moderated t-statistics, and the data packet was limma from R/Bioconductor. Fold change (FC) > 1.2 or < 0.83 [absolute logFC (expression difference multiple in 2 was the bottom) > 0.263] and adjust P value (Adj. P. Val) < 0.05 after BH method correction were used to select differential proteins. Scatter plot and principal component analysis (PCA) were used to describe the samples. The drawing function of scatter plot was ggplot2, and the data packet was ggfortify. PCA adopted the prcomp function, the drawing function was autoplot, and the data packet was ggfortify. The volcano plots visualized the differential proteins. The drawing function was ggplot2, and the data package was ggfortify.
SPSS 26.0 statistical software was used for clinical data and data acquired by ELISA kits. Categorical variables were compared with the χ2 test between groups. Measurement variables with a normal distribution were expressed as mean ± standard deviation (SD), and independent Student’s t-test was used for comparison between groups. Otherwise, the data were displayed with median (P25, P75) and the Mann-Whitney U test was adopted. Grade data were expressed as n (%) and compared with Mann-Whitney U test. The MMPs and TIMPs levels in the febrile phase and defervescence phase were compared by paired Wilcoxon matched-pairs test. P < 0.05 was considered statistically significant.


Comments (0)