
Remember me


Among our 230 patients (118 from MENA and 112 from Non-MENA) who underwent EL procedure and matched our inclusion criteria, 156 were male, accounting for 67.8% of the study population, with a male-to-female ratio of ≃2:1. We correlated study variables based on patient gender, we found that female had higher BMI (P = 0.001), female patients (62.16%) were more in MENA countries, more female had functional dependence before surgery (P = 001), more female had hypertension (P = 0.004), diabetes mellitus (P = 0.22), and more female present with tachycardia to emergency (P = 0.019). conversely, male patients (53.8%) were more prevalent in non-MENA population and had higher serum ALP up on admission than female gender (P = 0.008). rest of correlation between male and female gender are insignificant.
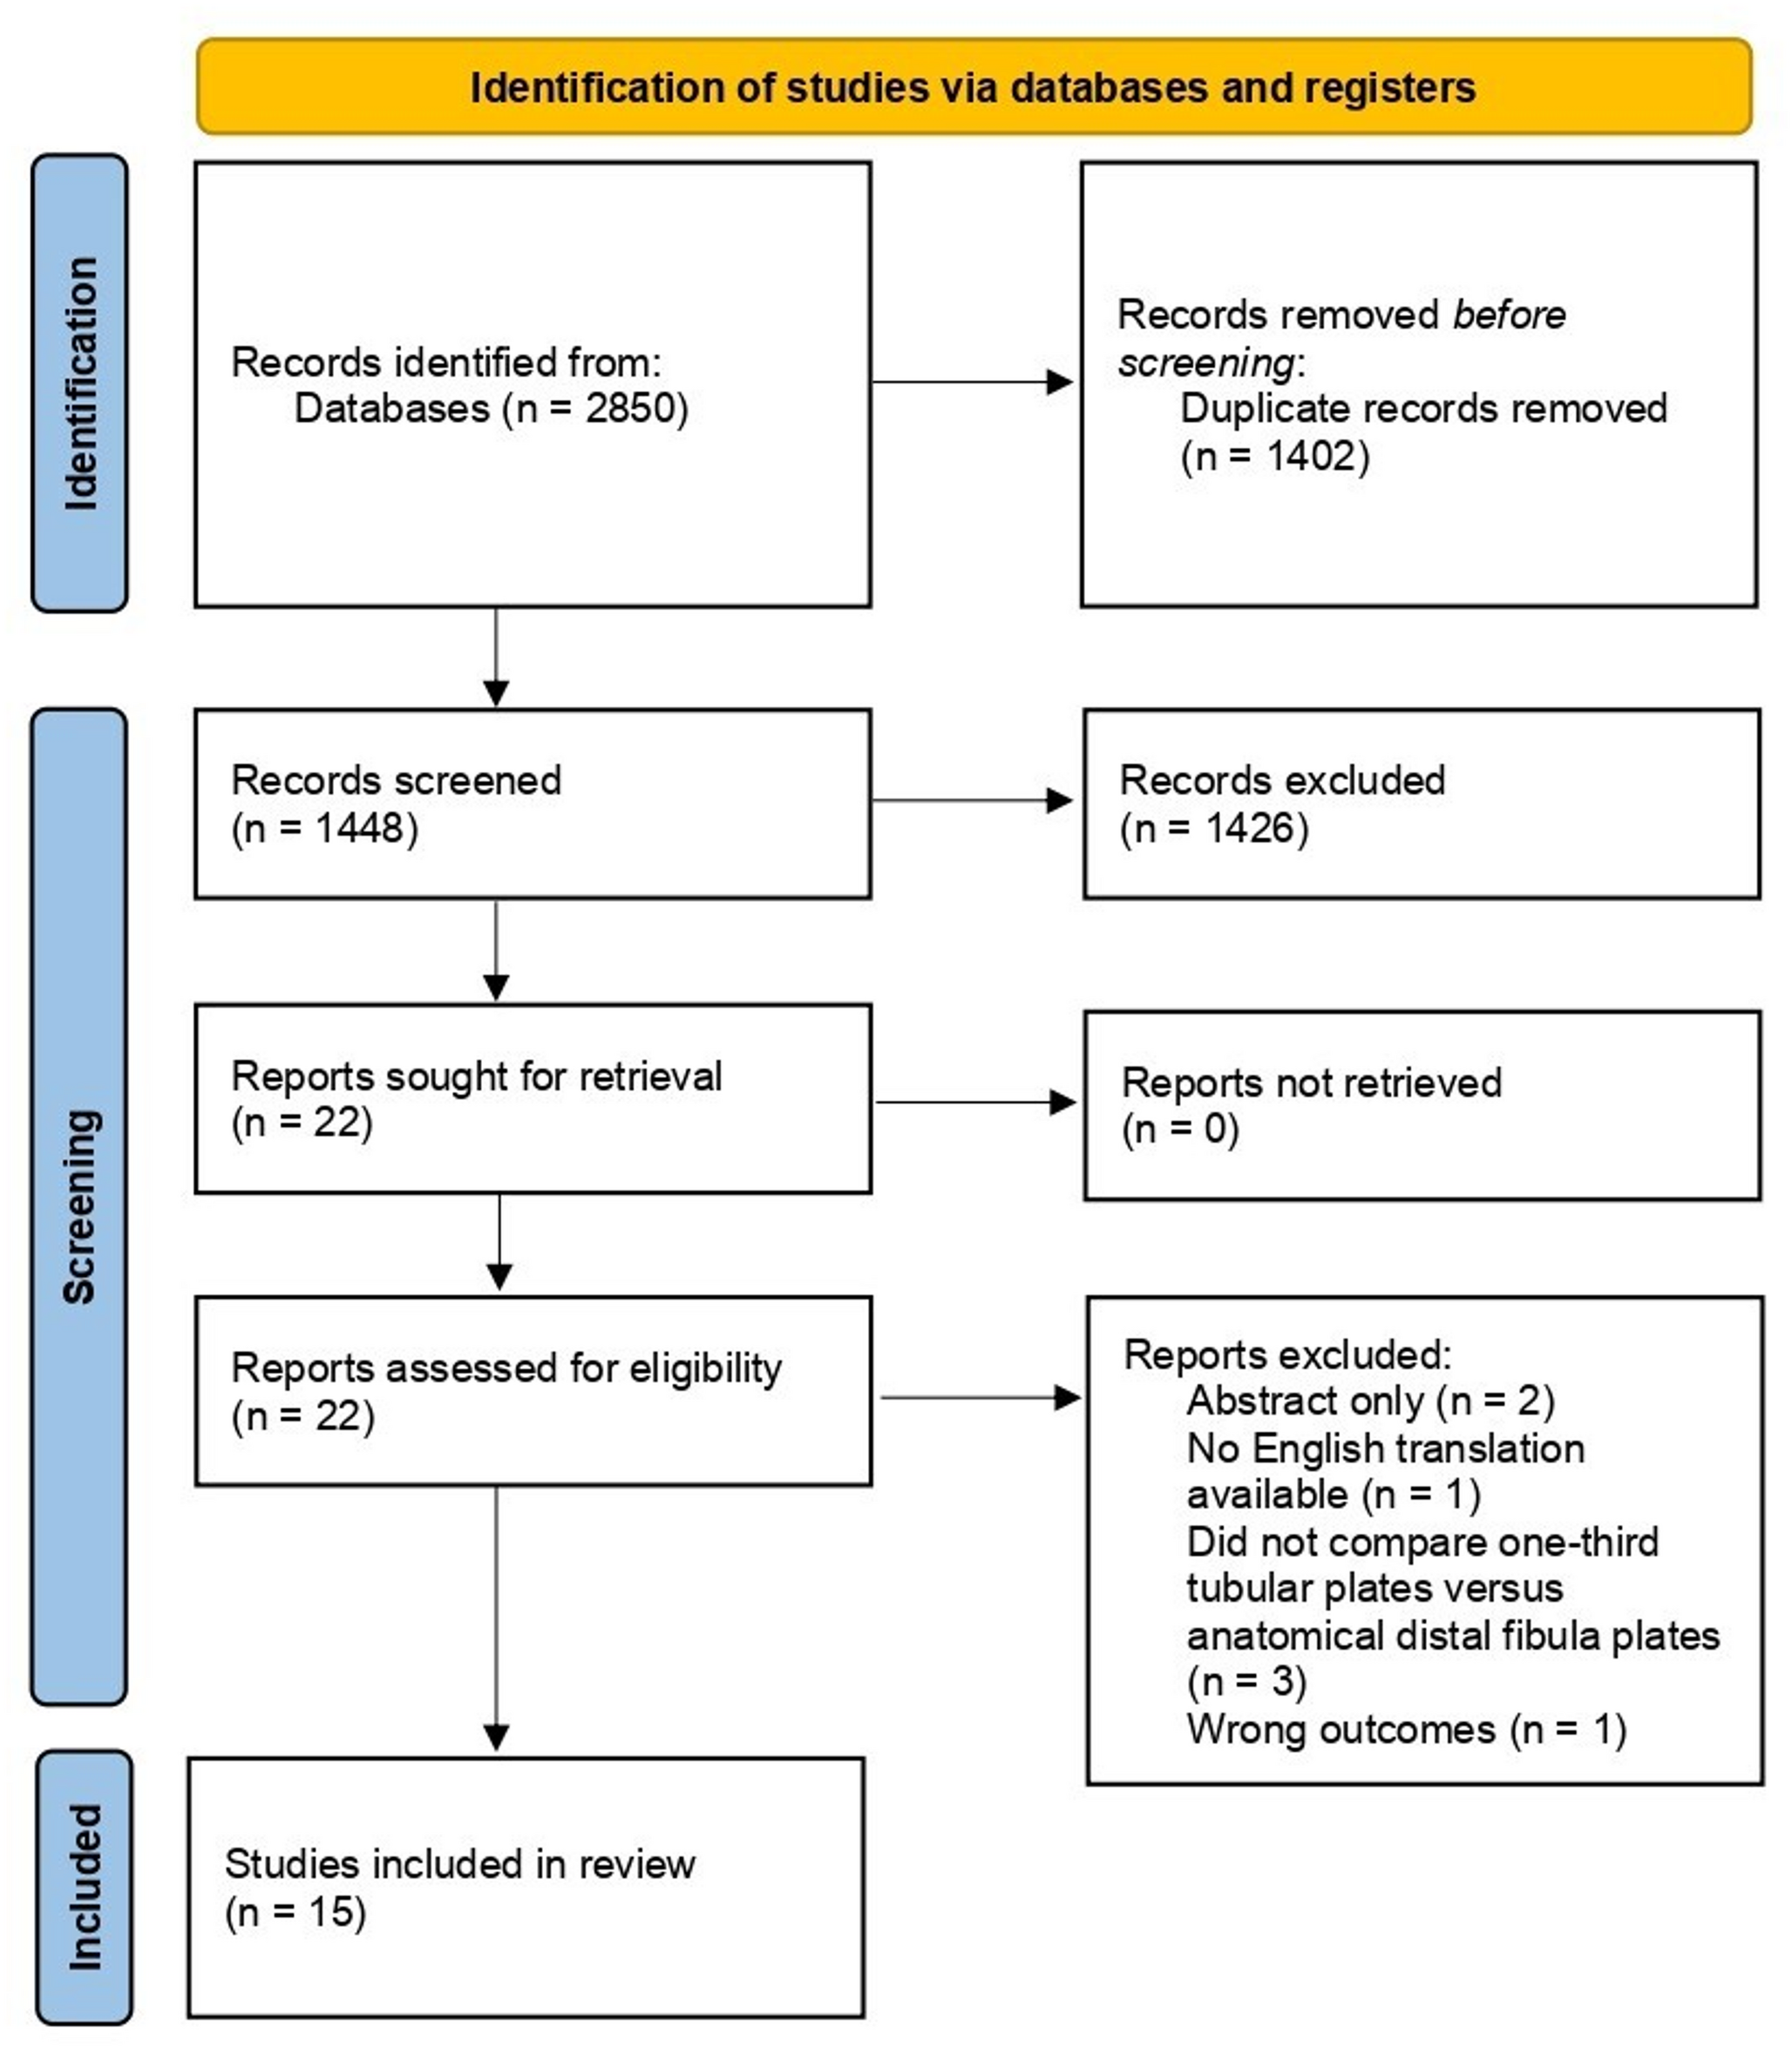
MENA vs non-MENAThe study compared the ESS and other variables between MENA and non-MENA patients was displayed in Fig. 1. The mean age of the MENA group was significantly higher (57.94 ± 18.33) than the non-MENA group (46.55 ± 12.20), with a P-value of < 0.001. Similarly, the MENA group exhibited a higher mean BMI (28.9 ± 6.1) compared to the non-MENA group (24.6 ± 4.7), also statistically significant (P < 0.001). Gender distribution showed notable differences, with the non-MENA population having a higher proportion of males (75% vs. 61% in MENA), reaching significance (P = 0.023). Vital signs such as systolic blood pressure, temperature, respiratory rate, and heart rate were comparable between the two groups, showing no statistically significant differences. In terms of comorbidities, statistically significant differences were observed in categories such as BMI < 20 kg/m2 (P = 0.046), disseminated cancer (P = 0.043), functional dependency (P < 0.001), history of COPD (P = 0.049), and hypertension (P < 0.001), with higher rates in the MENA group. The remaining comorbidity factors, including ventilator requirement and weight loss, did not show significant differences. Laboratory values, such as albumin, BUN, creatinine, and INR, were not significantly different between the two groups. However, the ASA score was higher in the MENA group (3.08 ± 0.95 vs. 2.79 ± 0.93, P = 0.024), indicating a slightly greater preoperative risk. The ESS score, however, did not differ significantly between the populations (median [IQR] 7.5 [5,12] for MENA vs. 7 [5, 10] for Non-MENA, P = 0.45) (Table 2).
Fig. 1
Bar graph showing the percentage distribution of ESS values between patients from MENA (gray bars) and non-MENA (blue bars) populations
Table 2 Comparison of demographics, comorbidities, laboratory findings, and clinical characteristics between MENA and Non-MENA patients undergoing ESSOur cohort of 230 patients (118 from MENA and 112 from non-MENA regions) presented with diverse etiologies necessitating emergency laparotomy. Hollow viscus perforation was the most prevalent indication (n = 83, 36.1%), followed by intestinal obstruction (n = 72, 31.3%). Other significant etiologies included mesenteric ischemia (n = 28, 12.2%), anastomotic leaks/collections (n = 20, 8.7%), and gastrointestinal bleeding (n = 16, 7.0%). Complicated acute appendicitis represented the least common indication (n = 11, 4.8%). This distribution demonstrates that hollow viscus perforation and intestinal obstruction collectively accounted for two-thirds of cases, reflecting the predominant surgical emergency patterns in our study population.
Table 3 summarizes the incidence of postoperative complications following emergency surgery. Sepsis emerged as the most frequent complication, occurring in 69.6% of cases. In contrast, graft/prosthesis/flap failure represented the rarest complication, observed in only one patient (0.4% of patients).
Table 3 Incidence of postoperative complications following ESSThe median duration of hospital stay was 14 days (interquartile range: 8–33 days). A total of 63.4% of patients required ICU admission, and the 30-day mortality rate was 13.91% (32 patients) (Table 4).
Table 4 ICU admission, 30-day mortality, and hospital length of stayValidation of ESS as an outcome predictorESS & post-operative complication’s rateFigure 1-A illustrates the distribution of preoperative complications across ESS scores. Complications were predominantly observed in patients with ESS scores ranging from 4 to 11, with peak incidence occurring at score 10. This bimodal distribution suggests that patients with moderate ESS scores have the highest risk of developing complications, while those at both extremes of the scoring spectrum (very low or very high scores) demonstrated lower complication rates.
ROC curve indicates that higher ESS scores are strongly associated with increased complications rates, with a critical threshold at scores of 10 and above, where the risk of complications significantly rises. ESS and ASA were significant predictors of post operative complications with more association toward ESS score, with a c-statistic of 0.79 (95% CI = 0.72–0.84), and a c-statistic of 0.7331(95% CI: 0.66–0.79) respectively (Fig. 2B).
Fig. 2
Receiver operating characteristics (ROC) curve analysis. (A) Distribution of Complications per ESS score. (B) Comparison of ROC curves using ESS score and ASA score to complications in predicting complications, with reference line. (C) ROC curve comparison for ESS score between MENA vs non-MENA
The ROC curve compares the predictive performance of the ESS score in identifying major complications for MENA and non-MENA populations. The ROC area for MENA (AUC = 0.8017) suggests good discriminative ability, slightly outperforming the non-MENA group (AUC = 0.7809). Both curves demonstrate that the ESS score is a reasonably effective tool for predicting complications, as indicated by the upward trend and areas under the curve being above 0.75 for both groups. The optimal cutoff score for predicting complications was determined to be 6 (Fig. 2C).
We performed a subset analysis to evaluate the predictive capacity of ESS in anticipating specific complications. Table 4 outlines the effectiveness of ESS in predicting some prevalent complications, as indicated by the c-statistic. Specifically, ESS demonstrated robust predictive capabilities for myocardial infarction, with a c-statistic of 0.92 (95% CI: 0.85–0.99), acute kidney injury necessitating dialysis, with a c-statistic of 0.88 (95% CI: 0.83–0.94), and cardiac arrest requiring cardiopulmonary resuscitation, with a c-statistic of 0.88 (95% CI: 0.83–0.93) (Table 5).
Table 5 ESS a predictor of other complicationsESS as an ICU admission’s predictorThe distribution of ICU admission as per ESS, highest ICU admissions are observed around ESS 4 and 10, indicating that patients within these score ranges are more likely to be admitted to the ICU. The distribution of ICU admissions is relatively consistent across mid-range ESS scores, with fewer admissions seen at the extremes (ESS scores 1, 2, and 21) (Fig. 3A).
Fig. 3
A Distribution of ICU admission to ESS score. (B) ROC curves for ESS and ASA score for ICU admission. (C) ROC curve comparison of ESS score for predicting ICU admission between MENA and Non-MENA populations
The ROC curve (Fig. 3B) indicates that higher ESS scores are strongly associated with increased ICU admission rates, with a critical threshold at scores of 10 and above, where the risk of ICU admissions significantly rises. ESS and ASA were significant predictors of ICU admission with higher prediction toward ESS, with a c-statistic of 0.81 (95% CI: 0.76–0.87), and c-statistic of 0.76(95% CI: 0.70–0.82).
In the ROC curve, the area under the curve (AUC) for both groups indicates good predictive power, with MENA having an AUC of 0.8195 and non-MENA slightly higher at 0.8281. This suggests that the ESS score is similarly effective in predicting ICU admissions for both MENA and non-MENA populations, The optimal cutoff score for predicting complications was determined to be 8 (Fig. 3C). Finally, the non-MENA population shows a marginally better discriminative ability in identifying patients at risk of ICU admission.
ESS as a 30-day mortality predictorFigure 4A shows the frequency of the 30 day of mortality per ESS, highest mortality counts are seen at ESS 4 and 10, with consistent mortality occurring across a broad range of mid-level ESS scores. This suggests that patients with moderate ESS scores, particularly around 4 and 10, are more likely to experience 30-day mortality, while those at the extremes of the ESS scale tend to have lower mortality rates.
Fig. 4
A Distribution of 30-day mortality to ESS score. (B) ROC curves comparing ESS and ASA score for 30-day mortality prediction. (C) ROC curve comparison of ESS score for predicting 30-day mortality between MENA and Non-MENA populations
This trend indicates that higher ESS scores are strongly associated with increased 30-day mortality rates, with a critical threshold at scores of 10 and above, where the risk of mortality significantly rises. ESS and ASA were significant predictors of 30-day mortality but also ESS was more significant with a c-statistic of 0.86 (95% CI: 0.80–0.91), and a c-statistic of 0.78 (0.71–0.85) (Fig. 4B).
AUC for MENA is 0.8695, indicating strong discriminative ability, while non-MENA has a slightly lower AUC of 0.8488. Both populations exhibit good predictive performance, with the ESS score proving to be a reliable predictor of 30-day mortality in both groups. The optimal cutoff score for predicting complications was determined to be 10. The curves indicate that ESS is a useful tool for mortality prediction, particularly in the MENA population (Fig. 4C).
Comments (0)