
Remember me

A disc-shaped sample with a thickness of 1.2 mm and a diameter of 12 mm and a square-shaped (10 × 10 × 2 mm) sample were designed in a three-dimensional design program (SolidWorks Student Edition 2018, France) and stored in the standard tessellation language (STL) file type. Using STL files and a presinterized 3Y-TZP zirconia block (Table 1), 20 disc-shaped and 4 square-shaped samples were machined in a CAM device (Yenadent D40; Yenadent, ZenoTec, Istanbul, Turkey). The calibration of the CAM device was completed before the machining process. Additionally, new milling burs were placed in the CAM device before machining the samples. Disc-shaped and square-shaped samples were randomly (www.random.org) divided into groups, and groups were created by the sintering method according to the manufacturer's recommendation as standard (Grup S; disc-shaped n = 10 square-shaped n = 2) and fast (Grup F; disc-shaped n = 10 square-shaped n = 2) procedures (Tables 2, 3). After the sintering process (Programat S1 1600, Ivoclar Vivadent), the last measurements of the samples were verified with a digital caliper (293-821-30, Mitutoyo Corporation, Japan) (± 0.05 mm). The present study excluded any discs with inappropriate dimensions, and new discs were subsequently manufactured.
Table 1 Information about the used zirconiaTable 2 Manufacturer's recommended standard sintering procedureTable 3 Manufacturer's recommended fast sintering procedureFollowing the sintering process, all samples were put in a sterilization bundle tagged with the sintering process and sample number. Total samples underwent hydrothermal aging in an autoclave [26] (Lina, W&H Sterilization, Italy) at 0.2 MPa pressure, 134 °C, for 5 h [27]. Subsequently, they were depurated ultrasonically in 99.8% isopropyl alcohol at 40 °C for 15 min using an ultrasonic cleaner (Sonorex Super, Bandelin Electronic, Berlin, Germany). All samples were dried using pressed air.
For the calculation of TP and OP values, the Commission Internationale de l’Eclairage (CIE) color data (LabCh) of disc-shaped samples (n = 10) were defined using a spectrophotometer (Lovibond Tintometer Model: RT-400) on white (L = 0.23, a = 0.03, and b = − 0.25) and black backgrounds (L = 93.85, a = − 0.64, and b = 2.24). The specular component excluded (SCE) was selected. Data were saved in the spectral range of 400–700 nm at 10-nm intervals.
For the calculation of FL values, the CIE color data (LabCh) of the disc-shaped samples (n = 10) were defined using a Minolta CM-3600D spectrophotometer (Konica Minolta Sensing, Inc., Japan) inclusive (UV 100%) and exclusive (UV 0%) the UV ingredient on white (L = 0.23, a = 0.03, and b = − 0.25) background. The SCE was selected. Data were saved in the measurement interval from 360 to 740 nm at a 10-nm pitch.
All measurements were made by the same operator with D65 standard illumination, an observer angle of 10°, and a d/8° measurement geometry [18]. The average values were calculated and recorded. The spectrophotometers were calibrated before each measurement for every sample.
TP, the color difference between readings against a black (Lb, Cb, Hb) and white (Lw, Cw, Hw) background for the same samples was calculated with the CIE2000 formula [28]
$$}_ = \sqrt }}}}}} S_}} }}} \right)^ + \left( }}}}}} S_}} }}} \right)^ + \left( }}}}}} S_}} }}} \right)^ + R_}} \left( }}}}}} S_}} }}} \right)\left( }}}}}} S_}} }}} \right).}$$
For the OP, the values of the CIE coordinates evaluated on black (ab, bb) and white (aw, bw) backgrounds of the samples were computed using the behind formula [16, 29]
$$} = \sqrt }} - a_}} } \right)^ + \left( }} - b_}} } \right)^ .}$$
For the FL, the color difference between readings against the UV inclusive (L100, C100, H100) and exclusive (L0, C0, H0) for the same samples was calculated with the CIE2000 formula [28]
$$}_ = \sqrt L_ }}}} S_}} }}} \right)^ + \left( C_ }}}} S_}} }}} \right)^ + \left( H_ }}}} S_}} }}} \right)^ + R_}} \left( C_ }}}} S_}} }}} \right)\left( H_ }}}} S_}} }}} \right).}$$
L, C, and H show the distinctions in lightness, chroma, and hue in CIEDE2000; RT is the statement for the interplay among chroma and hue distinctions in the blue zone. SL, SC, and SH are weighting tasks that set the all-color distinction for variety in place of the color distinction in L, a, and b coordinates. The parameterized determinants KL, KC, and KH are correcting expressions for variation in experimental situations. In this study, the parameterized determinants of the CIEDE2000 color distinction formula were adjusted to 1 [28].
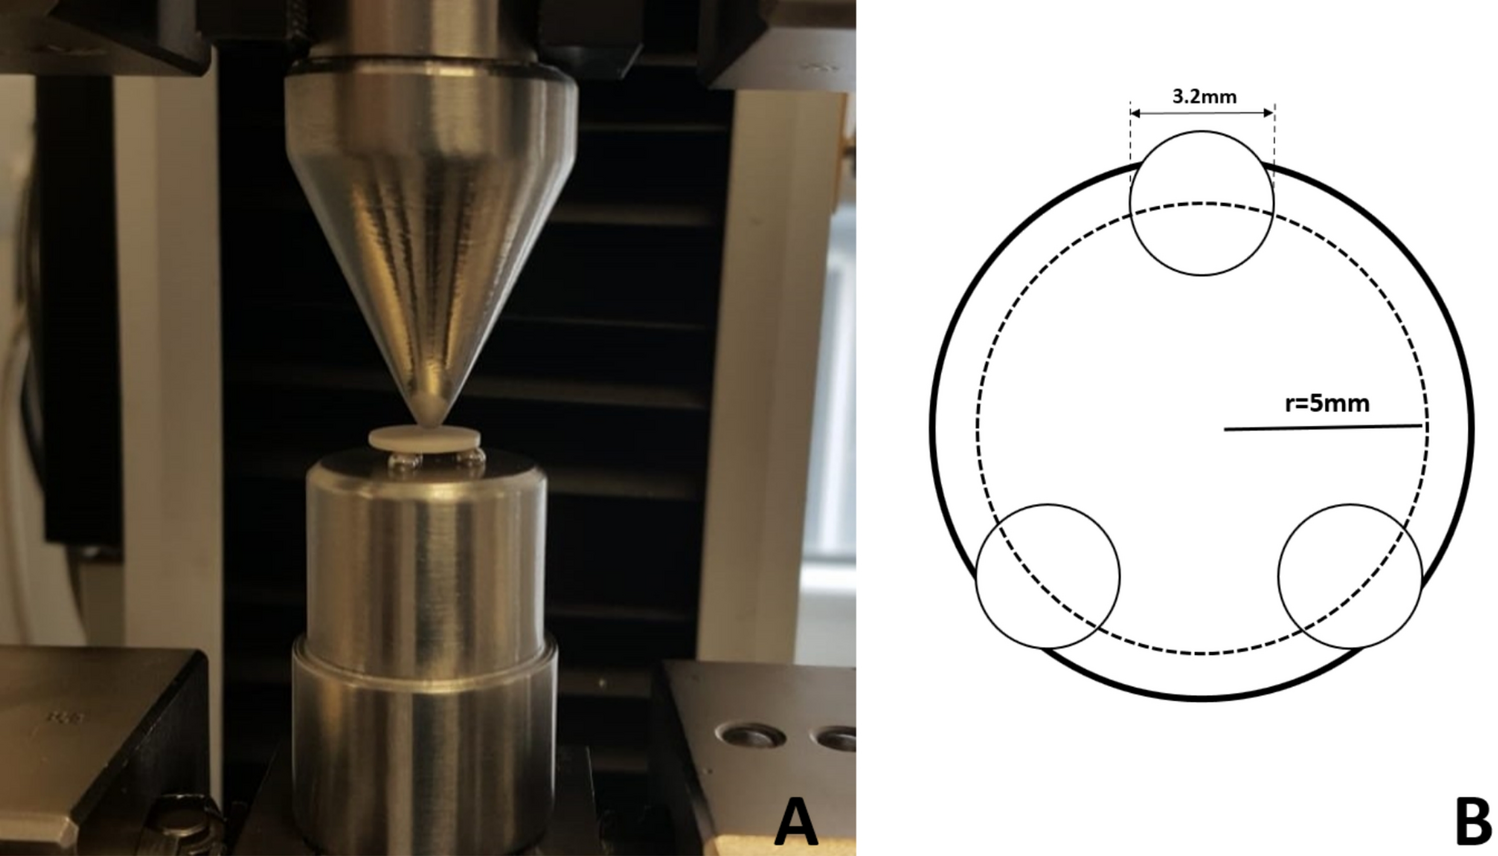
Color measurements completed disc-shaped samples (n = 10) were tested to BFS testing in an Instron universal testing machine model 3345 (MA, USA) (Fig. 1). For the fracture test, three steel balls, 3.2 mm in diameter were emplaced at equal distances on a 10 mm diameter (r1) circle on a metal platform (Fig. 1). Each sample was positioned to align with the steel balls, and a 1.4-mm-diameter (r2) steel piston applied force at a speed of 0.5 mm/min. The force at which the sample broke (P) was saved in Newtons (N). The BFS of each sample was computed using the following formula [3, 8]:
$$} = \left[ \right)} \right]/d2;$$
Fig. 1
Biaxial breaking strength test. A Crushing mechanism. B Schematic representation
BFS, biaxial flexural strength (MPa); P, fracture force (N); d, sample thickness (mm). Additionally, X and Y were calculated using the following formulas:
$$X = \left( \right) \, \ln \left( \right)2 \, + \, \left[ \right) \, /\left( \right)2} \right]$$
$$Y = \left( \right) \, \left[ \right)2} \right] + \, \left( \right) \, \left( \right)2.$$
υ, Poisson ratio of Zirconia (0.25) [30]; r1, radius of the support circle (mm); r2, radius of the piston (mm); r3, radius of the sample (mm)2.
MZ square-shaped samples from each group were polished using 400, 600, 800, 1200, 1600, and 2000‑grit papers (Struers, OH, USA), respectively. The chemical content (wt%) of the sample from each sintering group was determined by WD-XRF, using a PANalytical model AXIOS XRF wavelength-dispersive spectrometer, operating at 60 kV and 50 mA.
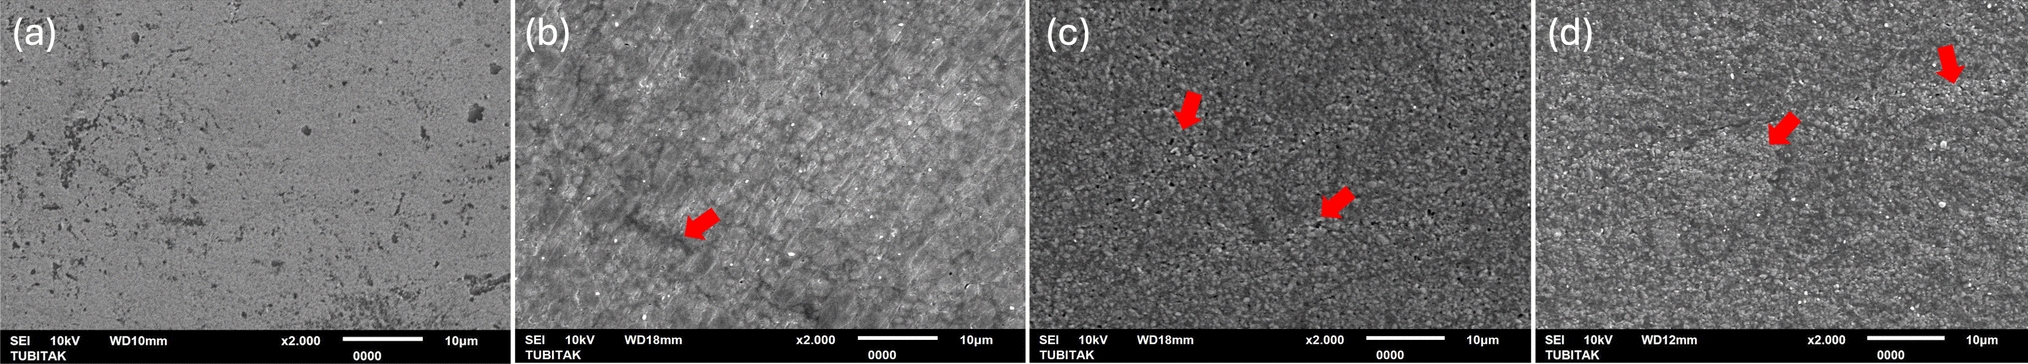
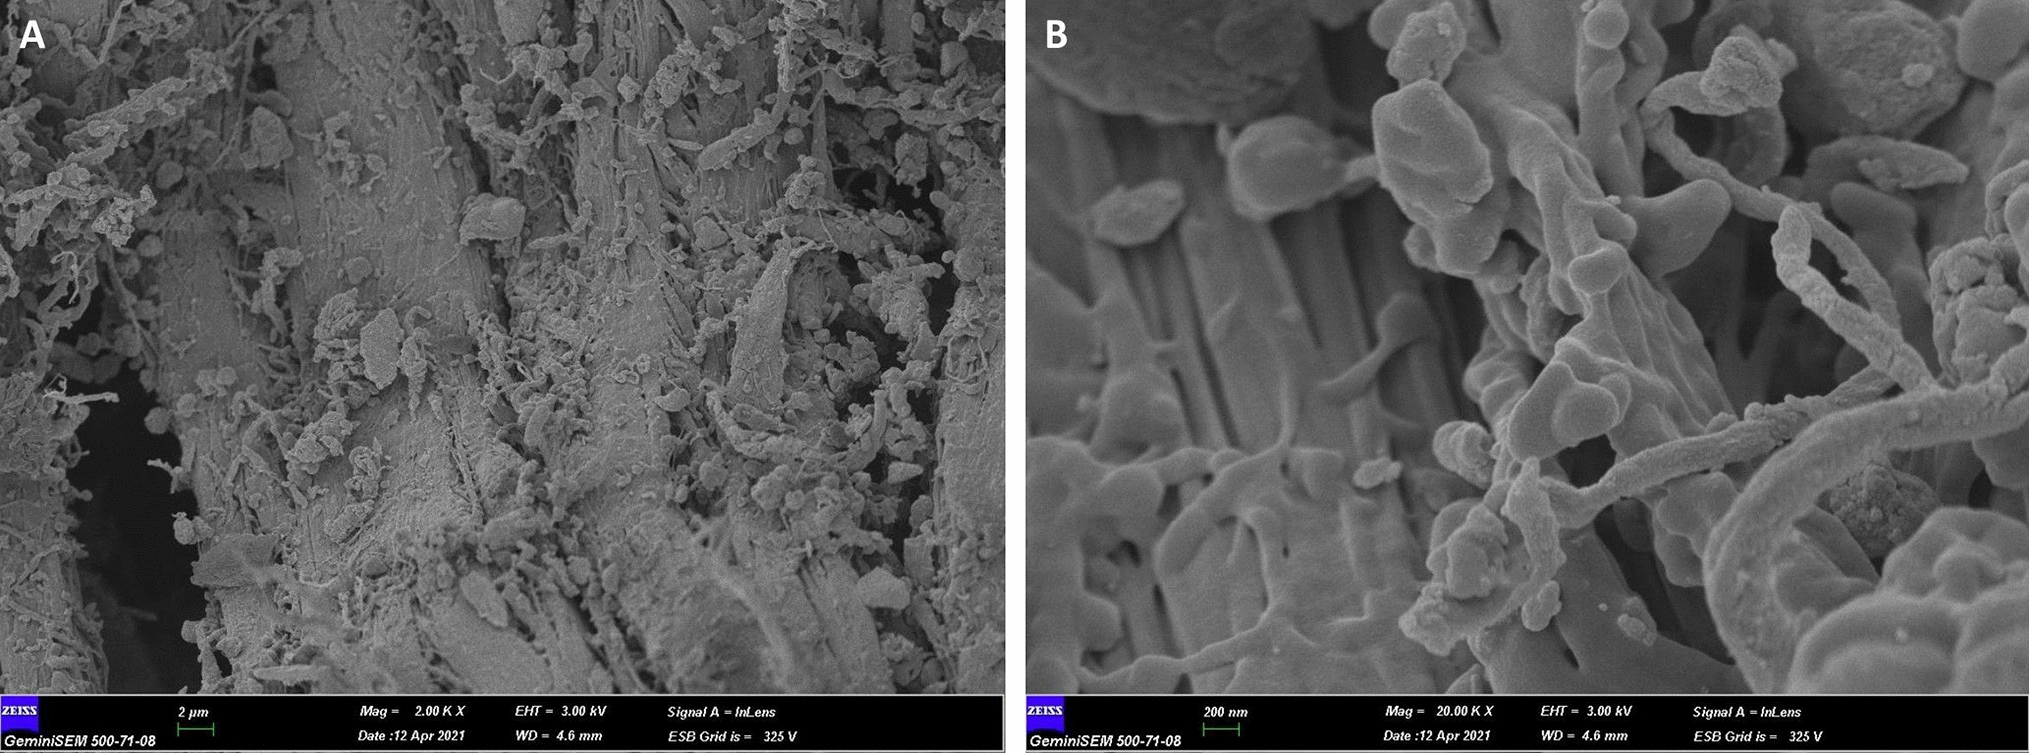
After WD‑XRF analysis, the same MZ square-shaped samples were thermally etched for 20 min at 1250 °C to identify grain boundaries. To prevent considerable changes in GS, a rapid heating rate (40 °C/min) and a low heat temperature were performed. After each MZ square-shaped sample was coated with gold/palladium, scanning electron microscope (FE-SEM; Gemini 500, Carl Zeiss AG, Germany) images were taken at 20,000 × magnification for GS. The average GS for each sample was calculated by measuring at least 200 grains across ten varied spots on FE-SEM micrographs, using software (Image J, NIH) based on the linear intercept method [31].
One MZ square-shaped sample remaining from each group was embedded in resin (ProbleMet Powder; Buehler Co.) and polished to using 240–2500 g of waterproof abrasive and 0.02-µm colloidal silica suspension. It was then ultrasonically depurated using deionized water and ethanol. Subsequently, X-ray diffraction (XRD) patterns of square-shaped samples were recorded (Empyrean; Malvern Panalytical Ltd.) using Cu-Kα radiation (λ = 1.54 Å) in the 2θ angle scanning interval of 20°–90° (40 mA, 45 kV generator adjustments, 0.026 step size). Mineral content and crystal structures of square samples were obtained and characterized according to the International Center for Diffraction Data (ICDD) using XRD patterns in a computer program (HighScore; Malvern Panalytical Ltd.).
All data were analyzed by a statistical analysis program (SPSS 22.0, USA), with a significance grade set at α = 0.05. The conformity of the data with the normal distribution was assessed with the Shapiro–Wilk. Among the dependent variables, only grain size was analyzed with the Mann–Whitney U test, because it did not comply with the normal distribution. Since all other dependent variables exhibited a normal distribution, they were analyzed by an independent sample t test.
Comments (0)