Trial design and ethical approval
This single-centered, cross-sectional analytical study was conducted at the Endodontics Department of Istanbul Medipol University and included assessments of patients with AP conducted between August 2023 and January 2024. Ethical approval was obtained from the Institutional Ethical Committee (Istanbul Medipol University, Clinical Research Ethics Committee, Decision Number: E-10840098-202.3.02-118/623, 27/07/2023), and written consent was obtained from all participants. All procedures complied with the 1964 Helsinki declaration.
Inclusion and exclusion criteria
A total of 90 patients diagnosed with chronic AP [(Group 2 (PAI 3–4, n:35) and Group 3 (PAI 5 in at least 1 tooth, n:55)] were selected from among approximately 800 patients applying to the Endodontics Department for routine control examinations. A gender-, age- and weight-matched control group (Group 1: PAI 1–2) comprised 35 oral and systemically healthy individuals applying to the clinic for routine check-ups that included routine examinations. The total number of participants included in this study was 125 people. Exclusion criteria included the following: acute or chronic inflammatory/rheumatoid, cardiovascular, muscle-joint-bone, or connective tissue diseases or diabetes mellitus; local or generalized infections; a history of smoking, antibiotic or anti-inflammatory drug use within the past 6 months; high doses of biotin within the past 48 h; and pregnancy/lactation. Patients undergoing dental treatment and those with another periodontal disease in addition to AP were also excluded from this study.
Demographic and clinical features
Demographic characteristics of the participants [age, body mass index (BMI), the Simplified Oral Hygiene Index (OHI-S)], findings of intraoral examination [number of teeth with root canal treatment (RCT), dental crown, composite/amalgam fillings (CF), and number of missing teeth (NMT), etc.] and radiological findings [periapical index (PAI) score] were recorded. The oral hygiene status of participants was evaluated by the Simplified Oral Hygiene Index (OHI-S) [23].
Apical periodontitis classification and abscess scoring based on the PAI system
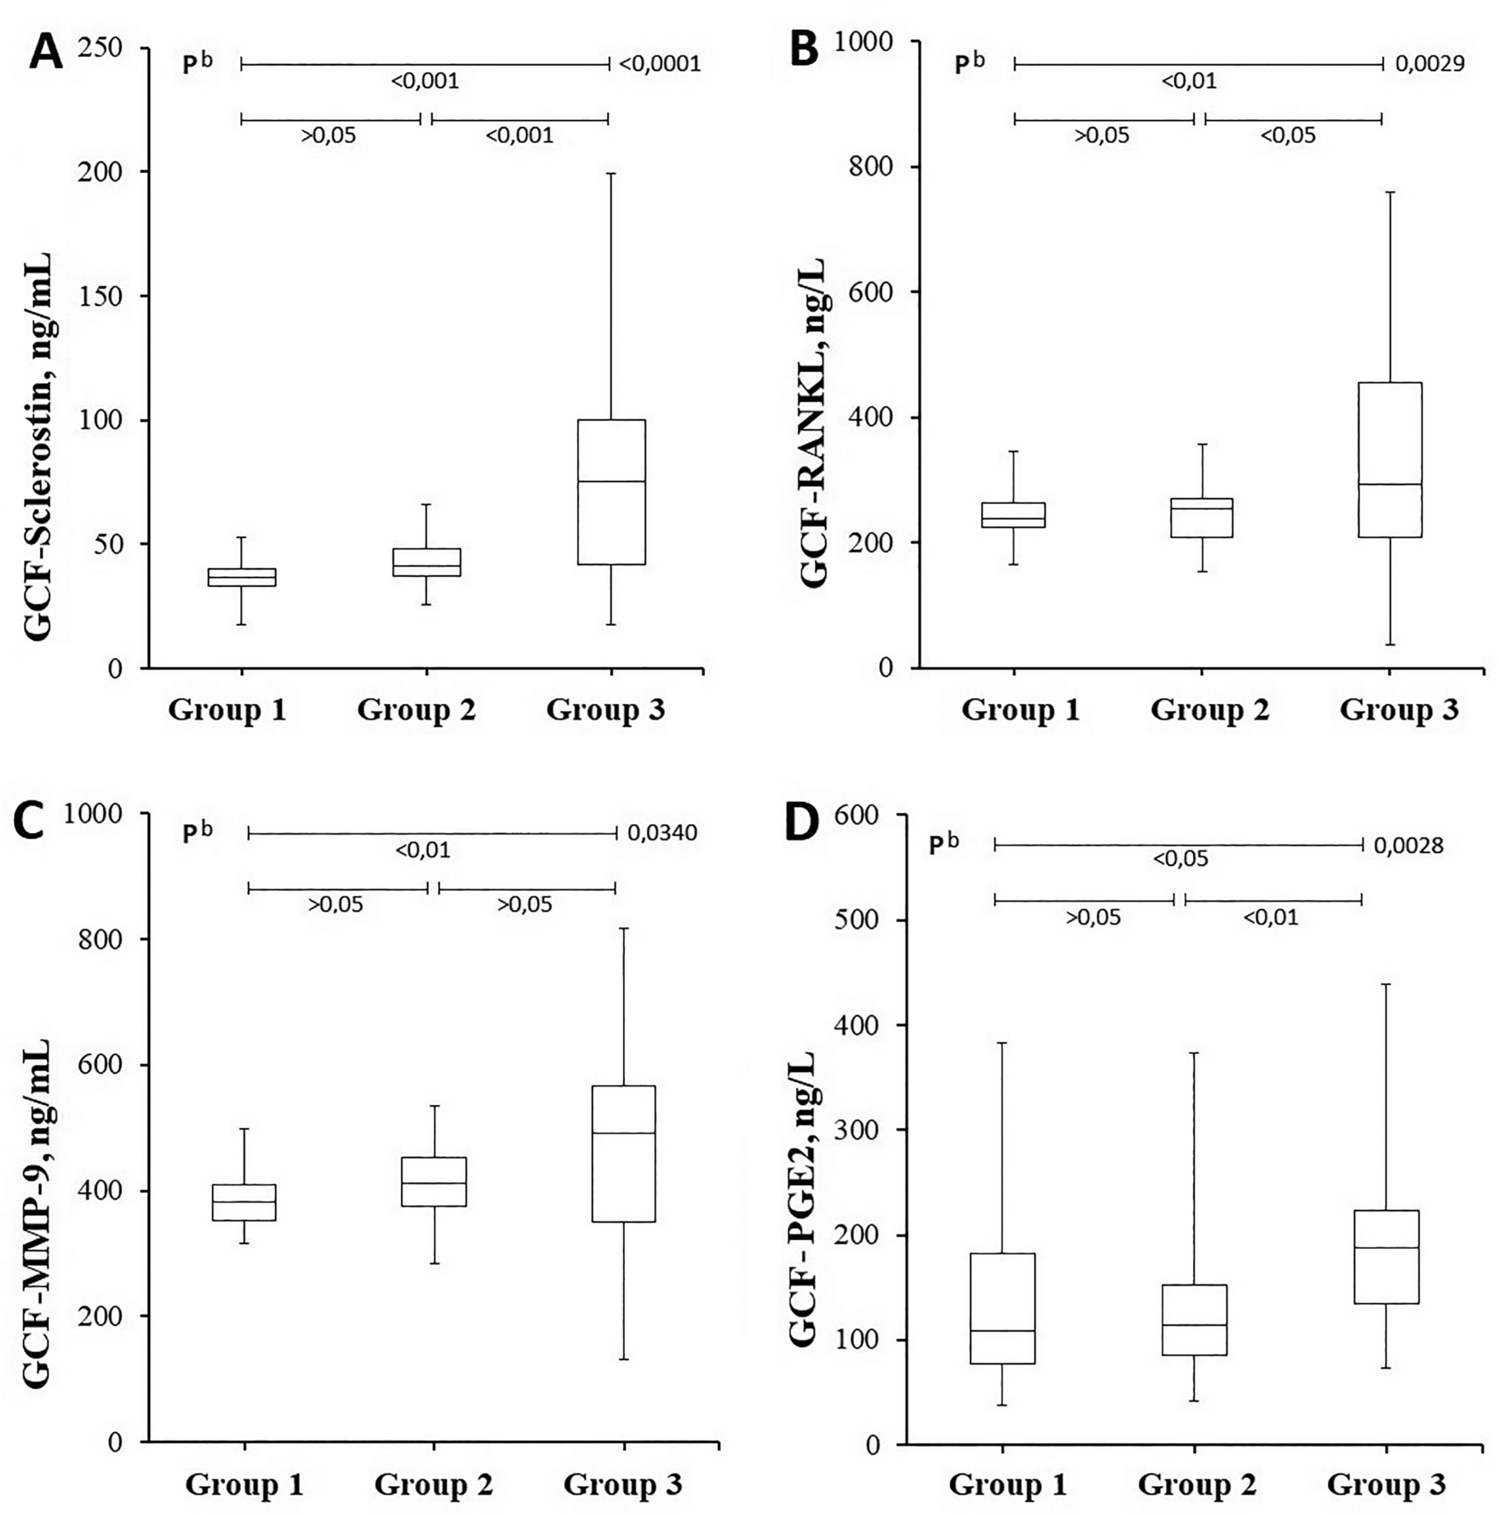
Radiographs were taken of all teeth present in the oral cavity and assessed for the presence of radiolucent images associated with the periapical region and radiographic bone loss. Panoramic radiographs were obtained using a digital panoramic unit (VistaPano S, Durr Dental AG, Germany) operated at 73kVp and 10 mA in standard mode and an exposure time of 13,500 ms. Periapical radiographs were obtained from a Carestream RVG 5200 (RVG; Carestream Health Inc, Atlanta, CA, USA) system with an X-ray unit operated at 70 kV, 8 mA, and using the bisecting angle technique. Radiographs were analyzed with Kodak Dental Imaging Software. The presence of periapical radiolucency without periodontal disease (probing depth of < 3 mm and no radiographic bone loss) was considered sufficient for a diagnosis of AP. Participants were divided into three groups based on periapical index (PAI) scores suggested by Ørstavik et al. [24], as follows: Group 1 (control group, health patients without AP): 35 healthy individuals with PAI score 1–2; Group 2 (mild-moderate AP): 35 patients with AP and PAI score 3–4; Group 3 (severe AP): 55 patients with AP and PAI score 5 (characterized by bone resorption). A further classification named abscess scoring based on the periapical index (AS-PAI) was performed as an indicator of disease progression using the PAI system. Participants were divided into three subgroups according to the highest AS-PAI score of any tooth, as follows: AS-PAI 0: those having PAI score below 5 for all examined teeth, includes the cases in both Group 1 and Group2, n:70; AS-PAI 1: those with PAI score of 5 in only one tooth, n:31; and AS-PAI 2: those with a PAI score of 5 in two or more teeth, n:24. While the patients in Group 1 and Group 2 were classified as AS-PAI 0 (PAI < 5), the patients in Group 3 were divided into either AS-PAI 1 or AS-PAI 2 depending on the number of teeth having a PAI 5 score. Serum and GCF of all participants were collected and analyzed to determine sclerostin, RANKL, MMP-9, and PGE2 levels.
Venous blood collection
Fasting (8–10 h) venous blood was obtained from forearm antecubital/basic veins of all participants and kept at room temperature for 30 min. The samples were centrifuged at 2500 xg for 10 min, and the upper layer of sera was separated. In order to prevent optical interference in the biochemistry autoanalyzer device (Cobas 8000 Chemistry Analyzer, USA), Hemolysis Indices (HIs) of sera were obtained, and samples with an HI of ˃50 mg/dl Hb were excluded from this study. The remaining sera were aliquoted into 0.5 mL tubes (Eppendorf, Hamburg, Germany) and stored at -80 °C until analysis.
GCF collection
GCF was collected from the area adjacent to the tooth with the highest AS-PAI score in each patient or the corresponding area in controls. Samples were taken prior to periodontal probing in order to avoid blood contamination, and patients were also asked not to eat or drink anything for at least 30 min before the procedure. Samples were taken from the mesial, distal, and buccal surfaces of the selected tooth using PerioPaper strips (OraFlow Inc., NY, USA). After isolating the sampling area with cotton rolls, plaque was removed, the area was gently air-dried, and a strip was inserted until a slight resistance was felt and kept in place for 30 s [24]. Sampling strips were then placed in Eppendorf tubes containing 100 µl of PBS and mixed for 15–20 s using a vortex device (Heidolph Reax Top Vortex, Schwabach, Germany) to allow the GCF to pass into PBS. Any strips contaminated with blood were excluded. GCF sample weights were measured using a precision balance (Shimadzu Libror, Model AEG-220, Germany) and recorded. Eppendorf tubes containing 100 µl PBS and empty PerioPaper strips were weighed on a precision balance and tared by removing them from the PerioPaper strips soaked in GCF. Tubes were stored at −80 °C until analysis. Prior to analysis, both GCF and serum samples were allowed to thaw slowly at + 4 °C and then brought to room temperature before measurement.
ELISA analysis of biochemical parameters
Enzyme-linked immunosorbent assays (ELISA) were performed to measure serum sclerostin, RANKL, MMP-9, and PGE2 levels using a Microplate ELISA Reader (BioTek Epoch 2 Microplate ELISA Reader, USA). Sclerostin, RANKL, MMP-9 (Sunred Biological Technology Co., Ltd, Shanghai, China), and PGE2 test kits (Bioassay Technology Laboratory, Zhejiang, China) had sensitivity values of 0.175 ng/mL, 0.945 ng/L, 1.852 ng/ml, and 1.28 ng/L, respectively, and measuring ranges of 0.2–60 ng/mL, 1–300 ng/L, 2–600 ng/ml, and 2–600 ng/L, respectively. Intra- and inter-assay CVs of all tests were < 10%.
Biotinylated human sclerostin, RANKL, MMP-9, and PGE2 antibodies were added to pre-coated plate wells to bind with the sclerostin, RANKL, MMP-9, and PGE2 present in the samples. Streptavidin-HRP (Horseradish Peroxidase), which binds to biotinylated antibodies, was added to the wells, and the plates were incubated according to the manufacturers’ instructions. Wells were washed to remove unbound Streptavidin-HRPs. A peroxidase substrate was then added to the wells, producing a reaction between the substrate and the peroxidase enzyme that was terminated by the addition of an acidic stop solution. The intensity of the resulting color change is proportional to the levels of sclerostin, RANKL, MMP-9, and PGE2. Absorbance was measured at 450 nm.
Statistical analysis
Statistical analysis of the study data was performed using the statistical software program SPSS (IBM Corp, 25 Version, Chicago, USA). Chi-square tests were used to evaluate categorical data (e.g., age, gender, number of teeth), and Kolmogorov–Smirnov tests were used to determine normality of distribution. Multi-group comparisons of nonparametric and parametric data were made using Kruskal–Wallis and one-way ANOVA tests, respectively. Relationships between independent variables were examined by Spearman (nonparametric data) and Pearson (parametric data) correlation analyses. Receiver operating characteristic (ROC) analysis was performed to determine the diagnostic performance of GCF sclerostin, GCF RANKL, GCF MMP-9, and GCF PGE2 tests in determining the severity of AP disease. The Area Under the Curve (AUC) was considered a practical measure of diagnostic adequacy, with an AUC value > 0.70 accepted as the minimum discriminatory power cutoff. AUC values of 0.8–0.9 and > 0.9 were considered to represent, respectively, “high” and “very high” discriminatory ability [26,27,28]. Fisher's Exact Test was used to determine the association between sclerostin, MMP-9, and PGE2 and severe abscess formation. Binary regression analysis was used to determine the effects of the independent variables sclerostin, RANKL, MMP-9, and PGE2 on the dependent variable severe AP and to predict AP severity. Bar plots provide graphic displays of nonparametric data.
Power analysis
According to a priori power analysis conducted by Kumar et al. [29] for their study of CGF PGE2 levels in patients with periodontal disease, at least 3 experimental subjects and 3 independent controls are required to assess GCF PGE2 levels (G*Power Version 3.0.10, effect size 3.42, α = 0.05, power = 0.90). However, Maïmoun et al. [30] stated that analysis of sclerostin levels in acute spinal cord injuries (G Power 3.1.9.4, effect size d: 0.6342, α err: 0.05, power: 0.80) requires at least 32 patients and 32 controls. Given that parametric tests conducted with a sample size of at least 30 offer stronger predictive power, this study was conducted with 35 subjects in both Group 1 (control group) and Group 2 (moderate AP) and 55 subjects in Group 3 (severe AP). Since Group 3 (PAI 5, n = 55), which represents severe cases in our study, includes more participants compared to other groups, this may increase the statistical power of the study results and enable more generalizable judgments to be reached.

Comments (0)