
Remember me


The China Health and Retirement Longitudinal Study (CHARLS) is a nationally representative project among middle-aged and elderly adults in mainland China. The CHARLS aims to collect high-quality microdata among residents aged 45 years or above from 450 villages/communities to analyze the aging in China and improve interdisciplinary studies on aging. Detailed design and sampling approaches have been described previously (Zhao et al. 2014). Initially, 17,708 respondents were recruited from 28 provinces in 2011 using a multistage probability sampling strategy (see eMethods), and then were followed up every two to three years. During each survey, the demographic information, lifestyle and behavior characteristics, and health conditions were collected.
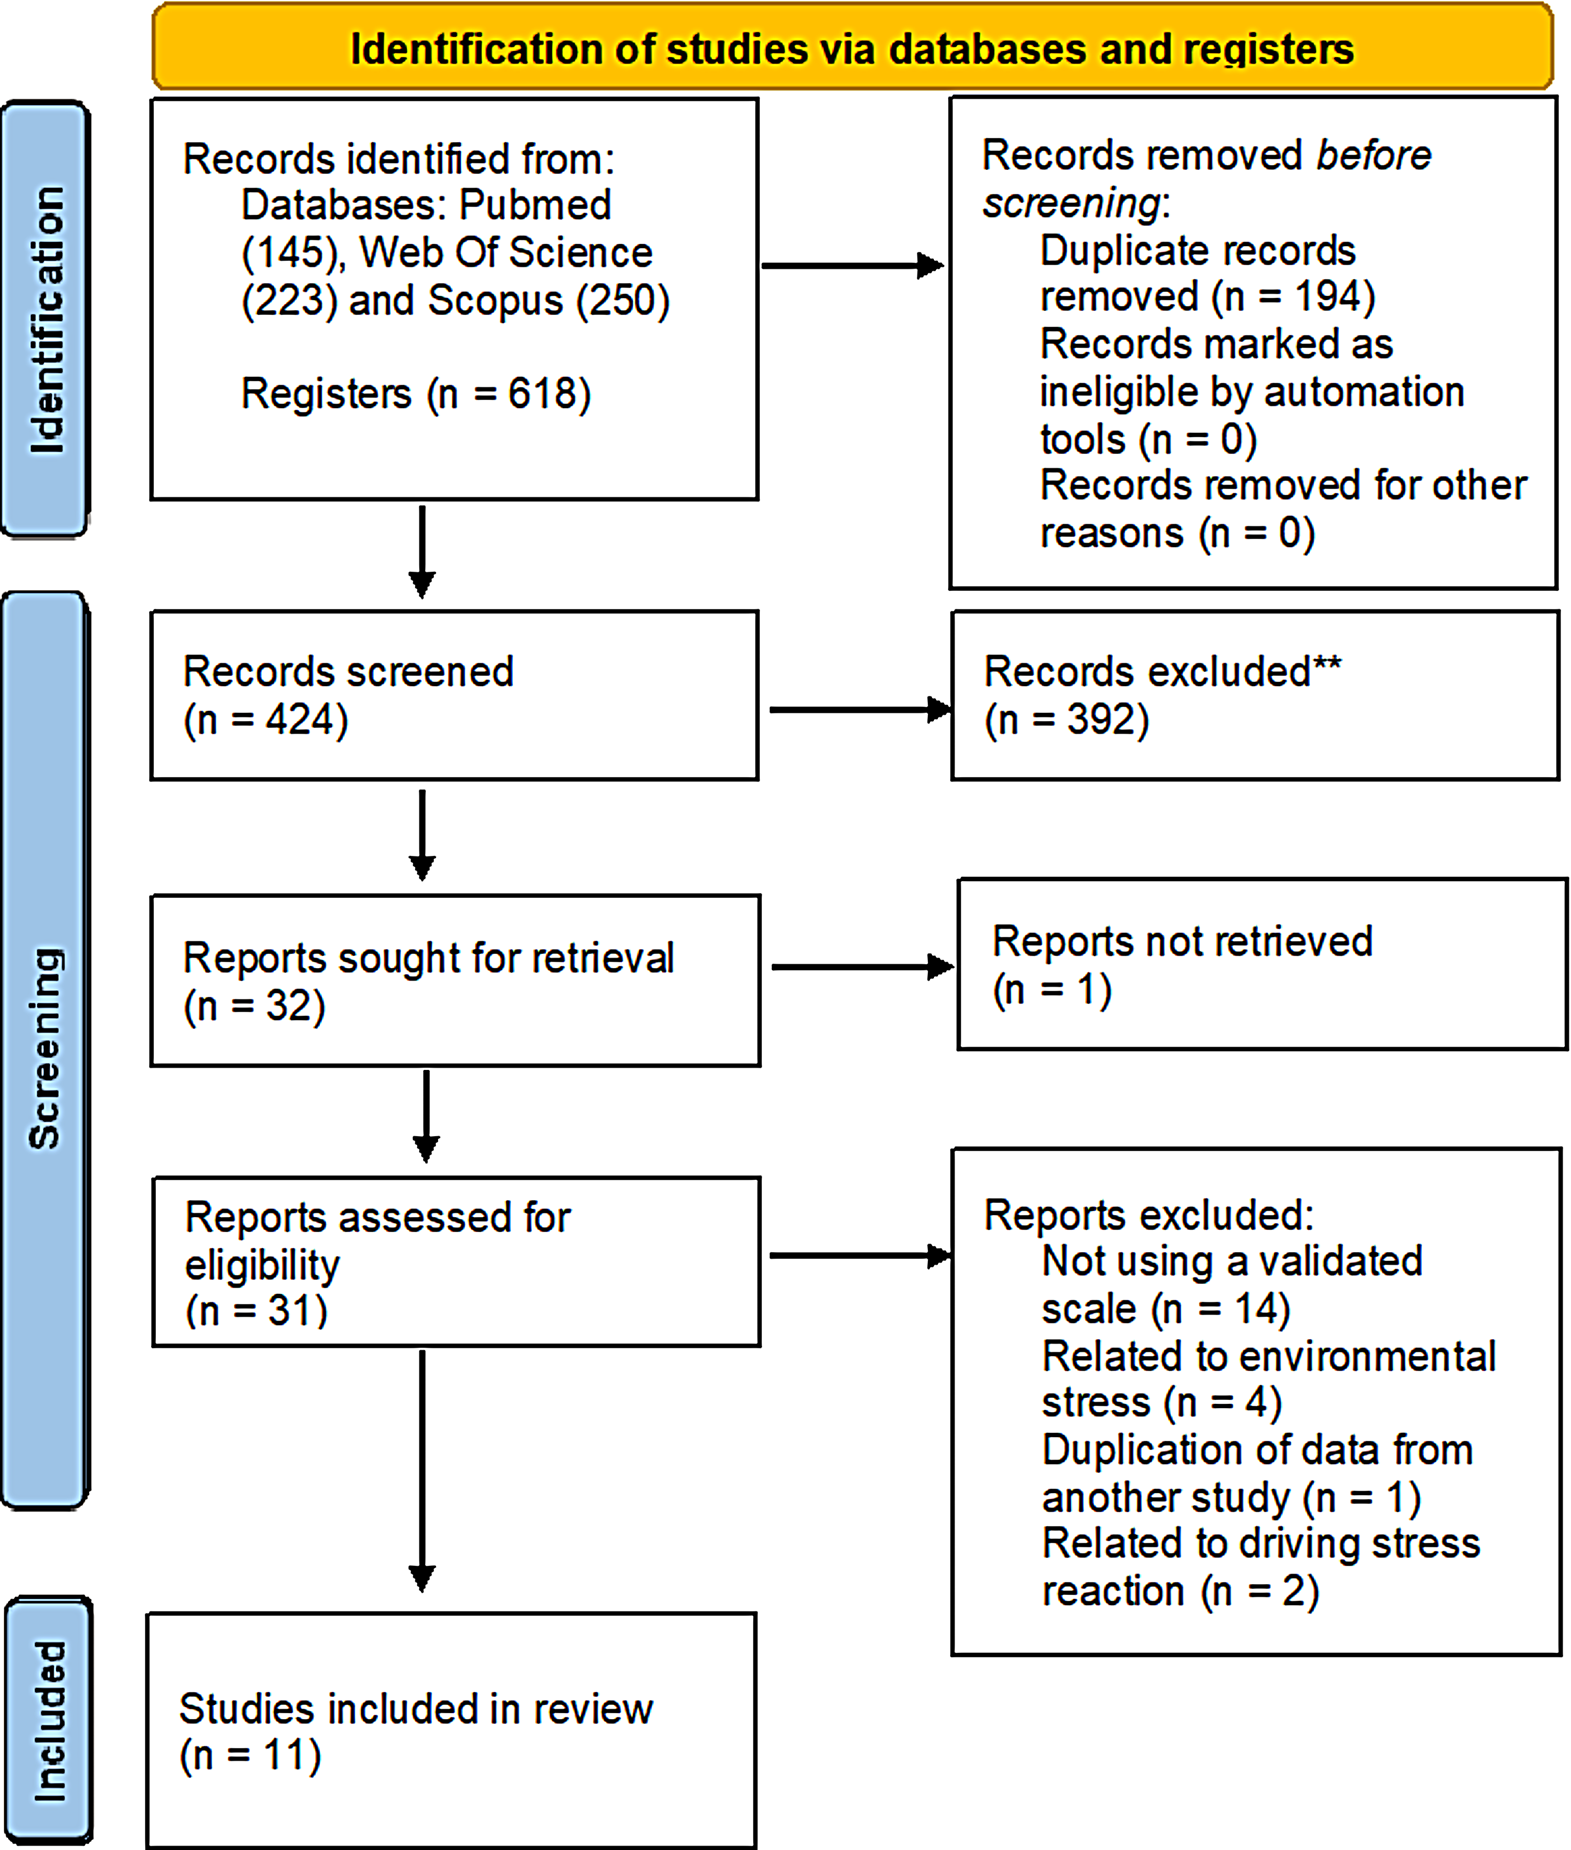
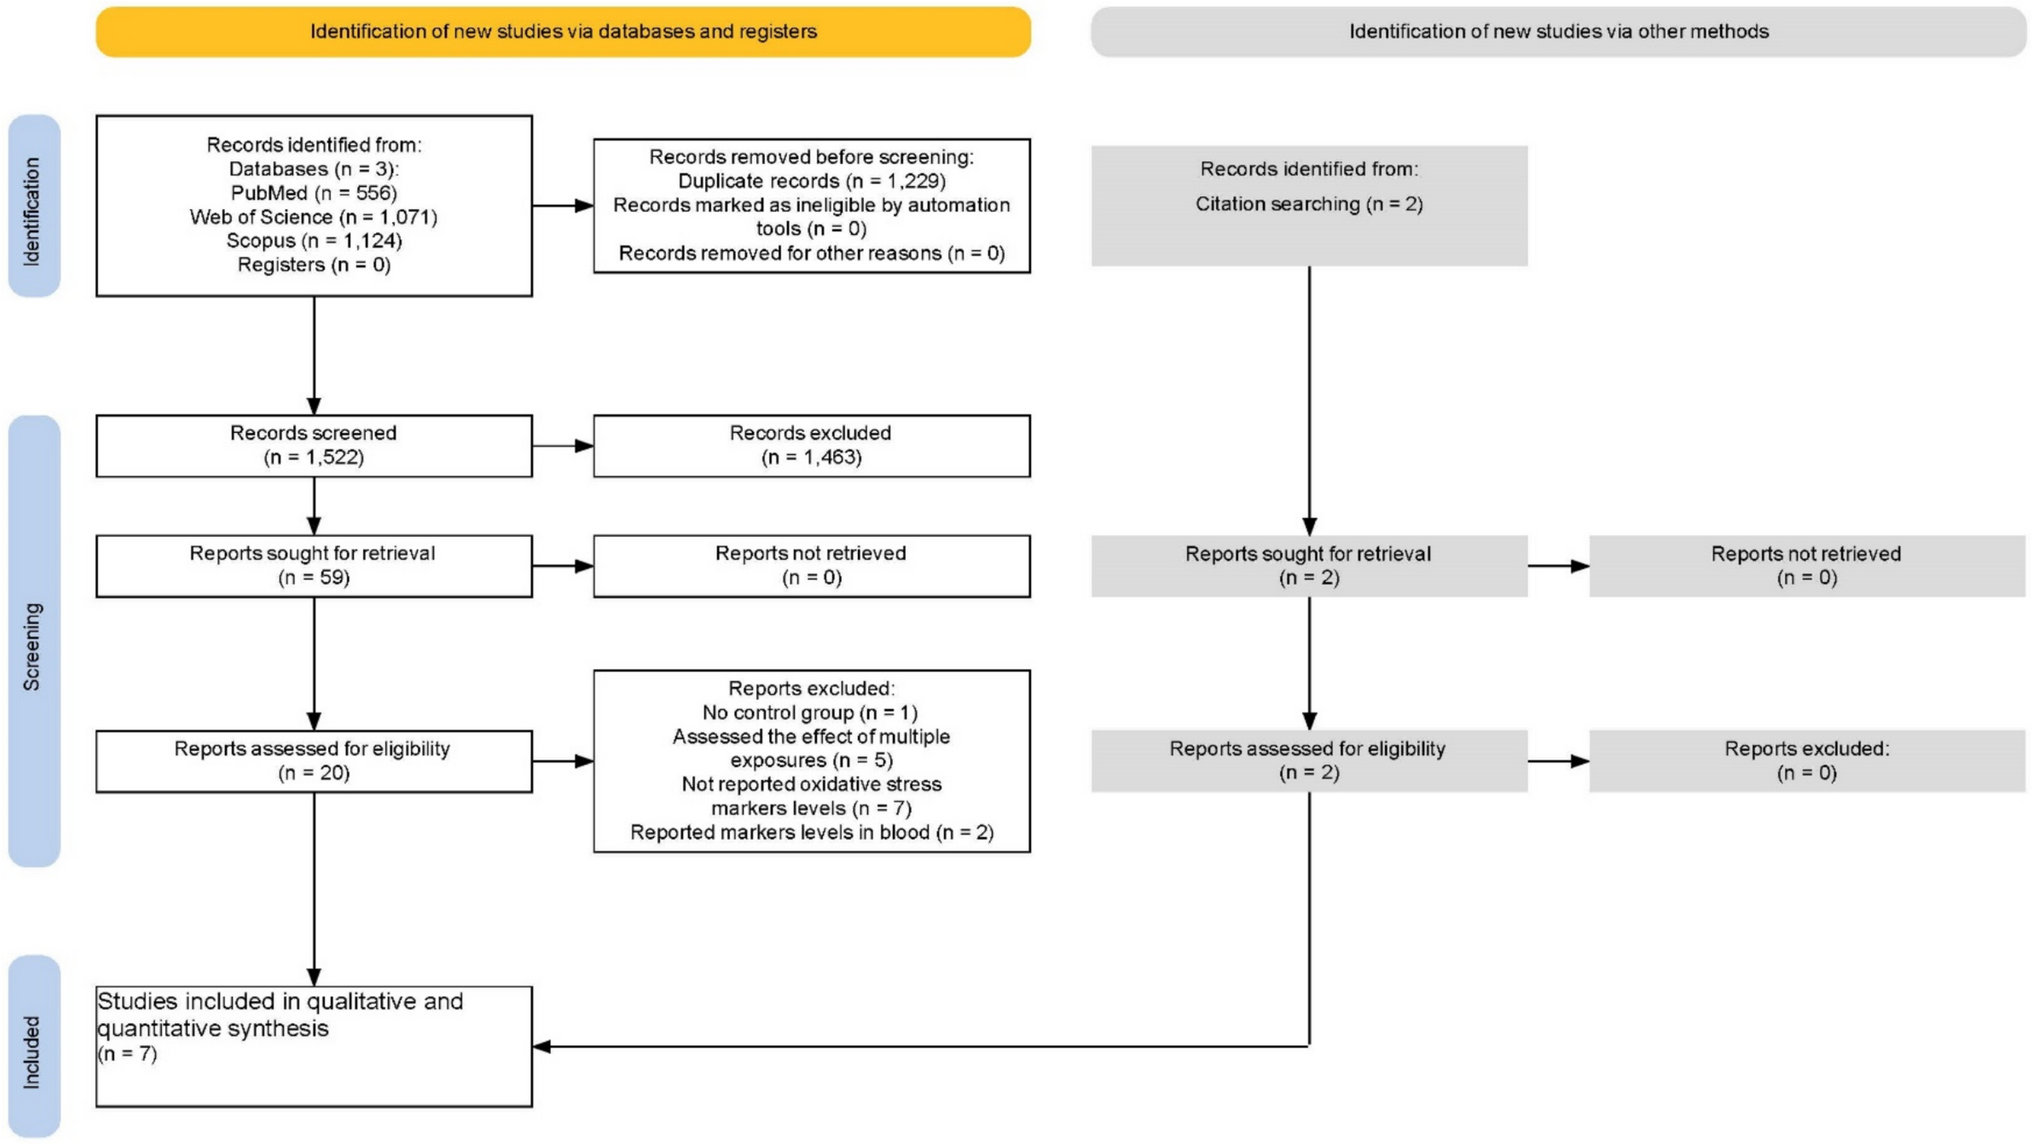
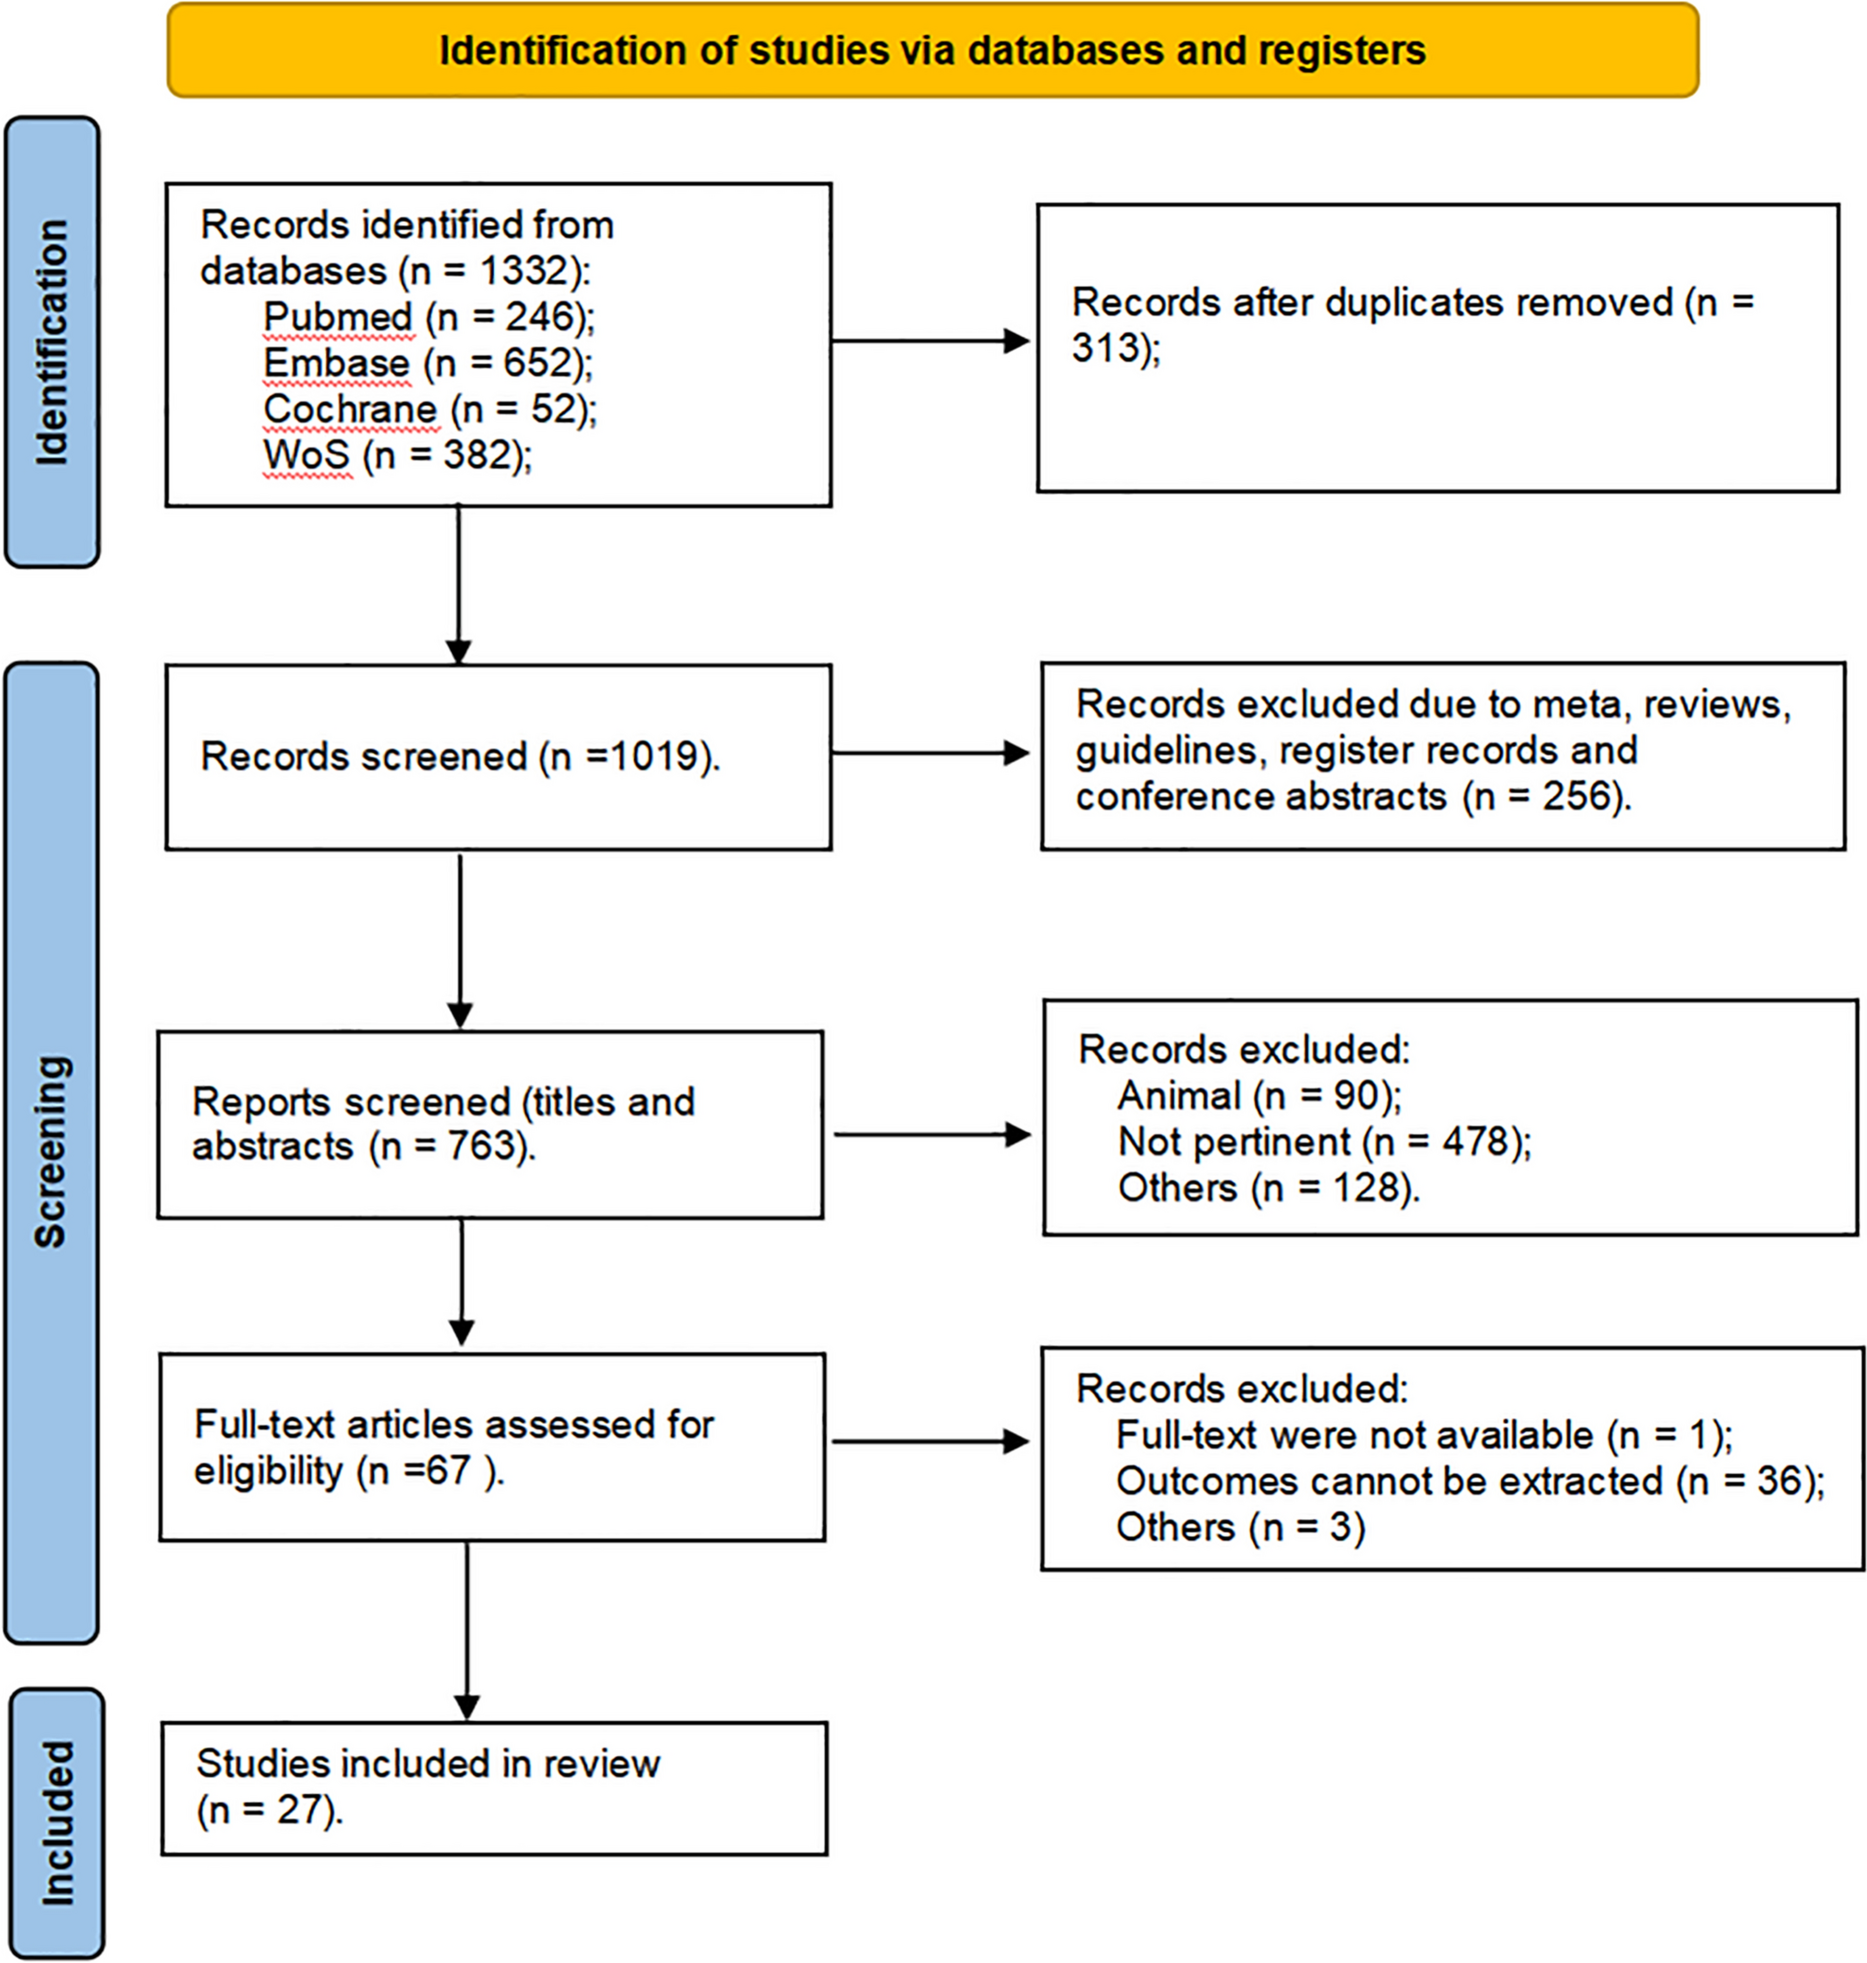
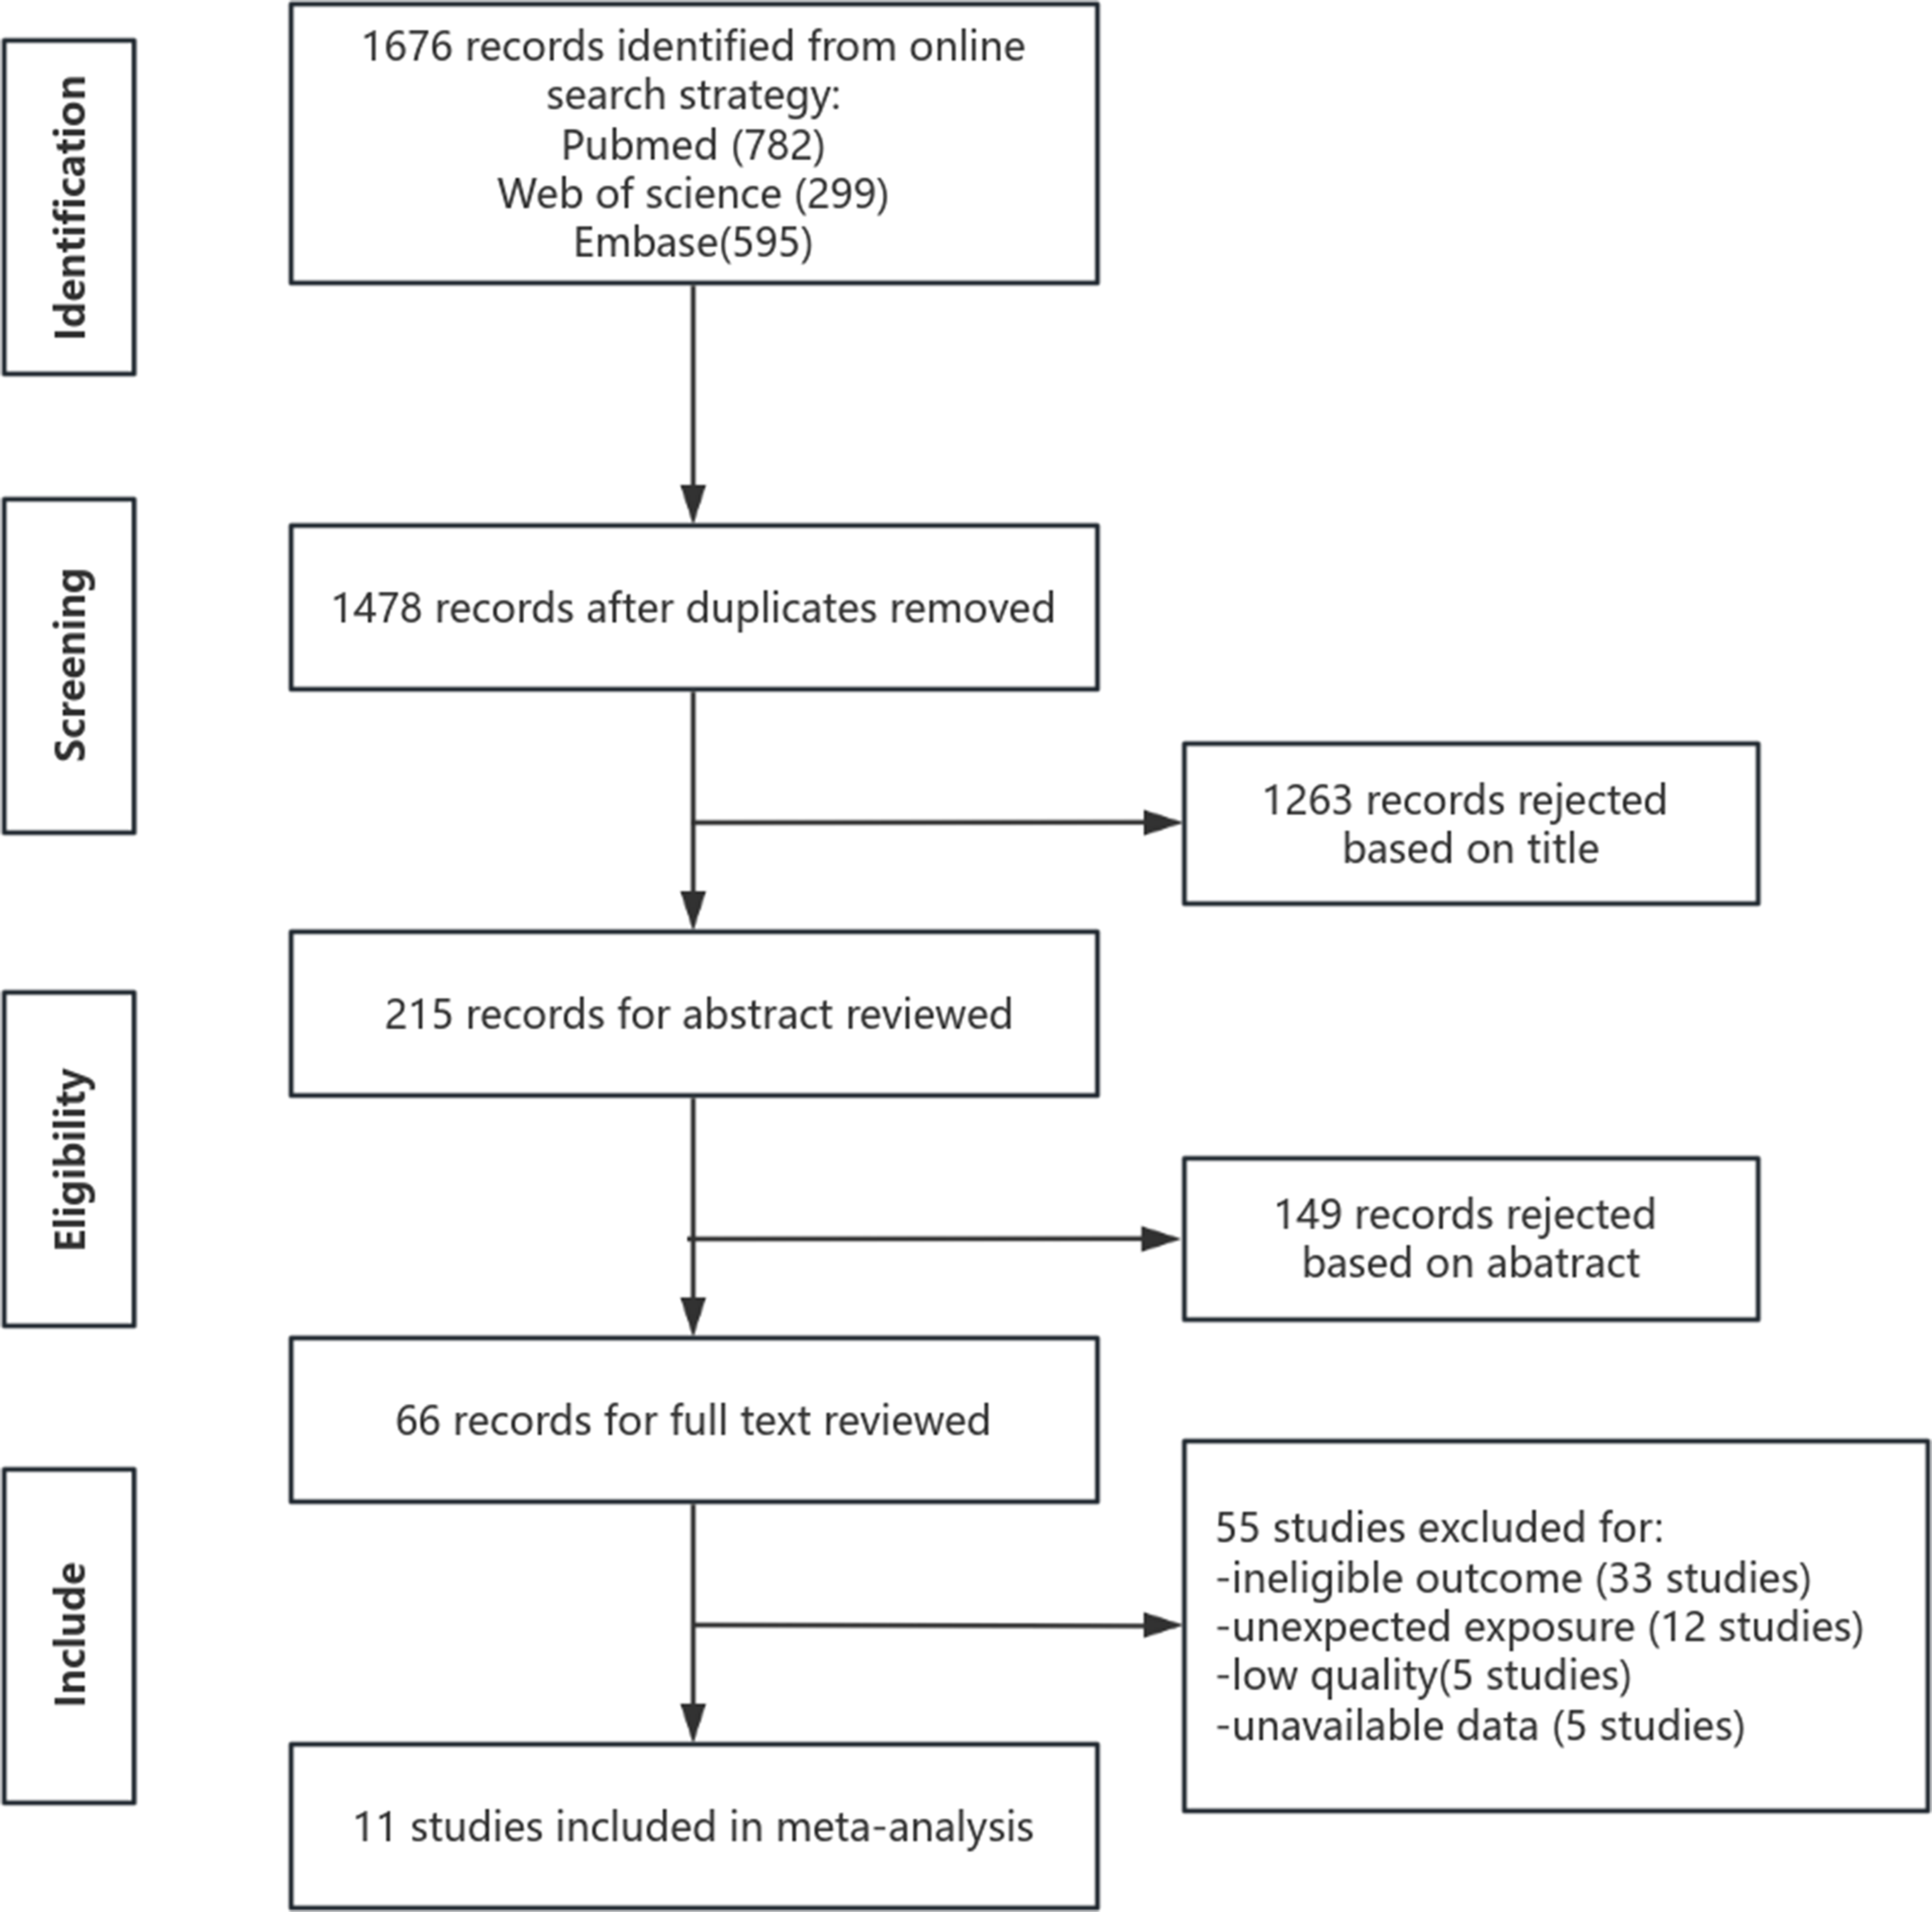
In the current study, a total of 21,095 respondents were recruited in the CHARLS 2015. We excluded women, individuals younger than 45 years or without age data, and those with the missing outcome, 8,826 individuals from 125 county-cities (eMethods, Figure S1) across 28 provinces were screened for the final analyses. Figure S2 shows the flowchart of the participants’ selection. The CHARLS was ethnically approved by the Peking University institutional review board (IRB00001052–11015). Informed consent was signed by each participant. Our study was in accordance with the ethical principles of the Declaration of Helsinki.
Exposure estimationData on annual average concentrations of PM2.5 and PM10 at 1 km resolution (Wei et al. 2021a, b, 2023a, b), NO2, SO2, CO, and O3 at 10 km resolution (Wei et al. 2022, 2023a, b) across China from 2011 to 2015 were retrieved from the ChinaHighAirPollutants (CHAP) dataset (available at https://weijing-rs.github.io/ product.html). The CHAP is a high-quality product for air pollution, which used a conglomeration of multiple sources including ground-based measurements, satellite models, atmospheric reanalysis, and was generated using artificial intelligence to account for the spatiotemporal variations of air pollution. The cross-validation coefficient of determination (R2) ranged from 0.80 to 0.92 for the predictions of these six air pollutants (Wei et al. 2021a, b, 2022, 2023a, b). Outdoor PM2.5−10 was calculated by subtracting the annual PM2.5 from PM10. Given the privacy considerations, the specific residential addresses of participants were geocoded at the county-city level in the CHARLS, similar to previous studies (Zhao et al. 2025; Hu et al. 2023; Shi et al. 2023; Han et al. 2022). Exposure to air pollutants was thus evaluated according to the gridded estimates within the 125 Chinese county-cities. We utilized two-year average concentrations of air pollutants before 2015 survey as long-term exposure for each participant in the main analyses.
Assessment of BPHIn accordance with previous studies from the CHARLS (Xiong et al. 2022; Zhang et al., 2022b), individuals were asked during the face-to-face interview, “Have you ever been diagnosed with prostate hyperplasia (excluding prostatic cancer)? Moreover, researchers also explained the main symptoms of BPH to the participants (Xiong et al. 2022). The diagnosis of BPH was based on a positive response to this question, after understanding the symptoms of BPH.
CovariatesDemographics included age, body mass index (BMI), education attainment, marital status, and place of residence (urban or rural). lifestyle and Behavior factors including tobacco smoke (never, current, or previous), alcohol use (yes or no, specifying if they had ever consumed alcohol) (Shi et al. 2024), physical activity levels (low, moderate, or high), and the self-rated health status (good, fair, or poor) were recorded. Additionally, annual average temperature and relative humidity (RH) was obtained from the China Meteorological Data Service Center.
Statistical analysesThe distributions of the baseline characteristics were described, and the χ2 test and t-test were adopted for comparison of categorical variables and continuous variables, respectively. The distributions of the exposure levels of air pollutants were described. Spearman’s correlation analyses was conducted to explore the correlation between any two air pollutants.
Multivariable logistic regression was applied to explore the association of the two-year average of air pollutants with prevalent BPH. The estimated odds ratio (OR) was reported for per 10 µg/m3 increase in air pollutants except for CO (per 1 µg/m3). Both crude and adjusted models were performed to analyze the association. According to the priori knowledge and existing literature (Xiong et al. 2020; Morita et al. 2013; Parsons 2007; Burke et al. 2006), we developed a directed acyclic graph (DAG) to determine which candidate covariate should be adjusted in the multivariate analyses (Figure S3), using the online DAGitty tool (www.dagitty.net). The model finally included age, BMI, educational attainment, marital status, tobacco smoke, alcohol use, self-rated health status, residence, annual temperature, and RH. Moreover, we assessed the relationships by dividing air pollutant levels into four quartiles and calculated the estimates using the lowest quartile as the reference. Trend analyses were conducted by modeling each quartile level of pollutants as an ordinal variable. Furthermore, to examine the exposure-response relationships between air pollutants with BPH, a restricted cubic spline (RCS) model with three knots was conducted.
We performed several stratification analyses by following variables: age (≥ 65 years or < 65 years), overweight/obesity (yes or no; specifying by BMI ≥ 24.0 kg/m2), smoke exposure (yes or no), alcohol use (yes or no), and place of residence (urban or rural). Sensitivity analyses by conducting a two-pollutant model to evaluate the association. We examined the robustness of the association by using five-year exposure before the survey as a sensitivity analysis. Considering that only a subset of the respondents were collected data on physical activity in the CHARLS (Li et al. 2020), we adjusted for physical activity in the sub-sample (n = 4,398).
All analyses were conducted using STATA software (version 16.0), and two-tailed P < 0.05 were considered statistically significant.
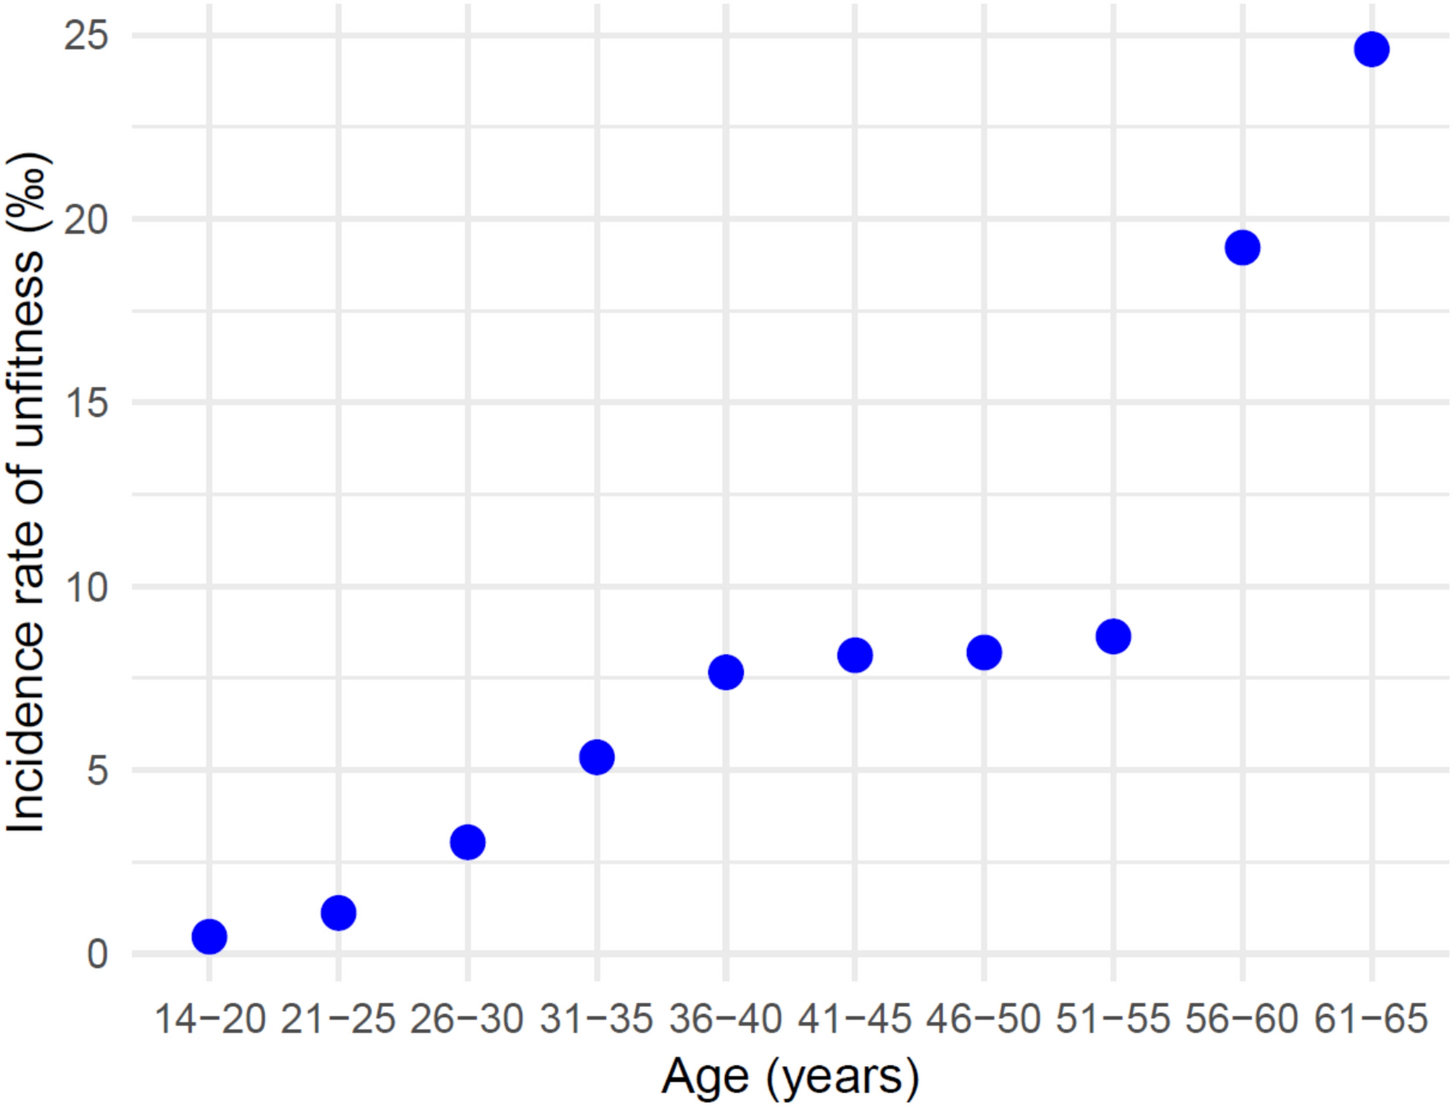
ResultsOf the 8,826 male adults (mean age 60.3 [SD 9.8] years), 1283(14.5%) had BPH in 2015. Table 1 shows that individuals with BPH are more likely to be older, unmarried, have a higher BMI, smoke, and consume alcohol, compared with their counterparts.
Table 1 The characteristics of the study participantsThe mean exposure concentrations of PM2.5, PM2.5−10, NO2, SO2, CO, and O3 during the cross-sectional period were 66.13 (SD:22.68) µg/m3, 47.21 (20.97) µg/m3, 35.44 (10.84) µg/m3, 34.46 (17.02) µg/m3, 1.13 (0.39) mg/m3, 82.04 (13.63) µg/m3, respectively. Table 2 also shows the correlation between any two of the pollutants.
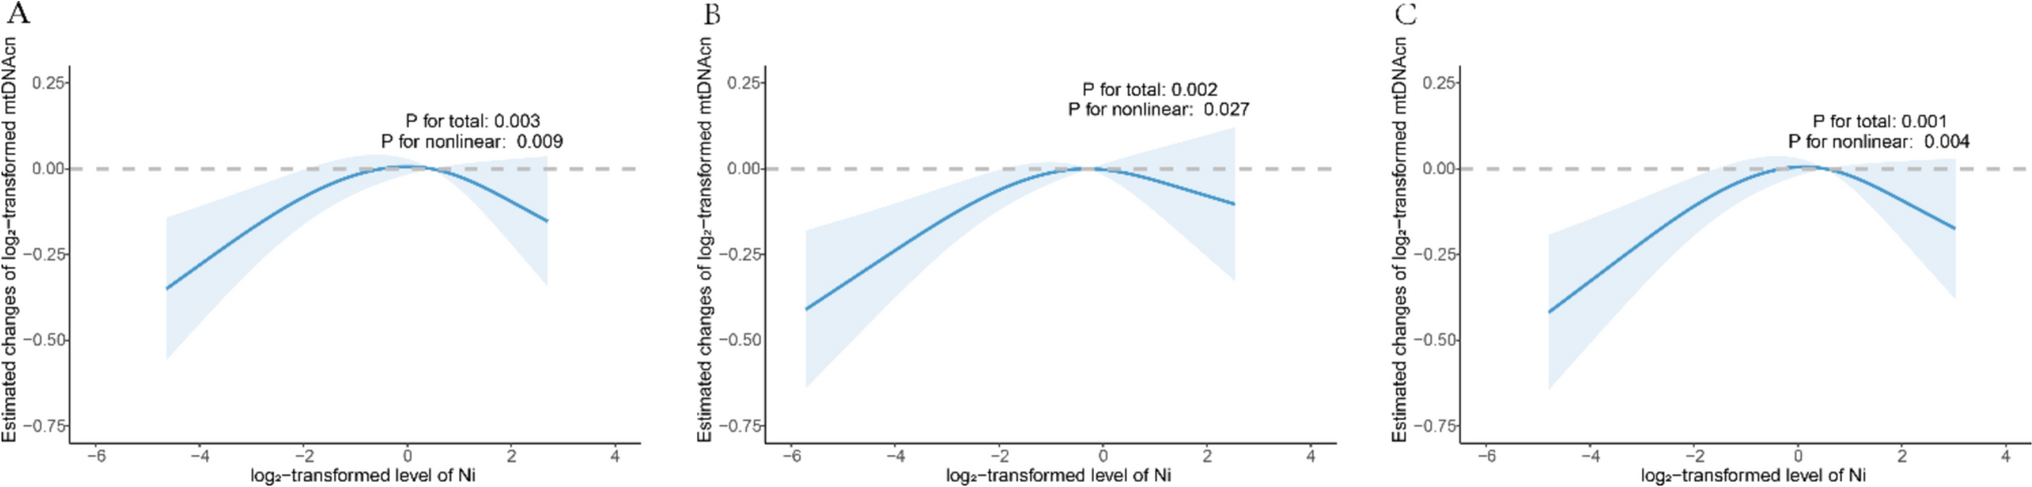
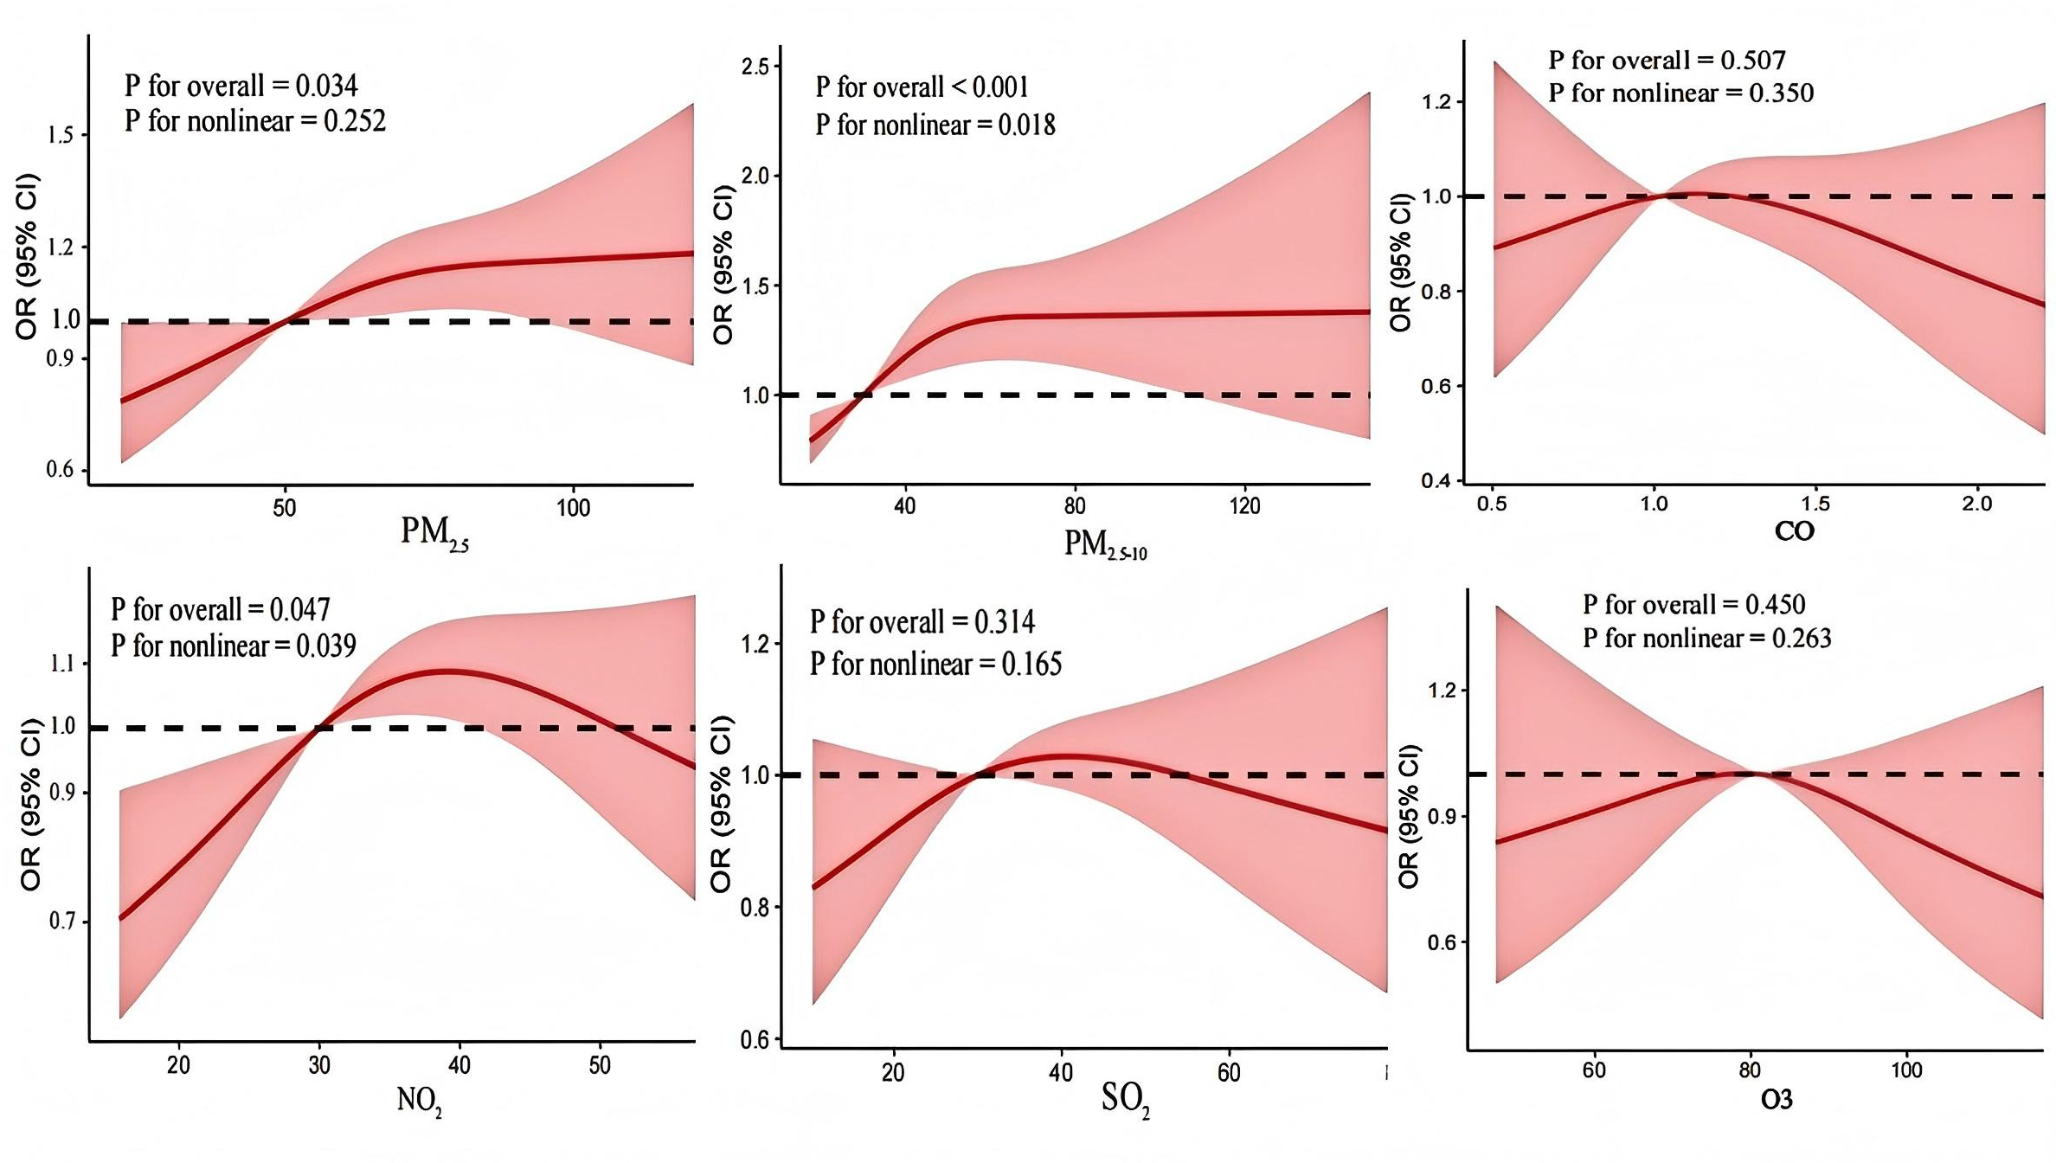
Table 2 Distribution and correlation of the exposure concentration of air pollutantsTable 3 displays the cross-sectional associations of exposure to air pollutants with prevalent BPH. After controlling for confounders, each 10 µg/m3 increase in PM2.5 (OR 1.04, 95% CI: 1.01–1.07) and PM2.5−10 (1.06, 1.02–1.10) were positively associated with prevalent BPH. In the quartile analysis, the highest quartile levels of PM2.5 and PM2.5−10 were related to a higher prevalence of BPH, compared to the lowest quartile (Ptrend <0.05). However, the quartile analysis showed no significance for NO2, SO2, CO, and O3 in the adjusted model (Table 3). We observed significant nonlinear relationships between PM2.5−10 and NO2 exposure with prevalent BPH (Pnonlinear <0.05, Fig. 1). Notably, the RCS curve for the association of PM2.5 and prevalent BPH is approximately linear overall (Fig. 1).
Table 3 Cross-sectional associations of long-term exposure to air pollutants with prevalent BPHFig. 1
Exposure-response relationship between long-term air pollutants exposure with prevalent BPH. Note: model adjusted for age, BMI, education attainment, marital status, smoke, alcohol drink, self-rated health status, residence, ambient temperature, and relative humidity
Figure 2 shows the subgroup analysis of the association with BPH by age, BMI, place of residence, and behavior characteristics separately. We observed a higher risk of BPH in individuals who were overweight/obesity after exposure to PM2.5−10 (p interaction = 0.003). However, the association with BPH was not modified by age, smoke, alcohol drinking, and residence (Fig. 2).
Fig. 2
Association of air pollutants exposure with BPH stratified by age, BMI, residence, and behaviour characteristics. Note: the estimates were obtained from each 10 µg/m3 increment in air pollutants except for CO (1 mg/m3). Model adjusted for age, BMI, education attainment, marital status, tobacco smoke, alcohol use, self-rated health status, residence, ambient temperature, and relative humidity except for the stratified variable
After further adjusting for other air pollutants, the two-pollutant models showed similar results for PM2.5 and PM2.5−10 (Table S1). Sensitivity analysis by using five-year air pollutant exposure showed a robust association of PM2.5 and PM2.5−10 with BPH (Table S2). By considering physical activity in the sub-sample, a significant association was observed for PM2.5−10 (Table S3).
Comments (0)