
Remember me

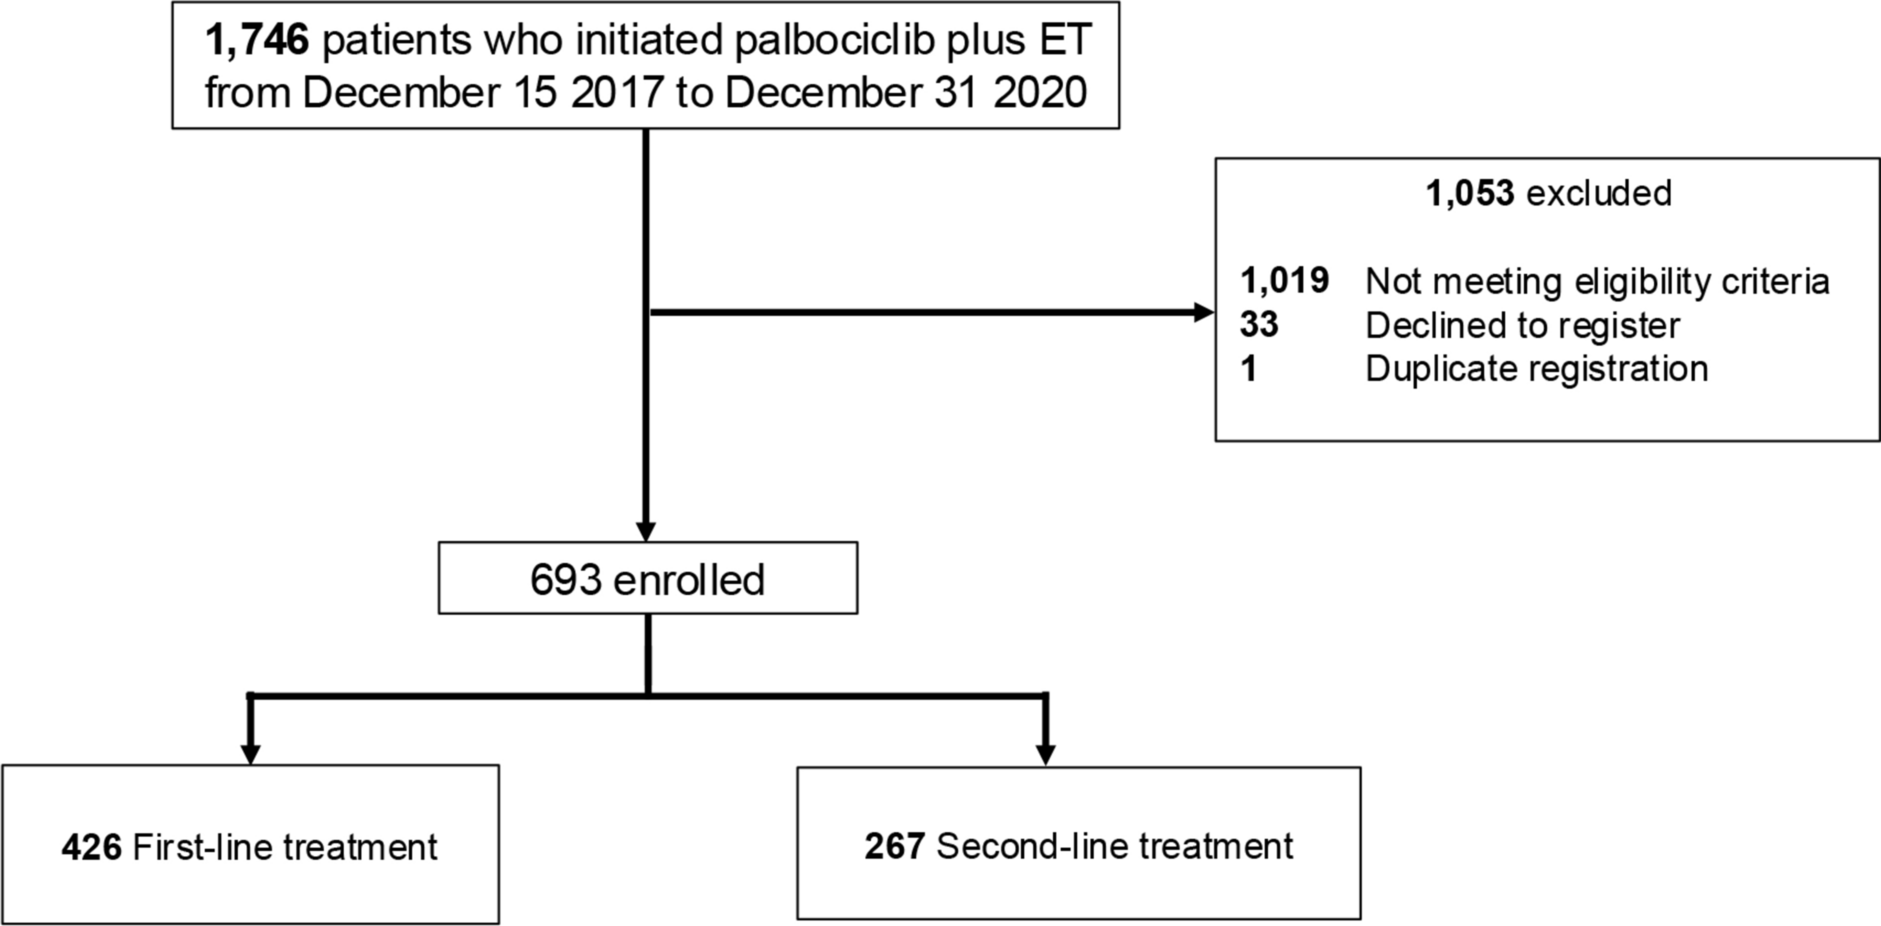
We identified 219 patients from a cohort of 236 who received trastuzumab-containing NAC (Figure S1). Patient characteristics appear in Table 1. NAC regimens comprised anthracycline–taxane combination in 175 patients (79.9%), while 44 patients (20.1%) received taxane-based therapy. All patients received NAC with trastuzumab: 166 (75.8%) received trastuzumab alone, and 53 (24.2%) received a combination of trastuzumab and pertuzumab. Adjuvant chemotherapy was administered to 96.3% of the patients. Among them, 163 (74.4%) were treated with trastuzumab monotherapy, 39 (17.8%) with trastuzumab and pertuzumab, and 7 (3.2%) with T-DM1.
Table 1 Patient and treatment characteristicsEvaluation of ARTFigure 1a represents a section of the largest tumor slice from a case where numerous cancer cells remained after NAC, with Fig. 1b offering a magnified view of the same area. The ART, in this case, was 330 mm2. Figure 1c shows a patient with minimal residual cancer cells, while Fig. 1d provides a closer view of Fig. 1c. In this case, the ART was 0.015 mm2. Overall, 137 patients had no primary residual tumor, with an ART of 0 mm2 (ART-0), and the median ART of patients excluded ART-0 was 4.2 mm2 (range, 0.0012–1700 mm2) (Fig. 1e). The median relative-ART of patients excluded relative-ART was 0.050 (range, 0.00012–1.0) (Fig. 1f).
Clinicopathological features stratified by ART statusThe ROC curve for ART against EFS was created after excluding the 137 patients with ART-0 and revealed an area under the curve (AUC) of 0.51 (Fig. 2a). The cutoff value for ART was set at 4.0 mm2, determined using the ROC curve by minimizing the distance to ROC curve peaks. The median ART value of 4.2 mm2 in non-ART-0 patients further supported this cutoff. Based on this cutoff, patients were classified into two groups: ART-Low (0 < ART ≤ 4.0 mm2), consisting of 39 patients, and ART-High (> 4.0 mm2), consisting of 43 patients.
Fig. 2
a Receiver operating characteristic (ROC) curve for determining the area of residual tumor (ART) threshold in HER2-positive breast cancer. The area under the ROC curve (AUC) was 0.513, and the cutoff was set at 4.0 mm2. b Kaplan–Meier survival curves for event-free survival (EFS) in patients with HER2-positive breast cancer, stratified by ART groups: ART-0, ART-Low, and ART-High. c ROC curve for determining the relative ART threshold in HER2-positive breast cancer. The AUC was 0.54, and the cutoff was set at 0.05. d Kaplan–Meier survival curves for EFS in patients with HER2-positive breast cancer, stratified by relative-ART groups: relative-ART 0, relative-ART Low, and relative-ART High. AUC area under the curve, ART area of residual tumor, EFS event-free survival, CI confidence interval, HR hazard ratio
Table 2 presents correlations between ART status and patient characteristics. The ART-Low population exhibited higher clinical T stage, ER and PgR positivity, higher ypT and ypN stage, and less frequent use of neoadjuvant pertuzumab and trastuzumab than the ART-0 group. Compared to ART-Low, the ART-High group exhibited more lymphovascular invasion with higher ypT and numerically high ypN. Similarly, when comparing the ART-High group to ART-0, significant differences were observed in ER and PgR positivity, ypT and ypN stages, lymphovascular invasion, and HER2 IHC score 3 + before NAC.
Table 2 Comparison of clinicopathological features according to area of residual tumor (ART) statusPrognostic role of ART and relative-ARTThe median follow-up period was 90.2 months (range: 81.6–97.2). 3-year EFS was 93.3% (95% CI 87.4–96.4) for ART-0, 78.5% (95% CI 61.5–88.6) for ART-Low, and 90.3% (95% CI 76.3–96.3) for ART-High. Analysis revealed inferior EFS in ART-Low versus ART-0 patients (HR 3.33, 95% CI 1.55–7.13, P = 0.001). The ART-High group tended to exhibit shorter EFS compared with ART-0 (HR 2.21, 95% CI 0.96–5.12, P = 0.051). EFS comparison between ART-High and ART-Low groups demonstrated no significant differences (HR 1.56, 95% CI 0.66–3.72, P = 0.307) (Fig. 2b).
A subgroup analysis based on hormone receptor status was conducted. In patients with hormone receptor-positive, ART-0 had a 3-year EFS of 93.4%. In comparison, ART-Low showed a significantly lower 3-year EFS of 78.7% (HR 6.01, 95% CI 1.62–22.28, P = 0.002), while ART-High had a 3-year EFS of 92.9% (HR 2.64, 95% CI 0.63–11.08, P = 0.184) (Figure S2a). No significant difference was observed in EFS between the ART-High and ART-Low populations. In the patients with hormone receptor-negative subgroup, the 3-year EFS reached 93.2% (95% CI 85.5–96.9) for ART-0, 83.9% (95% CI 57.9–94.5) for ART-Low, and 77.8% (95% CI 36.5–93.9) for ART-High (Figure S2b). Survival comparison showed comparable EFS between ART-0 and ART-Low groups (HR 2.09, 95% CI 0.57–7.61, P = 0.252). ART-High patients demonstrated a tendency toward shorter EFS versus ART-0 (HR 2.70, 95% CI 0.85–8.62, P = 0.081). EFS remained similar between ART-High and ART-Low (HR 0.76, 95% CI 0.17–3.40, P = 0.718).
In addition, a subgroup analysis by adjuvant treatment showed that in patients receiving hormonal therapy, the ART-Low group had significantly shorter EFS compared to the ART-0 group (HR 4.31, 95% CI 1.12–16.53, P = 0.021). In patients without hormonal therapy, both the ART-Low and ART-High groups tended to have shorter EFS than the ART-0 group (HR 2.91, 95% CI 1.01–8.40, P = 0.039, and HR 2.53, 95% CI 0.88–7.29, P = 0.075). In patients receiving trastuzumab monotherapy, both the ART-Low and ART-High groups showed significantly poorer prognosis compared to the ART-0 group (HR 3.68, 95% CI 1.51–8.99, P = 0.002, and HR 3.69, 95% CI 1.42–9.57, P = 0.004). Patients who received trastuzumab and pertuzumab included only two ART-High patients and several ART-0. In contrast, patients treated with T-DM1 comprised five ART-High and two ART-Low patients, with no ART-0. These sample size differences make meaningful statistical comparisons between these treatment groups challenging. There were no significant differences in prognosis between ART-Low and ART-High across adjuvant treatment subgroups.
The ROC curve for relative-ART in relation to EFS was plotted after excluding the 137 patients with a relative-ART of 0 (relative-ART 0), resulting in an AUC of 0.54 (Fig. 2c). A cutoff value of 0.05 was established, defining the groups as relative-ART Low (0 < ART ≤ 0.05) with 42 patients and relative-ART High (> 0.05) with 40 patients. The relative-ART Low group demonstrated significantly poorer EFS compared to the relative-ART 0 group (HR 3.28, 95% CI 1.56–6.92, P < 0.001). The relative-ART High group showed a trend toward shorter EFS compared to relative-ART 0 (HR 2.28, 95% CI 0.97–5.33, P = 0.068). However, relative-ART analysis showed no significant EFS difference EFS between High and Low groups (HR 1.56, 95% CI 0.66–3.72, P = 0.323) (Fig. 2d).
Univariable analysis identified four significant EFS predictors: ART, clinical T stage, disease stage, and ypN status. Multivariable analysis demonstrated significantly shorter EFS for ART-Low vs. ART-0 (HR 3.50, 95% CI 1.52–8.06) and a trend for shorter EFS for ART-High vs. ART-0 (HR 2.31, 95% CI 0.89–5.97) (Table 3).
Table 3 Univariable and multivariable analyses of clinicopathological factors for event-free survivalRelation between ART and RCBRCB analysis categorized 129 patients (58.9%) as RCB 0. Among patients showing residual disease, classifications included 34 patients (15.5%) as RCB I, 50 (22.9%) as RCB II, and 6 (2.7%) as RCB III (Fig. 3a). Among the ART-0 group, 129 patients (94.1%) had RCB 0, 2 patients (1.5%) had RCB I, and 6 patients (4.4%) had RCB II. In the ART-Low group, 28 patients (71.8%) had RCB I, while 11 patients (28.2%) had RCB II. The ART-High group comprised 4 patients (9.3%) with RCB I, 33 patients (76.7%) with RCB II, and 6 patients (14.0%) with RCB III (Fig. 3b). The 3-year EFS for RCB 0, RCB I, RCB II, and RCB III were 93.6% (95% CI 87.6–96.8), 87.8% (95% CI 70.7–95.3), 83.2% (95% CI 69.2–91.2), and 83.3% (95% CI 27.3–97.5), respectively (Figure S4).
Fig. 3
a Distribution of residual cancer burden (RCB) scores. Black = pathological complete response (pCR), light gray = residual disease. b Relationship between the area of residual tumor (ART) and RCB score, illustrating how ART correlates with varying degrees of residual disease based on RCB classification. ART area of residual tumor, RCB residual cancer burden
Comments (0)