
Remember me
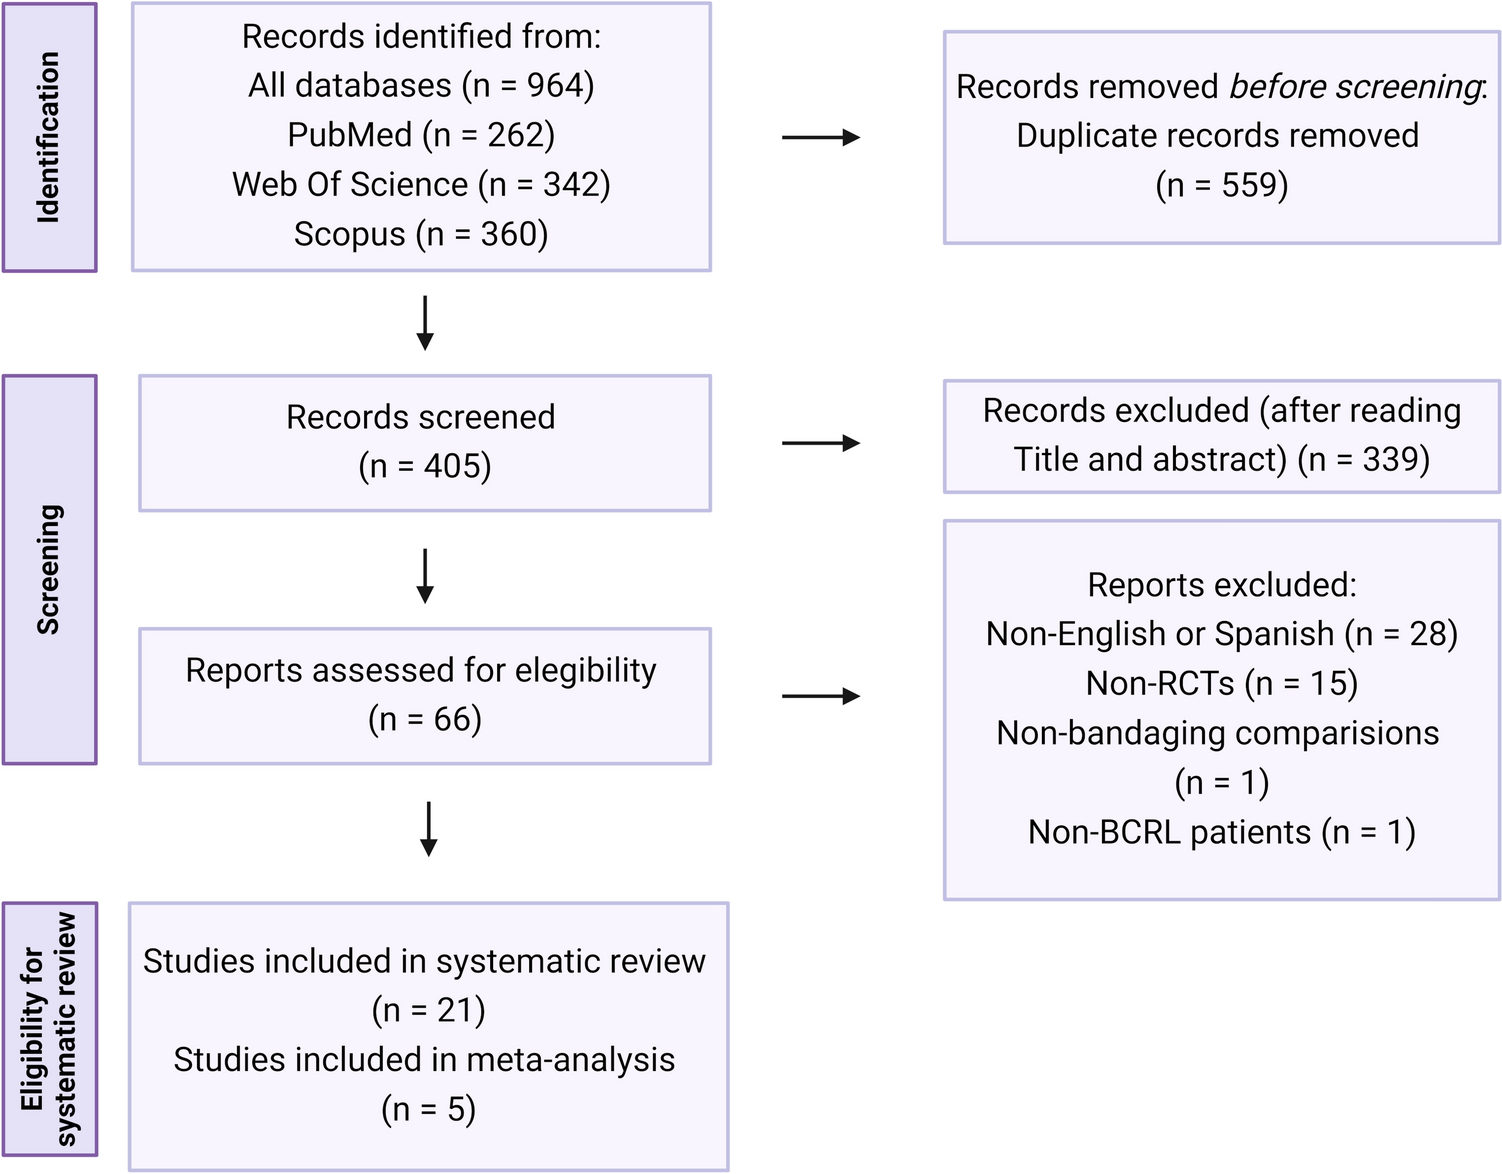

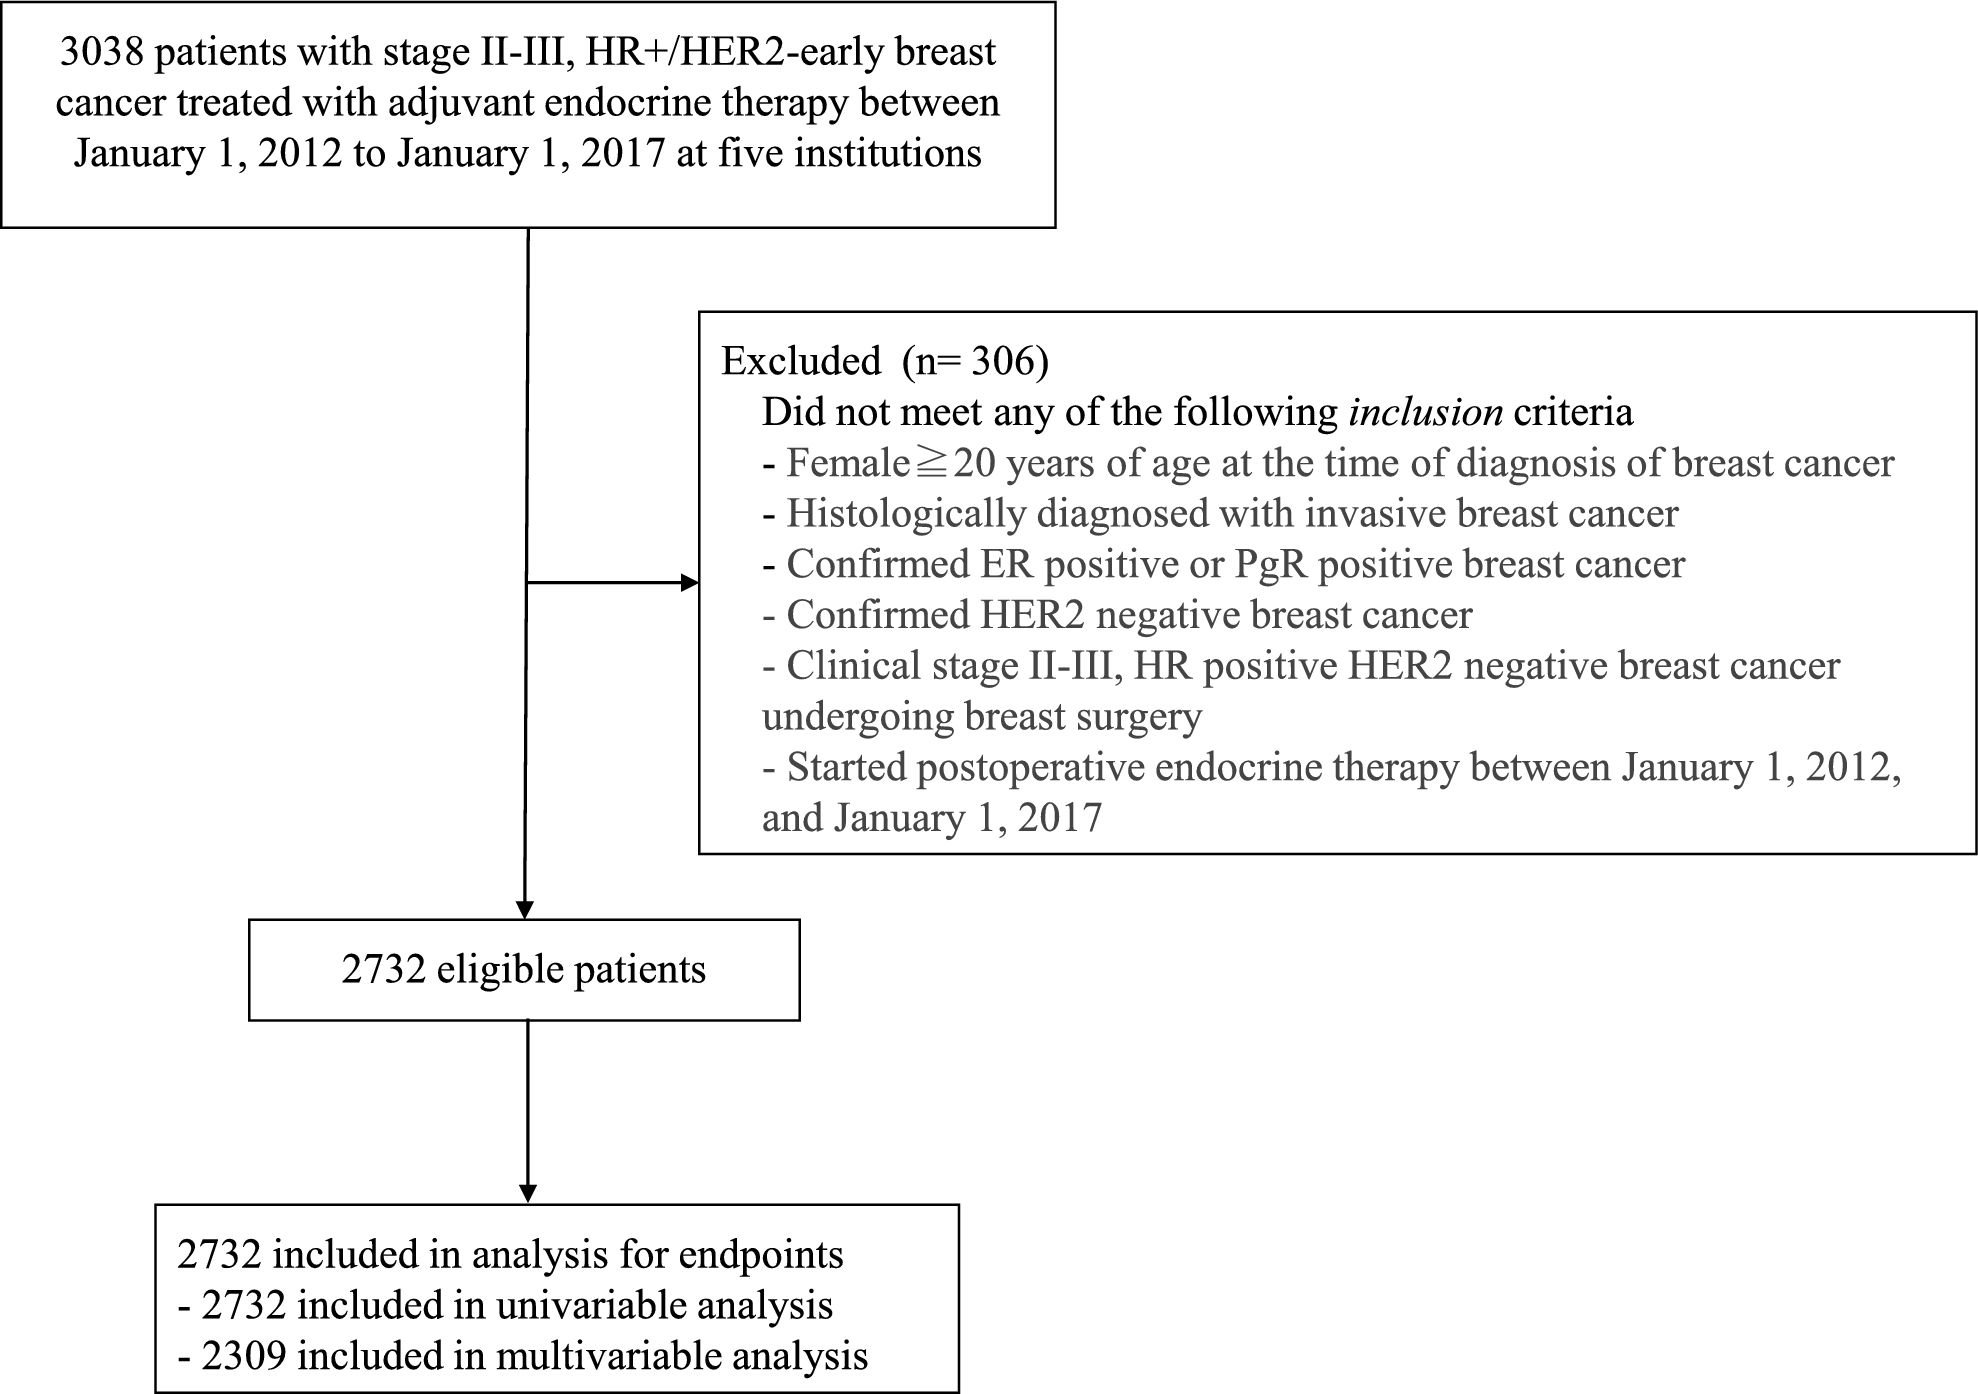
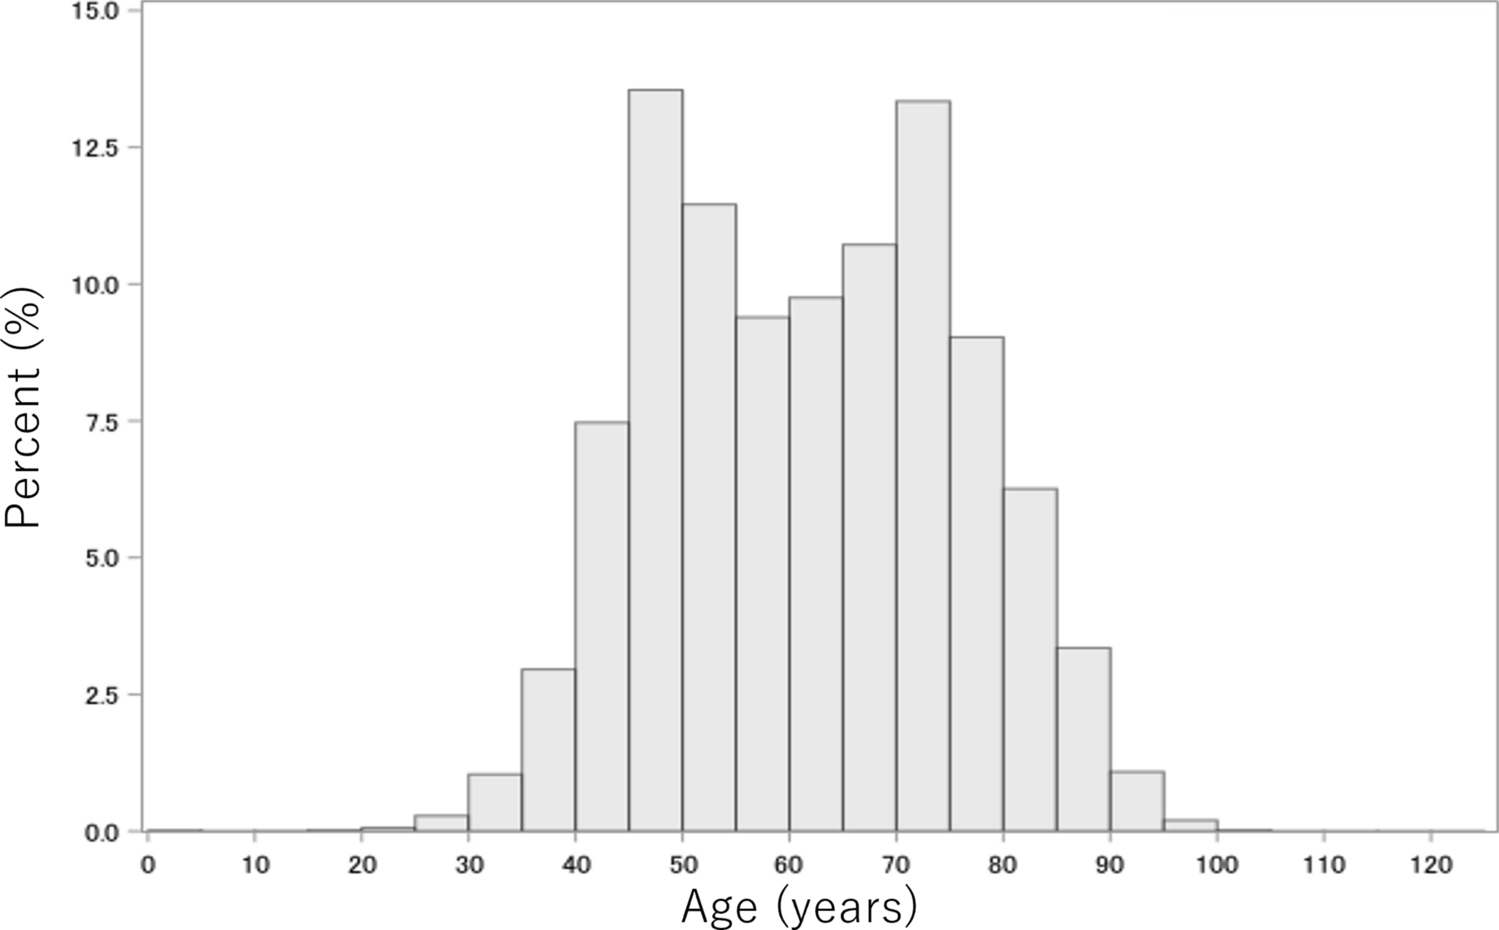
A flow diagram for patient selection is shown in Fig. 1. The total number of eligible patients for the final analysis was 2732. Baseline characteristics of the study population are presented in Table 1. The median age was 51 years (range 23–96), 51.5% of patients were premenopausal, and 42 patients (1.5%) had bilateral breast cancer. Clinicopathological characteristics of the eligible patients are shown in Table 2. A total of 1841 patients (67.4%) had clinical stage IIA cancer, 529 (19.4%) had stage IIB cancer, and 362 (13.3%) had stage III cancer. Missing values for histological grade were frequent. Of all patients, 1041 patients (38.1%) were found to have nuclear Grade 1 disease, 1039 patients (38.0%) had Grade 2, 456 patients (16.7%) had Grade 3, and 196 patients (7.2%) were of unknown grade. Lymphatic invasion was present in 1166 patients (42.7%) and vascular invasion in 284 (10.4%) patients. The number of pathological lymph node metastases was as follows: 1317 patients (48.2%) had none, 995 (36.4%) had 1–3, 280 (10.2%) had 4–9, and 124 (4.5%) had > 10.
Neoadjuvant chemotherapy was administered in 628 patients (23.0%) and adjuvant chemotherapy in 887 (32.5%) patients. Among these patients, most received anthracyclines or taxanes (Table 3b). Of 737 patients who received preoperative systemic therapy, 154 (20.9%) and 50 (6.8%) patients had a pathological therapeutic response of Grade 2and Grade 3, respectively (Table 2). Adjuvant endocrine therapy was administered to all patients, and 1120 (41.0%) received it for > 5 years. Details of surgical procedures and radiotherapy are shown in Table 3a.
Table 3 Treatment detailsInvasive disease-free survivalThe median follow-up period was 7.1 years. At the time of data cutoff, a total of 479 IDFS events were observed. The 3-year was 92.1% and the 5-year IDFS rate was 87.0% (Fig. 2a). Univariable analysis revealed that age (40–69 vs. 20–39 years: HR 0.59, 95% CI 0.46–0.77, p < 0.001), Ki-67 (≥ 30% vs. ≤ 14%: HR 1.90, 95% CI 1.37–2.65, p < 0.001), nuclear grade (Grade 2 vs. Grade 1: HR 1.84, 95% CI 1.47–2.30, p < 0.001; Grade 3 vs. Grade 1: HR 1.87, 95% CI 1.43–2.45, p < 0.001), lymphatic invasion (Yes vs. No: HR 1.67, 95% CI 1.40–2.00, p < 0.001), vascular invasion (Yes vs. No: HR 1.47, 95% CI 1.13–1.90, p = 0.003), pathological invasive tumor size (2–5 cm vs. < 2 cm: HR 1.69, 95% CI 1.31–2.15, p < 0.001; ≥ 5 cm vs. < 2 cm: HR 3.14, 95% CI 2.33–4.23, p < 0.001), number of pathological metastatic lymph nodes (1–3 vs.0: HR 1.44, 95% CI 1.16–1.78, p < 0.001; ≥ 4 vs.0: HR 2.89, 95% CI 2.29–3.62, p < 0.001), presence of NAC (Yes vs. No: HR 2.06, 95% CI 1.71–2.48, p < 0.001), and pathological therapeutic response (Grade 3 vs. Grade 0: HR 0.20, 95% CI 0.07–0.54, p = 0.002) were significant prognostic factors for 3-year IDFS rate (Supplementary Table 1a). There was no significant difference in 3-year IDFS rate between postmenopausal (92.8%) and premenopausal (91.5%) women (HR 1.130, 95% CI 0.944–1.352; p = 0.1827). The 3-year IDFS rates were 85.6%, 93.1%, and 91.6% for patients aged 20–39, 40–69, and ≥ 70 years, respectively, with a significantly worse prognosis in younger age group (40–69 vs. 20–39 years: HR 0.59, 95% CI 0.46–0.77; p < 0.001).
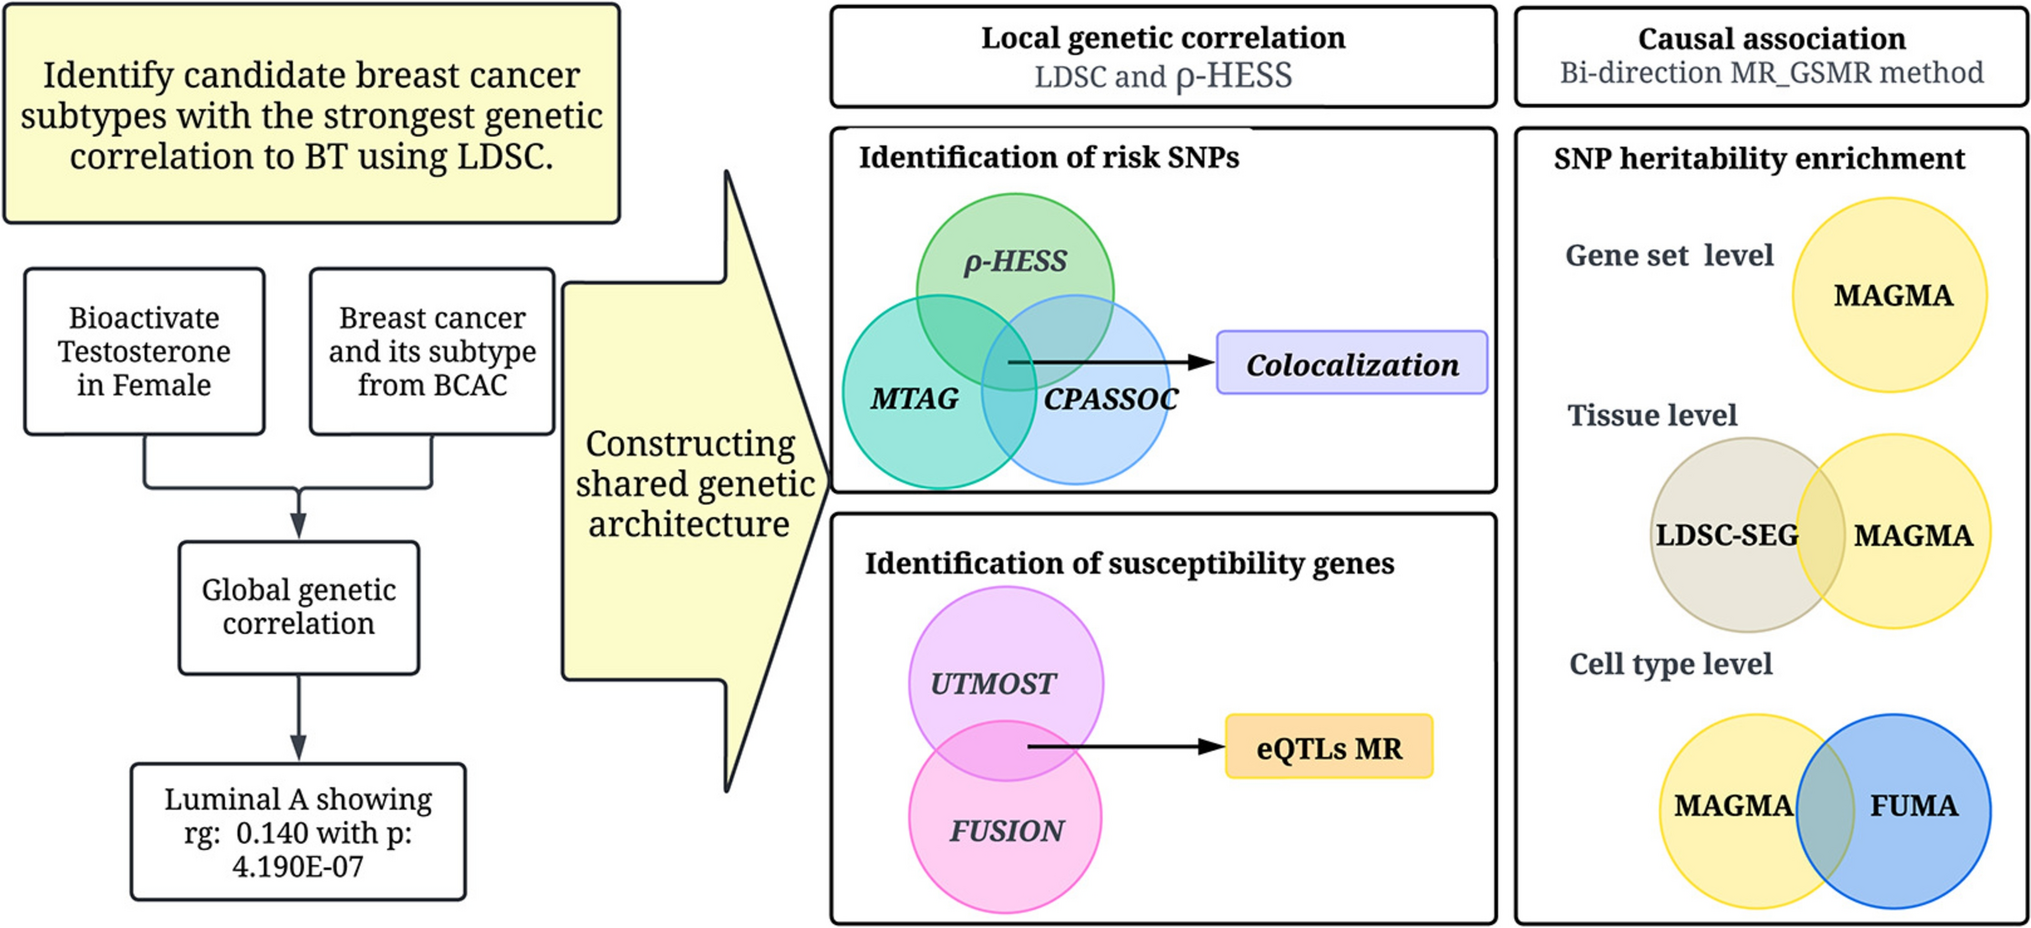
Fig. 2
a Kaplan–Meier curve for IDFS, b Kaplan–Meier curve for DRFS, c Kaplan–Meier curve for OS. IDFS invasive disease-free survival, DRFS distant recurrence free survival, OS overall survival
Multivariable analysis was performed on the 2309 patients for whom all explanatory variables were obtained. Results of the multivariable analysis are shown in Table 4. Factors ultimately selected for the model in the multivariable analysis were age (40–69 vs. 20–39 years: HR 0.69, 95% CI 0.51–0.92, p = 0.011), nuclear grade (Grade 2 vs. Grade 1: HR 1.66, 95% CI 1.31–2.11, p < 0.001; Grade 3 vs. Grade 1: HR 1.64, 95% CI 1.24–2.19, p < 0.001), vascular invasion (Yes vs. No: HR 1.36, 95% CI 1.04–1.78, p = 0.027), pathological invasive tumor size (2–5 cm vs. < 2 cm: HR 1.75, 95% CI 1.35–2.27, p < 0.001; ≥ 5 cm vs. < 2 cm: HR 2.07, 95% CI 1.48–2.89, p < 0.001), number of pathological metastatic lymph nodes (≥ 4 vs.0: HR 1.70, 95% CI 1.29–2.24, p < 0.001), and presence of NAC (Yes vs. No: HR 2.41, 95% CI 1.90–3.06, p < 0.001).
Table 4 Prognostic factors for IDFS in the multivariable analysisAdditional exploratory univariable and multivariable analyses were performed for a population of patients who did not receive NAC (Supplementary Table 1b, 1c). Multivariable analysis for IDFS in a population of patients without NAC (n = 1994) showed that nuclear glade (Grade 2 vs. Grade 1: HR 1.61, 95% CI 1.23–2.10, p < 0.001; Grade 3 vs. Grade 1: HR 1.59, 95% CI 1.14–2.23, p < 0.001)), lymphatic invasion (Yes vs. No: HR 1.32, 95% CI 1.00–1.74, p = 0.047), pathological invasive tumor size (2–5 cm vs. < 2 cm: HR 1.66, 95% CI 1.23–2.25, p = 0.001; ≥ 5 cm vs. < 2 cm: HR 2.01, 95% CI 1.31–3.06, p = 0.001), number of pathological metastatic lymph nodes (≥ 4 vs.0: HR 1.66, 95% CI 1.18–2.35, p = 0.004) were significant prognostic factors.
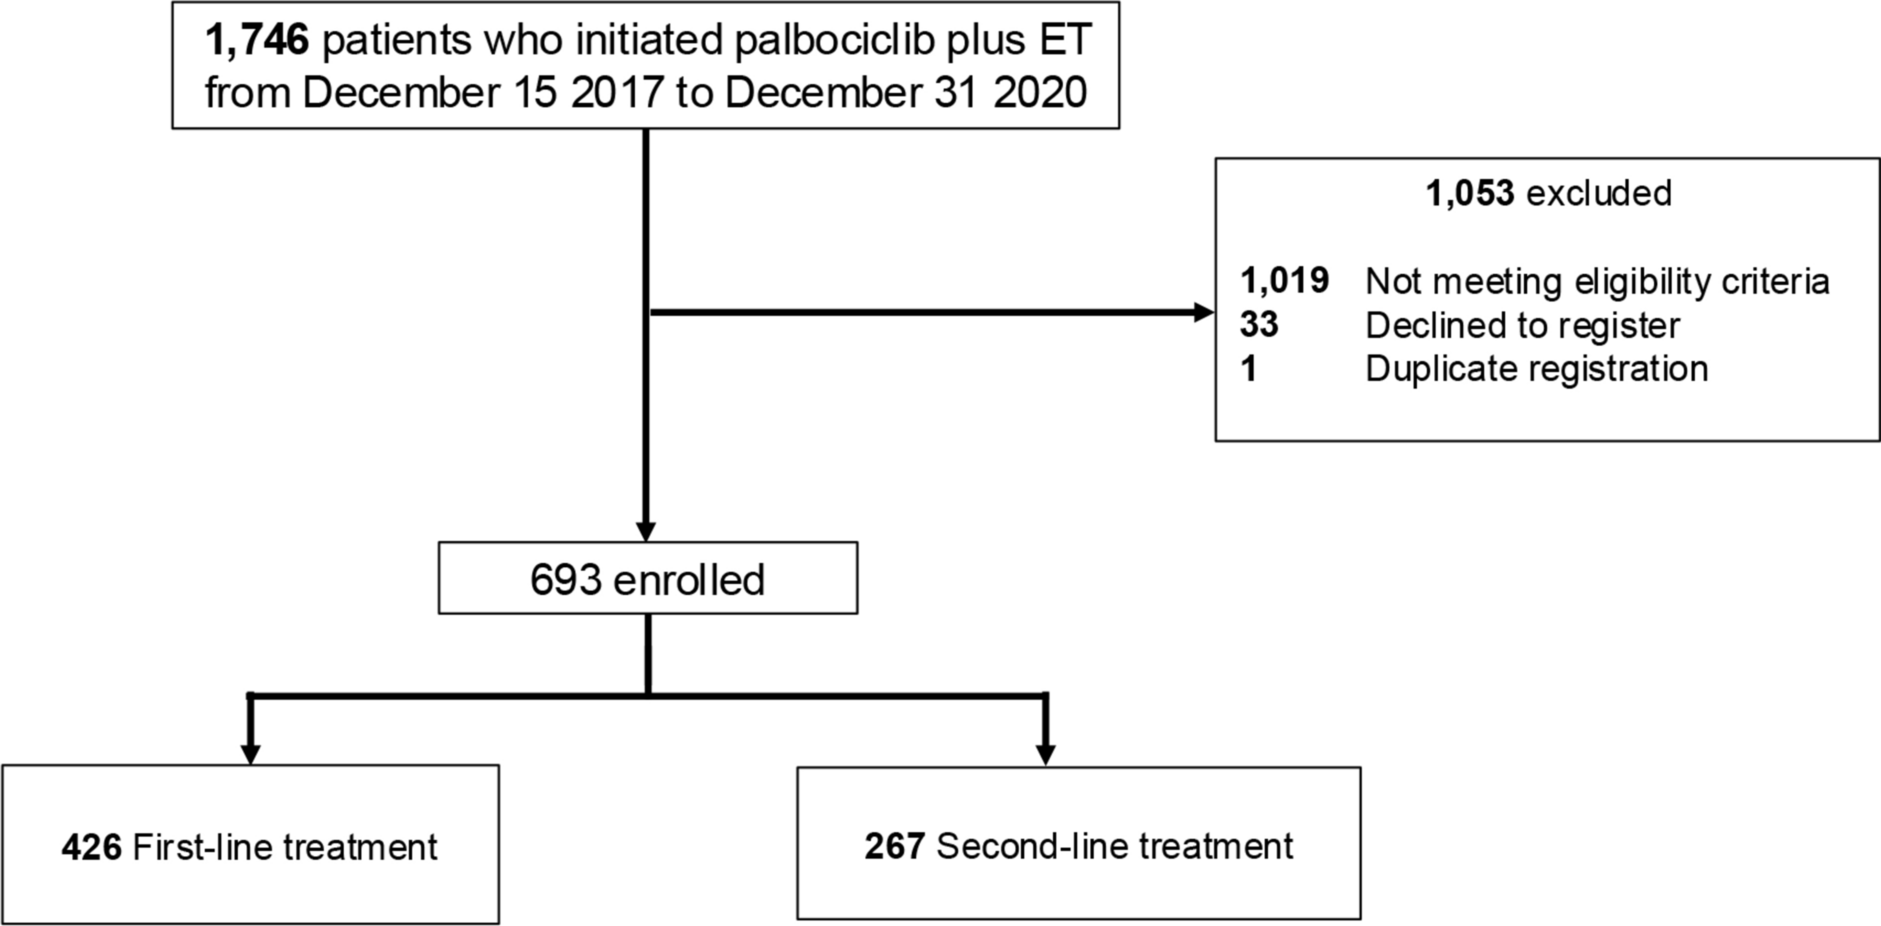
A nomogram was generated to predict 3-year and 5-year IDFS rates using selected factors from the multivariable analysis (Fig. 3a). Based on total points calculated from the nomogram, curves for IDFS stratified by score were generated and evaluated by the log-rank test and Cox’s proportional hazards model (Fig. 3b). To test the discriminative ability of the model, we calculated the C-index, which was 0.68. In addition, risk classification was performed so that each group had an equal number of patients with respect to the total points calculated from the nomogram. Calibration plots were generated for the predicted and observed IDFS rates to assess how well the scores explained the outcomes (Fig. 3c and d). For the internal validation, we randomly split the 2309 patients included in the multivariable analysis into training cohort and validation cohort at a 6:4 ratio, and multivariable Cox proportional hazard models with the same algorithm were performed. C-index was not different between training cohort (0.69 [95% CI 0.65–0.72]) and validation cohort (0.68 [95% CI 0.64–0.73]).
Fig. 3
a Nomogram predicting 3-year IDFS rate and 5-year IDFS rate.Draw a straight line from each applicable clinical factor to the Points axis. Sum these points, locate this number on the Total points axis, and draw a straight line down to find the patient's IDFS. b Curve for IDFS at each point (50> , 50–150>, 150–200>, ≥ 200) based on total points calculated from the nomogram. c Calibration plot for predicted and observed 3-year IDFS. d Calibration plot for predicted and observed 5-year IDFS. The figure shows the predicted IDFS on the x-axis and the actual IDFS on the y-axis. The blue line represents the prediction by nomogram. The vertical line shows the 95% confidence interval. If this blue line is close to the diagonal of Y = X, the predictive performance is considered high. VI vascular invasion, LN lymph nodes, NAC neoadjuvant chemotherapy, IDFS invasive disease-free survival
Distant recurrence free survivalThe 3-year and 5-year DRFS rates were 94.2% and 90.2%, respectively (Fig. 2b). Univariable analysis for DRFS revealed that age, Ki-67, nuclear grade, lymphatic invasion, vascular invasion, pathological invasive tumor size, pathological number of metastatic lymph nodes, NAC, and pathological therapeutic response were significantly associated factors (Supplementary Table 2). As in the multivariable analysis for DRFS, the model including all covariates was followed by the stepwise method.
Nuclear grade (Grade 2 vs. Grade 1: HR 1.94, 95% CI 1.46–2.60, p < 0.001; Grade 3 vs. Grade 1: HR 1.87, 95% CI 1.33–2.64, p < 0.001), pathological invasive tumor size (2–5 cm vs. < 2 cm: HR 2.34, 95% CI 1.66–3.30, p < 0.001; ≥ 5 cm vs. < 2 cm: HR 3.05, 95% CI 2.03–4.57, p < 0.001), number of pathological metastatic lymph nodes (1–3 vs.0: HR 1.68, 95% CI 1.26–2.24, p < 0.001; ≥ 4 vs.0: HR 2.70, 95% CI 1.95–3.74, p < 0.001), and NAC (Yes vs. No: HR 2.67, 95% CI 2.04–3.48, p < 0.001) were significant prognostic factors (Table 5).
Table 5 Prognostic factors for DRFS in the multivariable analysisOverall survivalThe 3-year and 5-year OS rates were 98.4% and 96.0%, respectively (Fig. 2c). Univariable analysis for OS revealed that age, menopausal status, bilateral breast cancer, Ki-67, nuclear grade, lymphatic invasion, pathological invasive tumor size, number of pathological metastatic lymph nodes, NAC, and pathological therapeutic response were significant prognostic factors (Supplementary Table 3). Significant prognostic factors for OS, as assessed by multivariable analysis using the stepwise method, were menopausal status (postmenopausal vs. premenopausal: HR 1.71, 95% CI 1.14–2.58, p = 0.010), bilateral breast cancer (Yes vs. No: HR 2.72, 95% CI 1.26–5.87, p = 0.011), nuclear grade (Grade 2 vs. Grade 1: HR 2.07, 95% CI 1.35–3.17, p < 0.001; Grade 3 vs. Grade 1: HR 2.17, 95% CI 1.34–3.52, p = 0.002), pathological invasive tumor size (2–5 cm vs. < 2 cm: HR 2.66, 95% CI 1.60–4.44, p < 0.001; ≥ 5 cm vs. < 2 cm: HR 3.20, 95% CI 1.78–5.77, p < 0.001), number of pathological metastatic lymph nodes (1–3 vs.0: HR 1.80, 95% CI 1.20–2.70, p = 0.004; ≥ 4 vs.0: HR 2.34, 95% CI 1.51–3.90, p < 0.001), and NAC (Yes vs. No: HR 3.66, 95% CI 2.55–5.26, p < 0.001) (Table 6).
Table 6 Prognostic factors for OS in the multivariable analysisCumulative recurrence ratesThe 3-year and 5-year cumulative recurrence rates (local and distant recurrence) were 6.8% and 11.1%, respectively (Supplementary Fig. 1a). Univariable analysis was performed to explore prognostic factors for the cumulative recurrence rate. Age, Ki-67, nuclear grade, lymphatic invasion, vascular invasion, pathological invasive tumor size, number of pathological metastatic lymph nodes, presence of NAC, and pathological therapeutic response were significant factors (Supplementary Table 4a). Significant prognostic factors for the cumulative recurrence rate in the multivariable analysis with the model including all covariates were age (40–69 vs. 20–39 years: HR 0.63, 95% CI 0.45–0.88, p = 0.008), nuclear grade (Grade 2 vs. Grade 1: HR 1.95, 95% CI 1.45–2.61, p < 0.001; Grade 3 vs. Grade 1: HR 1.83, 95% CI 1.28–2.62, p < 0.001), lymphatic invasion (Yes vs. No: HR 1.52, 95% CI 1.14–2.02, p = 0.004), pathological invasive tumor size (2–5 cm vs. < 2 cm: HR 2.06, 95% CI 1.50–2.83, p < 0.001; ≥ 5 cm vs. < 2 cm: HR 2.39, 95% CI 1.60–3.56, p < 0.001), number of pathological metastatic lymph nodes (≥ 4 vs.0: HR 1.76, 95% CI 1.23–2.51, p = 0.002), and NAC (Yes vs. No: HR 2.35, 95% CI 1.76–3.14, p < 0.001) (Supplementary Table 4b).
Cumulative distant metastasis ratesThe 3-year and 5-year cumulative distant metastasis rates were 5.3% and 8.8%, respectively (Supplementary Fig. 1b). The results of univariable analysis and multivariable analysis are shown in Supplementary Tables 5a and 5b.
Patient background and survival outcomes in the patient population meeting the eligibility criteria for the monarchE trialWe examined the clinicopathological characteristics and IDFS rate of subgroups that met the Cohort 1 and Cohort 2 criteria of the monarchE trial [3]. Histological grade was substituted for nuclear grade and defined as follows for Cohort 1 and Cohort 2: Cohort 1, patients with either (1) ≥ 4 lymph nodes or (2) 1–3 lymph nodes and tumor size ≥ 5 cm or nuclear Grade 3; Cohort 2, patients with 1–3 lymph nodes, tumor size < 5 cm, nuclear Grade 1 or 2, and Ki-67 ≥ 20%. Clinicopathological characteristics and treatment details for the subgroups are shown in Supplementary Tables 6–8. Kaplan–Meier curves for IDFS in the same population are shown in Supplementary Figs. 1a-1c. The 3-year and 5-year IDFS rates were 85.6% and 77.2%, respectively, in the present study population that corresponded to the intention to treat population of the monarchE trial.
Comments (0)