
Remember me


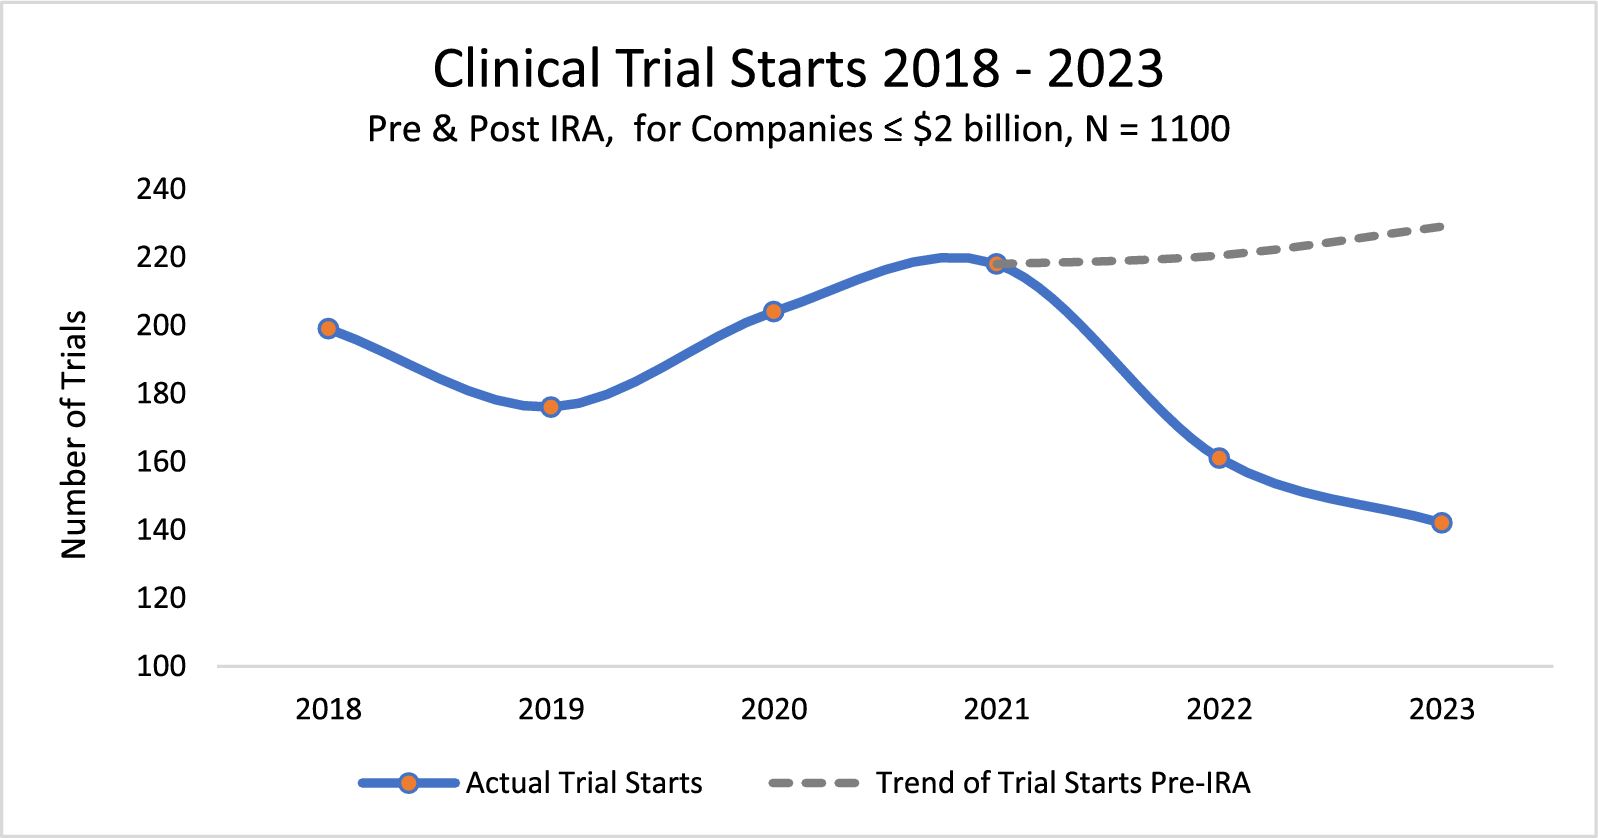

Figure 1 shows the evolution in all clinical trial launches by our cohort of companies between 2018 and 2023, which reveals a 35% decline in clinical trial starts after the introduction of the IRA on September 27, 2021. A regression test for the difference in the mean value of monthly clinical trial starts in the years before and after the introduction of the IRA indicates a statistically significant difference (p ≤ 0.0179). This result was also duplicated by recently published research by the National Pharmaceutical Council [13].
Figure 1
Number of clinical trials launched between 2018 and 2023 shows a statistically significant (p ≤ 0.0179) decline when calculated at the mean. Graph shows a 35% decline after the introduction of the IRA on September 27th, 2021. Data cohort is 1,100 phase I and II clinical trials extracted from BioMedTracker for companies ≤ $2 billion valuation.
Impacts on Investor Behavior – Size of InvestmentsTo detect any change in investor behavior by small or large molecule modality due to the introduction of the IRA, the following analysis focuses on our data that links all investments made between January 1, 2018, through August 16, 2024, specifically to the development of lead assets.
Figure 2 shows total investments into our cohort of 161 lead assets from January 1, 2018, through June 30, 2024, segmented by large and small molecules. As evident in Fig. 2, aggregate investments in large molecule assets underwent a significant decline starting in 2021, coinciding with the passage of the IRA, but thereafter rose substantially, with aggregate large molecule investments being 10 times larger at $6.5 billion than those of small molecules totaling $640 million as of June of 2024.
Figure 2
Graph showing shift in early-stage (phase I and II) investments into small and large molecule lead assets. Data for U.S. companies with a market value ≤ $2 billion, values in 2024 constant dollars, 1/1/2018 – 6/30/2024.
Conversely, Fig. 2 shows that aggregate investments in small molecules declined 68% since their peak before the introduction of the IRA, from $2 billion to $640 million, also demonstrating a marked decrease in total lead asset investments into small versus large molecules.
Figure 3 provides further evidence of the decline in small molecule investments by showing the distribution of the size of investments into small molecules for the periods before and after the introduction of the IRA. Based on these data, a Kruskal–Wallis test indicates a statistically significant difference (p ≤ 0.0099) in the median size of small molecule investments, affirming their decline after IRA’s introduction observed in Fig. 2.
Figure 3
Dot plots show distributions, before and after IRA’s introduction, of the size of early stage (phase I and II) investments into small molecule lead assets. Data are for 1/1/2018 – 8/16/2024 on U.S. companies with a market value ≤ $2 billion, investment values in 2024 constant dollars.
For large molecules, the Kruskal–Wallis test indicates a statistically significant decline (p ≤ 0.0013) in the median size of large molecule investments before and after the introduction of IRA (Fig. 4). The previously observed increase in total investments in large molecules (Fig. 2) is due to three large post-IRA investments, each over $1 billion. The Medicare exposure for IRA price setting for these investment outliers is near or below our median of 59% as calculated by the indication prevalence for those over 65 years of age in our cohort. They are HER2 + Breast Cancer with 50% exposure, alpha-1 antitrypsin deficiency (dAATD) with 27% exposure, and kidney transplant rejection with 60% exposure [14].
Figure 4
Dot plots show distributions before and after the introduction of the IRA on the size of early stage (phase I and II) investments into 327 large molecule lead assets. Data are for 1/1/2018 – 8/16/2024 on U.S. companies with a market value ≤ $2 billion, investment values in 2024 constant dollars. Investment outliers are circled.
Impacts on Investor Behavior – Exposure to the Medicare-aged PopulationTo further assess the evolution of early-stage investor behavior regarding lead assets, we examined investments in relation to their exposure to the Medicare-aged population. Specifically, we filtered our 161 lead assets to select only those indications whose exposure to the population over 65 years of age exceeded the median indication prevalence value of 59% across our cohort. Within this sub-sample, the median size of the 244 individual investments into these lead assets shows a statistically significant (p ≤ 0.008) decline of 51% after IRA’s introduction (see Data and Statistical Appendix). Aggregated over indications, the second to last row of Table 3 indicates a 74% decline ($175 mil to $45 mil) in the median size of investments after IRA’s introduction.
Table 3 Indications in our cohort above the median of 59% of Medicare exposure for those over 65 years of age as calculated by indication prevalence for U.SBy segmenting the size of investments into lead assets by high and low Medicare exposure before and after the introduction of the IRA, we can determine if the IRA impacted the decisions of early-stage investors by molecule type and risk of price setting. For small molecule investments, Fig. 5 shows that, after IRA’s introduction, there was a relative increase in investments that target indications below the median value (59%) of exposure to the Medicare-aged population.
Figure 5
Shifts in early-stage (phase I and II) investments for small and large (Biologic) molecule lead assets above and below the median (59%) exposure by indication prevalence for those 65 years of age or older before and after introduction of the IRA. Data for U.S. companies with a market value ≤ $2 billion, values in 2024 constant dollars, 1/1/2020 – 6/30/2024.
Regressing the natural logarithm (ln) of the size of investments from 1/1/2018 through 8/16/2024, we find that the size of small molecule investments above the median exposure to the Medicare-aged population (n = 99) show a statistically significant decline after the introduction of the IRA (p ≤ 0.0488). Conversely, for small molecules below the median of exposure to the Medicare-aged population (n = 193) we find no significant change in the size of investments after the introduction of the IRA (p ≤ 0.1748).
Similar testing for large molecules showed the median size of investments by high (n = 153, p ≤ 0.023) or low (n = 174, p ≤ 0.0313) exposure to the Medicare-aged population declined before and after the IRA’s introduction – exposure for large molecules to price setting for indications targeting the Medicare aged population at year 13 due to the IRA did not alter the median size of investments.
When comparing the median size of investments into small and large molecules with a high exposure to the Medicare-aged population before and after IRA’s introduction, we find that the median size of investments for small molecules (n = 99) declined by roughly 7% more than the investments made into large molecules (n = 153). This decline in the median size of investments was further investigated for significance by regressing the natural log of investments in the sample of indications with above the median Medicare exposure on a dummy variable for before and after IRA, and for large and small molecules. The results indicated a greater rate of the decline in the investment size of small molecules compared to those into large molecules after IRA’s introduction (p ≤ 0.0002) (see Data and Statistical Appendix).
To test the impact of increasing an indication’s exposure to the Medicare-aged population on the size of small molecule investments, we modeled the natural log of investments as a function of an indication’s exposure to the Medicare-aged population, and a dummy variable for investments made pre- and post-IRA’s introduction. The results of this model indicated a statistically significant negative relationship for investments into small molecules as exposure to the Medicare-aged population increases. Investments decline by 57% after IRA’s introduction as exposure to the Medicare population increases above the median of 59% (p ≤ 0.0018) (Fig. 6).
Figure 6
Estimated multiple regression model of the relationship between small molecule investments and exposure to Medicare-aged population above the median (≥ 63%) and time periods pre—and post the introduction of the IRA. Data for 1/1/2018 – 8/16/2024 on U.S. companies ≤ $2billion valuation. Investments for phase I and II measured in 2024 constant dollars at the natural log (n = 77).
If the observed impact on small molecule investments is due to the general post-pandemic economic environment and not the IRA, as stated in the October 27, 2024, letter from Phillip L. Swagel, Director of the CBO [15], we would expect to observe similar results in large molecules. However, in multiple statistical tests of the median and the natural log of large molecule investments by an indication’s exposure to the Medicare-aged population and a dummy variable for investments made pre- and post-IRA, the results showed no statistically significant difference in the median of large molecule investments before and after the IRA's implementation.
In addition, the median frequency of an investment’s large molecule exposure to the Medicare-aged population is virtually unchanged before and after the introduction of the IRA at 59.6% and 59% respectively. We interpret these results to mean that, post-IRA, investors perceive large molecules to be a lower investment risk than small molecules.
Comments (0)