Animals and grouping
5xFAD mice (Strain No. #034848-JAX) and C57BL/6J female mice (Strain No. N000013) were obtained from GemPharmatech (Nanjing, China). Male heterozygous 5xFAD mice were crossed with the wild type (WT) C57BL/6J female mice to produce the heterozygotes 5xFAD offspring and their WT littermates. The primers used for genotyping were as follows: common-forward primer 5’-ACCCCCATGTCAGAGTTCCT-3’, common-reverse primer 5’-ACCCCCATGTCAGAGTTCCT-3’, and mut-reverse primer 5’-ACCCCCATGTCAGAGTTCCT-3’.
All mice were housed in the Centralized Animal Facility at the Hong Kong Polytechnic University Shenzhen Research Institute, where they received humane care. They were maintained in specific-pathogen-free conditions with a 12-h light–dark cycle and had unrestricted access to standard rodent food and water. This study included four groups: a wild-type normal control group with vehicle treatment (NC-V), 5xFAD mice treated with a vehicle (5xFAD-V), and 5xFAD mice receiving low (2 g/kg) and high (4 g/kg) doses of HLJD, referred to as 5xFAD-HLJD-L and 5xFAD-HLJD-H, respectively. HLJD was given daily by oral gavage starting at three months of age and continued for seven months.
Preparation of HLJD decoction
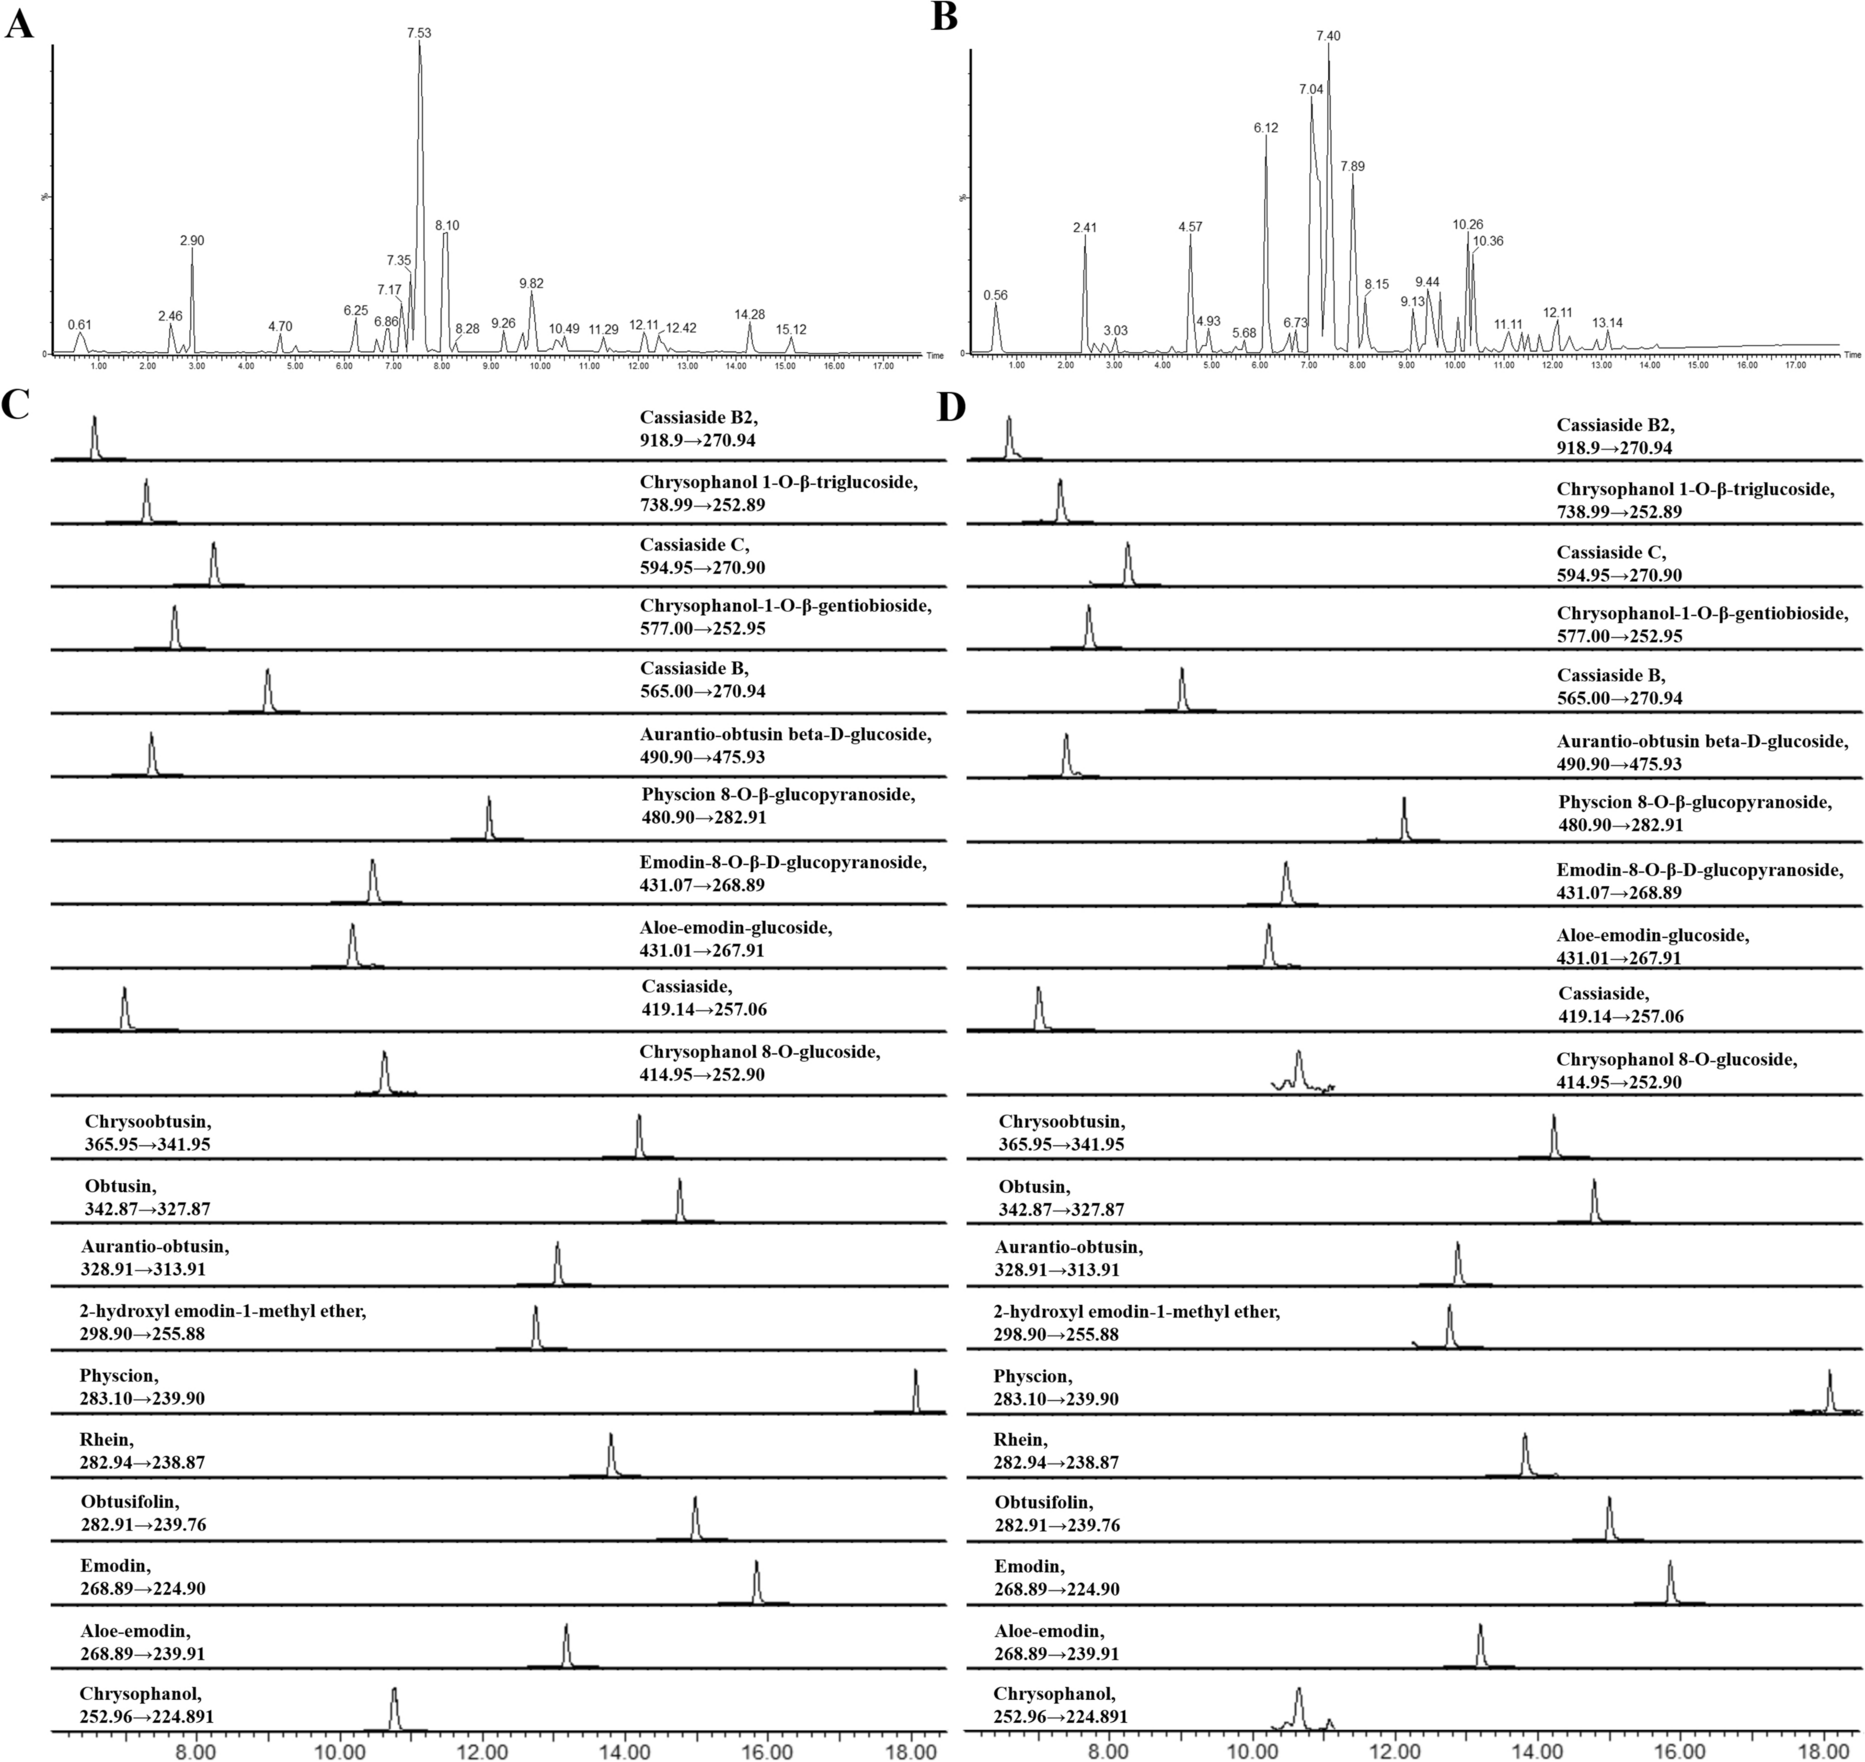
Coptis chinensis Franch. (specimen number:190601QF), Scutellaria baicalensis Georgi. (specimen number:200101QF), Phellodendron chinense Schneid. (specimen number:191001QF), and Gardenia jasminoides Ellis. (specimen number:190901QF) were purchased from Henan Qianfang Pharmaceutical Industry Company (China). The HLJD decoction extract was prepared according to the method described in a previous study. Briefly, the mixture of the four herbs was boiled twice with distilled water in two stages, using ratios of 1:10 (w/v) and 1:8 (w/v). The resulting filtrates were combined and concentrated using a rotary evaporator at 60 °C, followed by freeze-drying in a vacuum freeze dryer. The main components of the HLJD decoction extracts were analyzed using Ultra-Performance Liquid Chromatography Quadrupole-Time-of-Flight Mass Spectrometry (UPLC-Q-ToF-HRMS), as shown in our previous study, in which 22 components were identified [20].
Morris water maze (MWM) test
The MWM was conducted according to the methodology outlined in a previous study [25]. On the first day, all mice were allowed to navigate the maze, which contained a visible platform to help them acclimate to the testing environment and evaluate their swimming skills. From day 2 to day 5, a colorant was added to the water to make it opaque, concealing the platform. The mice were placed in each of the four quadrants: southwest (SW), northwest (NW), northeast (NE), and southeast (SE), and allowed to explore for 60 s in each quadrant. The primary parameter observed was the escape latency, defined as the time taken by the mice to locate the platform. On day 6, the platform was removed, and the mice were placed in the water from the quadrant opposite the target platform, allowing 60 s for exploration. The time spent in the target quadrant and the number of times the mice crossed the area where the platform had been were recorded and analyzed using Noldus software.
Collection of active components in HLJD and their potential targets
The active components of each herb in HLJD decoction were sourced from the the Traditional Chinese Medicine Systems Pharmacology Database and Analysis Platform (TCMSP) (https://old.tcmsp-e.com/tcmsp.php). A total of four herbs were analyzed, including Coptis chinensis Franch. (Chinese name: Huang-Lian, HL), Scutellaria baicalensis Georgi. (Chinese name: Huang-Qin, HQ), Phellodendron chinense Schneid. (Chinese name: Huang-Bo, HB), and Gardenia jasminoides Ellis. (Chinese name: Zhi-Zi, ZZ). The active components were selected based on the criteria of oral bioavailability (OB) ≥ 30% and drug-likeness (DL) ≥ 0.18. The SMILES notation for each compound was confirmed in the PubChem database (https://pubchem.ncbi.nlm.nih.gov). The potential targets of these active components were predicted using the SwissTargetPrediction online tool (http://swisstargetprediction.ch) based on their SMILES notations.
Collection of AD targets and connections between HLJD and AD targets
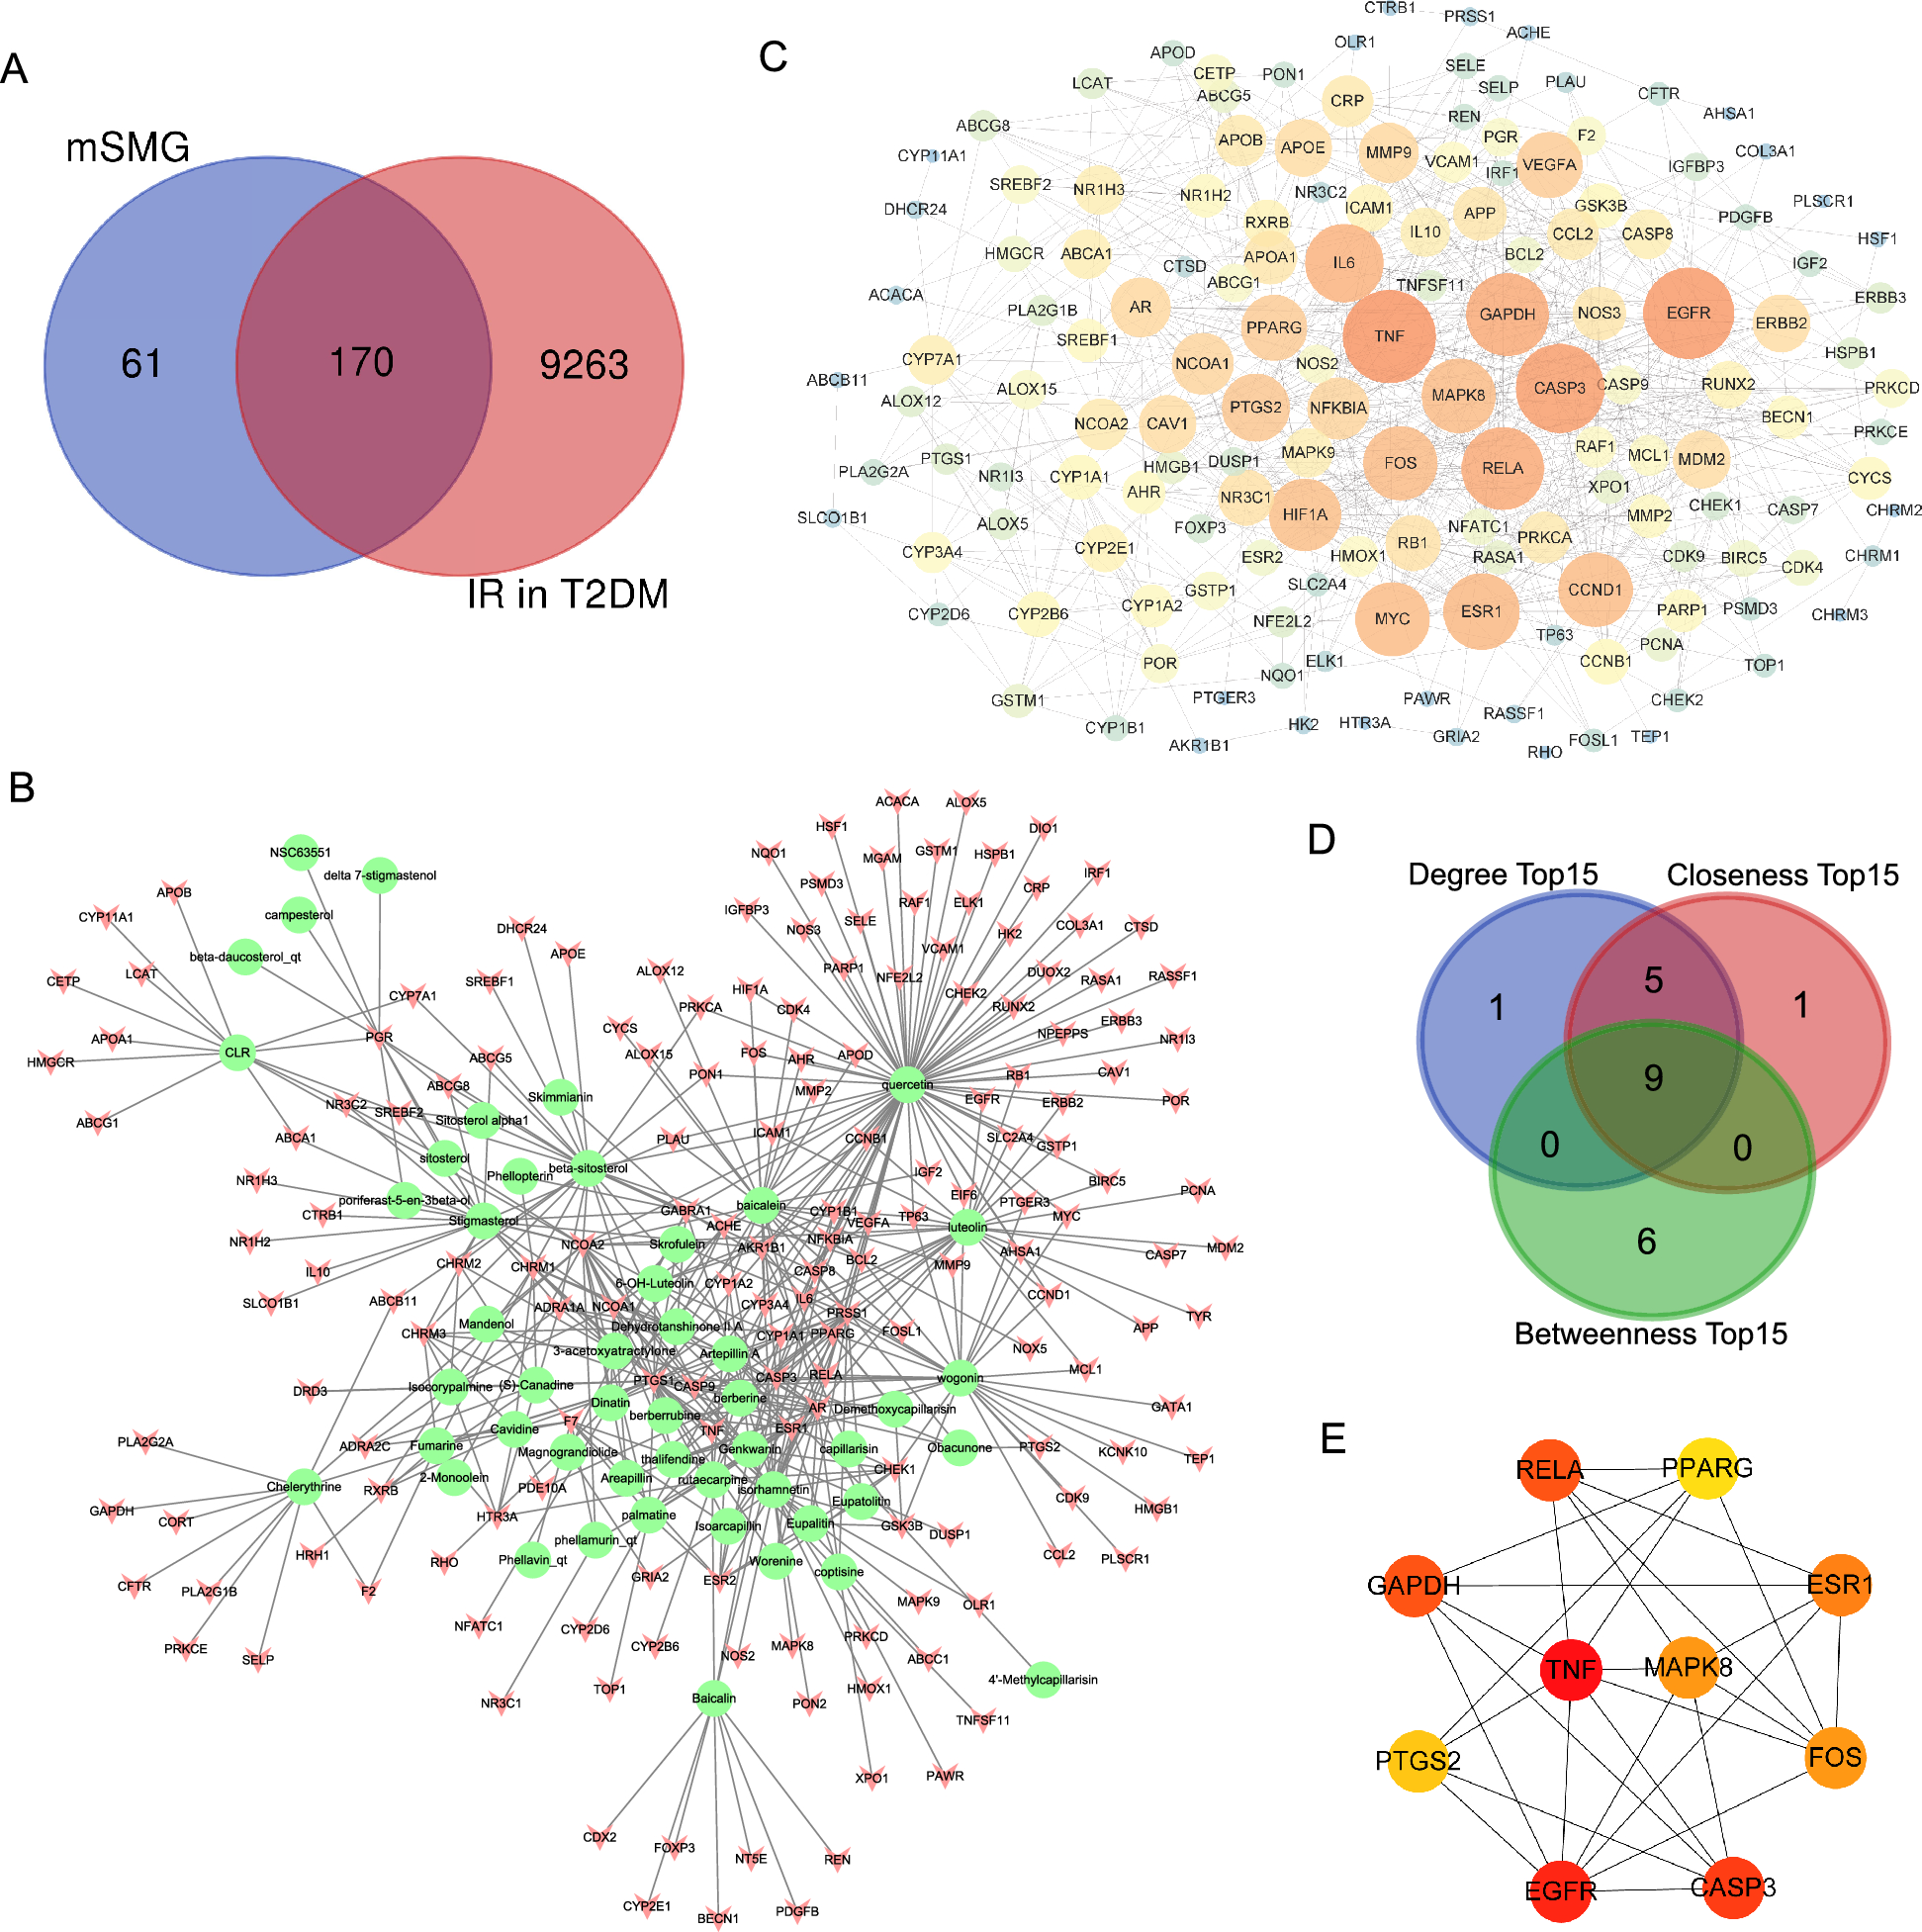
To identify genes associated with AD, the term “Alzheimer's disease” was searched in the GeneCards database (https://www.genecards.org/), and the OMIM database (https://www.omim.org). A cutoff relevance score of > 5 was used as the selection criterion for the gene list extracted from GeneCards. The potential targets of HLJD and AD were copied into the Venny 2.1.0 (https://bioinfogp.cnb.csic.es/tools/venny/) to identify overlapping genes between HLJD and AD, resulting in the creation of a Venny diagram. The network connections among the four HLJD herbs, their active components, interesting genes, and AD were established using Cytoscape 3.10.2.
Protein–protein interaction (PPI) enrichment analysis
The PPI enrichment analysis for those overlapping genes between HLJD and AD were conducted using Metascape (https://metascape.org/gp/index.html#/main/step1). This enrichment analysis was carried out using the following databases: STRING, BioGrid, OmniPath, InWeb_IM. However, only physical interactions in STRING (physical score > 0.132) and BioGrid are used. The Molecular Complex Detection (MCODE) algorithm has been applied to identify densely connected network components. Pathway and process enrichment analysis were applied to each MCODE component independently, and the three best-scoring terms have been retained as the functional description of the corresponding components in Supplementary Table S1.
GO and KEGG pathway analysis
The significant targets of HLJD and AD identified through network pharmacology were further investigated to explore the potential pathways associated with both the drug and the disease. These targets were examined using the Metascape platform (https://metascape.org/gp/index.html) for the Gene Ontology (GO) and KEGG pathway analysis, with the biological species set to human. Subsequently, the resulting data files were imported to an online platform for data visualization and graphing (http://www.bioinformatics.com.cn/).
Immunofluorescence (IF)
After euthanasia, the mice were promptly perfused with PBS, followed by a 10% formalin solution. The brains were then extracted and fixed in 10% formalin at 4 °C for 48 h. Following fixation, the brains were dehydrated in 15% and 30% sucrose solutions in PBS at 4 °C until they sank. Then, the brains were embedded in Tissue-Tek O.C.T and stored at -80 °C until further use. Coronal sections of the brain, each 30 μm thick, were prepared using a cryostat (Leica, CM 1950, Germany), and the sections were kept in PBS at 4 °C. These sections were washed three times with PBST for 5 min each, followed by blocking step using a solution containing 5% normal donkey serum and 0.35% Triton X-100 in PBS for 2 h at room temperature (RT). After blocking, sections were incubated overnight at 4 °C with primary antibodies diluted in the blocking solution. Primary antibody details as shown below: Iba1 (Abcam, ab283319, UK, 1:500), Aβ42 (Novusbio, NBP2-44113, China,1:500), Tau (Cell Signaling Technology, #46687, USA, 1:200), IL-1β (Santa Cruz, sc-52012, USA,1:500), TNF-α (Genetex, GTX110520, USA,1:500), CD169 (Abcam, ab312840, UK, 1:250), Trem2 (Thermofisher, PA5-116068, USA, 1:500) and Dap12 (Santa Cruz, sc-166084, USA, 1:500). On the next day, the sections were washed three times with PBST for 10 min each and incubated with secondary antibodies for 2 h at RT. After three washes with PBST, each lasting 10 min, the sections were mounted using a mounting medium that included DAPI. All images were obtained with a Nikon AX confocal microscope and analyzed using ImageJ software.
Thioflavin S (ThS) Assay
The brain sections were immersed in a working solution of Thioflavin S (ThS) for 8 min at RT. Following this, the sections were dehydrated by soaking them three times in 80% and 95% ethanol, with each soak lasting 5 min. Finally, coverslips were applied with an aqueous mounting medium, and the slides were allowed to dry in the dark. ThS fluorescence signals were captured using a confocal microscope (Nikon AX) at a wavelength of 450 nm.
Quantitative real-time PCR (qPCR)
Total RNA was extracted using a total RNA isolation kit from Promega (R6834-02, USA). The cDNA was synthesized using the Takara RT Master Mix (RR036A, Japan), followed by quantitative PCR with Forget-Me-Not™ qPCR Master Mixes (Biotium, 31042, USA) on a CFX96 Touch™ Real-Time PCR system (Bio-Rad, 1855195, USA). The expression levels of Gapdh, Trem2, Dap12, Tnf-α, Il-1β, Il-6, Csf1, Csf1r, Il-12a, Nos2, Arg-1, CD206, Vegf, Il-10, Tgf-β1, Il-4, Il-13, Cxcl10, and Ccl3 were normalized to Gapdh. The sequences of the primers used are listed in Table 1.
Table 1 PCR primer sequencesWestern blot
The hippocampus (HIP) of the mouse brain was homogenized in RIPA buffer that included a cocktail of protease and phosphatase inhibitors. The homogenate was then centrifuged at 12,000 rpm for 15 min at 4 °C, and the supernatant was carefully harvested. Protein concentrations were measured using the BCA Protein Concentration Assay Kit (Beyotime Biological, Shanghai, China). Samples were heated at 100 °C for 10 min and separated by sodium dodecyl sulfate–polyacrylamide gel electrophoresis (SDS-PAGE). The proteins were transferred to polyvinylidene fluoride (PVDF) membranes and blocked with a 5% non-fat milk solution dissolved in TBST for one hour at RT. After blocking, the membranes were incubated with primary antibodies overnight at 4 °C, followed by washing with TBST. The membranes were then incubated with secondary antibodies in blocking buffer for one hour at RT. The specifications for the primary antibodies align with those described in the immunofluorescence protocol, while the β-Actin antibody was sourced from Santa Cruz (sc-47778). Membranes were visualized using electrochemiluminescence (ECL) (Tanon, Shanghai, China) and imaged with the Bio-Rad ChemiDoc™ imaging system (Bio-Rad, CA, USA).
ELISA assay
The levels of TNF-α, IL-1β, IL-6 in the HIP homogenate were measured using the following kits: the mouse TNF-α ELISA kit (Solarbio, cat# SEKM-0034, China), the mouse IL-1β ELISA kit (Solarbio, cat# SEKM-0002, China), and the IL-6 ELISA kit (Solarbio, cat# SEKM-0007, China). The levels of Aβ42 in the HIP homogenate were evaluated using a mouse Aβ42 ELISA kit (Elabscience, cat# E-EL-M3010, China). All experiments were conducted following the guidelines of the assay kits.
Primary microglia isolation and culture
The protocol for primary microglia isolation was conducted as previously described [26]. To extract primary microglial cells from mouse brains, the non-perfused brain was first chopped into small pieces and incubated in an enzymatic digestion mixture consisting of 10 mg Collagenase A (gibco, cat# 9001–12-1, USA), 70 µL DNase I (1000 U/mL, Solarbio, cat# 9001–12-1, USA), 50 µL HEPES (1 M, Servicebio, cat# G4532, China) and 1 × HBSS, bringing the total volume to 4.75 mL at 37 °C for 1 h. The enzymatic activity was neutralized by adding 250 µL of fetal bovine serum (FBS). The mixture was then centrifuged at 250 g for 5 min, and the supernatant was aspirated. The pellet was resuspended in serum-free DMEM-F12 media and gently pipetted up and down with pipette tips against the bottom of the tube until all large tissue clumps were broken down. The cell suspension was filtered through a 40 µm cell strainer, centrifuged at 250 g for 4 min, and resuspend in a 70% isotonic Percoll solution (SIP). Gradient centrifugation was performed using layers of 70%, 37%, 30% SIP and 1 × HBSS from the bottom to the top. After centrifugation at 300 g for 50 min, the interphase of 70% and 37% SIP was collected, diluted with 1xHBSS, and centrifuge at 500 g for 7 min. Finally, the pellet was resuspended in DMEM-F12 cell culture medium containing M-CSF (200 ng/mL) and seeded into a 24-well plate, where the cells were cultured for 7 days before passaging for further experiments. The primary microglia isolated from the brains of 5xFAD mice were treated with HLJD at a concentration of 50 μg/ml for 24 h to evaluate its effects on the Trem2/Dap12 signaling pathway.
Statistical analysis
Statistical analysis was conducted using Prism 9. Data are expressed as the mean ± standard error mean (SEM), with sample sizes indicated in the figure legends. Comparisons between two groups were performed using an unpaired Student’s t-test. For comparisons involving more than two groups, one-way ANOVA was applied, followed by Tukey’s post hoc test. Significance levels were defined as follows: *P < 0.05, **P < 0.01, ***P < 0.001, ****P < 0.0001.


Comments (0)