
Remember me


Five healthy subjects (4 males and 1 female) participated in the study. They were all moderately trained, performing endurance and/or resistance exercise 3–4 times per week. Their mean (± standard error (SE)) age was 25 (± 1) years, height 183 (± 3) cm, body mass 74 (± 5) kg and maximal oxygen uptake (VO2peak) 3.89 (± 0.36) l min− 1. All participants were fully informed about the experimental procedure and associated risks before giving their written consent. The study was approved by the Swedish Ethical Review Authority (2018/2186-31) and performed in accordance with the principles outlined in the Declaration of Helsinki.
Experimental designPreliminary testsThe preliminary exercise tests were performed on a mechanically braked cycle ergometer (Monark 828E, Vansbro, Sweden). One week before the experiment, the oxygen uptake of the subjects was determined at three submaximal work rates, along with their peak oxygen uptake (VO2peak) using an on-line system (Oxycon Pro, Jaeger, Hoechberg, Germany). The subjects exercised at a pedaling rate of 70 rpm. A work rate corresponding to approximately 70% of VO2peak was calculated from these measurements.
Exercise for glycogen reduction (day 1)A schematic overview of the experimental workflow is provided in Fig. 1. During the two days preceding the experiment, subjects were instructed to refrain from intensive exercise and keep a record of their dietary intake. The subjects came to the laboratory between 5 and 6 PM on the evening before the experiment. They performed one-legged cycling on a mechanically braked ergometer (Monark 828E) equipped with a custom-made pedal that held a 5 kg counterweight to assist with the upward phase of the pedaling action [28, 29], with the other leg resting on a chair. The exercising leg was randomly selected. The exercise protocol has been described in detail previously [6], and an overview of this protocol is provided in Fig. 2. Briefly, the subjects performed one-legged cycling for 45 min at 80 rpm at a work rate of 111 ± 12 W (heart rate 144 ± 4 beats per minute (bpm)). After a 5 min rest, they then performed interval exercise, consisting of 5 × 2 min one-legged cycling at a work rate of 149 ± 16 W. This was followed by an interval exercise of 5 × 3 min of maximal arm cranking using both arms (Monark 891E Wingate) at a work rate of 94 ± 16 W. The protocol was designed to lower the glycogen content in both type I and type II fibers, and by adding arm exercise reduce the rate of glycogen resynthesis in the exercised leg during the rest period until the following morning [6]. After this exercise session, the subjects remained fasted until the experiment the next morning.
Fig. 1
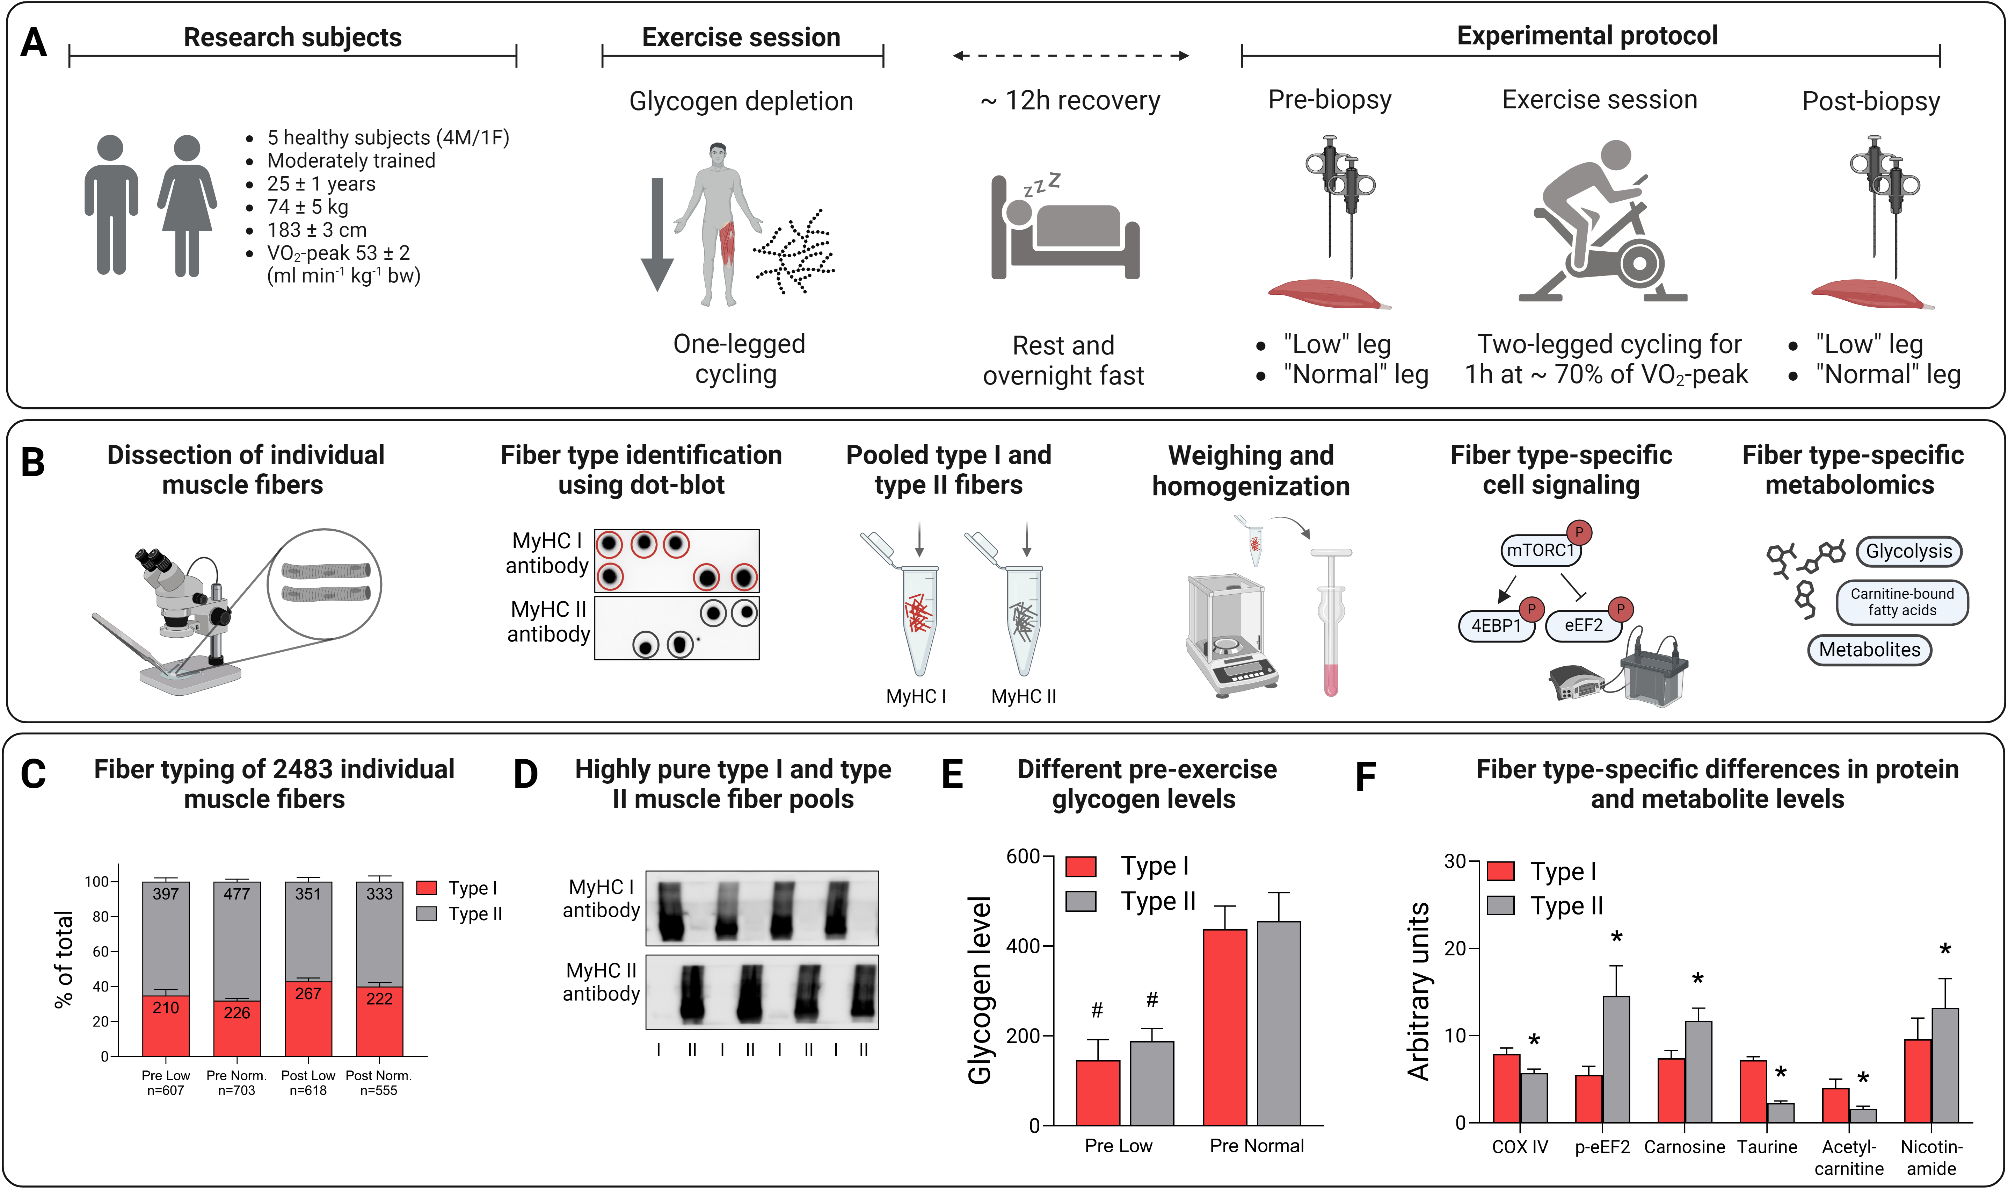
Workflow of the one- and two-legged exercise and muscle fiber isolation, identification, and analysis. A. Subject characteristics and schematic description of the exercise protocol, B. Individual fibers were separated from freeze-dried muscle biopsies, classified by dot-blotting and pooled into groups of type I and type II fibers. The fiber pools were weighed and homogenized in western blot buffer (~ 1 µg µl− 1) and analyzed with regard to proteins in the mTORC1 pathway as well as substrate and metabolites using metabolomics, C. Number and proportion of type I and type II fibers dissected out from biopsies obtained from the low and normal leg pre- and post-exercise, D. The purity of type I and type II fiber pools confirmed by analyzing the homogenates with antibodies against MyHC I or MyHC II, E. The one-legged exercise resulted in a 60–65% reduction in muscle glycogen the following morning, #P < 0.001 for low versus normal leg, and F. Fiber-type specific differences in protein and metabolite levels in biopsies from the normal leg pre-exercise, *P < 0.05 for type II versus type I fibers
Fig. 2
A schematic overview of the one-legged exercise session on the evening of day 1 performed to reduce glycogen levels, and the two-legged exercise session performed in the morning of day 2
Experimental protocol (day 2)The subjects reported to the laboratory in the morning at 8 AM after fasting overnight. After 30 min supine rest, muscle biopsies were taken from the vastus lateralis (∼ 10 cm from patella) of both legs under local anaesthesia (2% Carbocain, Astra Zeneca, Södertälje, Sweden) using a Weil-Blakesley conchotome (AB Wisex, Mölndal, Sweden) as described by Henriksson (1979) [30].
The subjects then exercised for 60 min at 70 rpm on a cycle ergometer (Monark 828E) at a work rate corresponding to ~ 70% of VO2peak, see Fig. 2. Pulmonary oxygen uptake was measured after 10–15 and 40–45 min of exercise using an on-line system (Oxycon Pro, Jaeger) and heart rate was monitored continuously by a portable device (Polar Electro Oy, Kempele, Finland). The average left/right power balance was recorded during exercise using a pedal-based power meter system (Vector 2, Garmin, Kansas USA), and the data were processed with publicly available cycling performance software (GoldenCheetah, version 3.3). Immediately after exercise the subjects lay down and a second muscle biopsy was taken from both legs, beginning with the low leg, using the same procedure as pre-exercise. The second biopsy was taken 2–3 cm proximal to the first one and both biopsies were taken at approximately the same position in both legs. The post-exercise biopsy was taken an average of 2.4 min (low leg) and 4.1 min (normal leg) after the end of exercise. The muscle samples were freed from blood and quickly frozen (within 10 s) in liquid nitrogen and stored at − 80 °C.
Single fiber dissection and type identificationThe muscle samples were freeze-dried overnight and subsequently dissected free of blood and connective tissue. Thereafter, single fibers were dissected out using needles and a fine forceps under a stereo microscope (Carl Zeiss MicroImaging, Jena, Germany).
In order to determine muscle fiber type, one fragment of the isolated single fibers was cut off and dissolved in 5 µl western blot (WB) buffer (2 mM HEPES (pH 7.4), 1 mM EDTA, 5 mM EGTA, 10 mM MgCl2, 1% Triton X-100, 1 mM Na3VO4, 2 mM dithiothreitol, 1% phosphatase inhibitor cocktail (Sigma P-2850) and 1% (vol/vol) Halt Protease Inhibitor Cocktail (Thermo Scientific, Rockford, IL)) and 5 µl 2X Laemmli sample buffer (Bio Rad Laboratories, Richmond, CA) and heated at 95 °C for 5 min. The fibers were then identified as either type I or type II using a modified version of the dot blotting procedure described by Christiansen et al. (2019) [31]. Briefly, polyvinylidene fluoride (PVDF) membranes were activated in 95% ethanol for 15–60 s and then equilibrated for 2 min in transfer buffer (25 mM Tris, 192 mM glycine, pH 8.3 and 20% methanol). 1 µl of each sample was applied to a specific part of two membranes. After complete absorption of samples, the membrane was left to dry for 2–5 min before being reactivated in 95% ethanol for 15–60 s and equilibrated in transfer buffer for 2 min. After washing in Tris-buffered saline-Tween (TBST), the membranes were blocked in 5% non-fat milk in TBST (blocking buffer) for 5 min at room temperature. Following blocking, the membranes were rinsed with TBST and then incubated with antibodies against MyHC I (Abcam #ab11083, diluted 1:10,000) or MyHC II (Abcam #ab91506, diluted 1:10,000) at room temperature for 2 h. Membranes were washed and incubated with secondary antibodies, anti-mouse (Cell Signaling Technology #7076S; 1:10,000) or anti-rabbit (Cell Signaling Technology #7074; 1:10,000) for 1 h at room temperature followed by washing in TBST. Proteins were visualized by applying Super Signal West Femto Chemiluminescent Substrate (Thermo Scientific) to the membranes, followed by detection on a Molecular Imager ChemiDoc™ MP system. A representative picture of the dot-blot image is provided in Fig. 1B.
Pooling of single fibersBased on the dot blot, fibers were classified and pooled into groups of type I and type II fibers. The pools of fibers were then weighed on a Cubis® high-capacity micro balance (Sartorius Lab Instruments, Göttingen, Germany). The average weight of the fiber pools was 144.1 µg (range 33.3–359.8 µg). The fiber pools were homogenized in ice-cooled WB buffer (1 µl/µg of tissue) using a ground glass homogenizer, and stored at -80 °C.
Analysis of fiber poolsDetermination of glycogen contentThe glycogen concentration in the homogenate was measured according to the method described by Leighton et al. (1989) [32]. 10 µl homogenate was digested in 1 M KOH at 70 °C for 15 min. After cooling, pH was adjusted to 4.8 with glacial acetic acid followed by addition of 10 µl acetate buffer (pH 4.8) containing amyloglucosidase and incubated at 40 °C for 2 h. Glucose concentration was then analyzed photometrically in a plate reader (Tecan Infinite F200, Männedorf, Switzerland). All samples were analyzed in triplicate.
Metabolomic analysisOn the day of analyses, 10 µl of sample homogenates and blanks (homogenizing buffer) were reconstituted in 400 µl of LC-MS methanol, vortexed for 10 s and sonicated for 15 min on ultrasound bath on ice. Samples were then centrifuged at 10,000 g for 15 min. Finally, 80 µl were transferred to an LC-MS vial equipped with a 150 µl insert. Samples were injected in randomized order of fiber type within the same individual.
LC-MS/MS analysisSamples were analyzed on an ACQUITY UPLC System coupled to a Waters Xevo® TQ-S triple quadrupole system (both from Waters Corporation (Milford, MA)), equipped with an electrospray ion source. For all metabolites, at least one specific selected reaction monitoring (SRM) transition was analyzed. Two independent injections were performed in positive and negative ionization mode. In positive mode, metabolites were separated on an Acquity Premier BEH Amide Vanguard FIT column (100 × 2.1 mm, 1.7 μm). Aqueous mobile phase (MPA) consisted of 20 mM ammonium formate + 0.1% formic acid in double-deionized water. Organic mobile phase (MPB) consisted of 0.1% formic acid in acetonitrile. The following chromatographic gradient was used: 0 min, 95% B; time range 0 → 1.5 min, 95% B (constant); time range 1.5 → 14 min, 95 → 55% B (linear decrease); time range 14 to 14.2 min, 55 → 45% B (linear decrease); time range 14.2 → 16.0 min, 45% B (isocratic range); time range 16.0 → 16.2 min, 45 → 95% B (linear increase). The column was then equilibrated at 95% B for 7 additional minutes. The flowrate was 400 µl/min and the column temperature was held at 30 °C. The volume of injection was set at 2.5 µl.
In negative mode, metabolites were separated on an Acquity Premier BEH Z-HILIC Vanguard FIT column (100 × 2.1 mm, 1.7 μm). Aqueous mobile phase (MPA) consisted of 20 mM ammonium acetate in double-deionized water adjusted to pH 9.1 with acetic acid. Organic mobile phase (MPB) consisted of acetonitrile. The following chromatographic gradient was used: 0 min, 90% B; time range 0 → 6 min, 90 → 65% B (linear decrease); time range 6.0 → 7.0 min, 65 → 55%B (linear decrease); time range 7 to 7.5 min, 55 → 45% B (linear decrease); time range 7.5 → 9.5 min, 45% B (isocratic range); time range 9.5 → 10 min, 45 → 90% B (linear increase). The column was then equilibrated at 90% B for 4 additional minutes. The flowrate was 500 µl/min and the column temperature was held at 30 °C. The volume of injection was set at 2.5 µl.
Western blottingAliquots of the homogenates were diluted with 4X Laemmli sample buffer (Bio-Rad Laboratories) to a concentration of 0.25 µg muscle/µl and heated at 95 °C for 5 min. Proteins were separated by SDS-PAGE, 15 µl from each sample was loaded onto 26-well Criterion TGX gradient gels (4–20% acrylamide, Bio Rad Laboratories) and electrophoresis run as previously described [33, 34]. Proteins were transferred to PVDF membranes (Bio Rad Laboratories) and stained with MemCode Reversible Protein Stain Kit (Thermo Scientific). All samples from each subject were loaded onto the same gel and all gels were run simultaneously. After destaining, the membranes were blocked in Tris-buffered saline (TBS; 20 mM Tris base, 137 mM NaCl, pH 7.6) containing 5% nonfat dry milk for 1 h at room temperature and incubated overnight with primary antibody. After incubation with primary antibody, membranes were washed and incubated with a secondary anti-rabbit or anti-mouse antibody for 1 h at room temperature followed by washing in TBST. Proteins were visualized by applying Super Signal West Femto Chemiluminescent Substrate (Thermo Scientific) to the membranes, followed by detection on a Molecular Imager ChemiDoc™ MP system and quantification of the resulting bands with Image Lab™ Software (Bio-Rad Laboratories). All protein targets (total protein and the phosphorylated form) were normalized to the total protein stain (MemCode™).
The purity of the type I and type II fiber pools was confirmed by analyzing the homogenates as described above and incubated with antibodies against MyHC I (Abcam #ab11083, diluted 1:10,000) or MyHC II (Abcam #ab91506, diluted 1:10,000). A representative immunoblot is presented in Fig. 1D.
AntibodiesFor immunoblotting, primary antibodies against mTOR (Ser2448, #2971; total, #2983), 4E-BP1 (Thr37/46, #2855; total, #9644), eEF2 (Thr56, #2331; total, #2332), S6K1 (Thr389, #9234; total #2708), ACC (Ser79, #3661; total, #3676), AMPK (Thr172, #4188; total, #2532), ULK1 (Ser555, #5869; total, #8054), LC3B (#2775), and COX IV (#4860) were purchased from Cell Signaling Technology (Beverly, MA, USA). Primary antibody for total MuRF-1 (#sc-398608) and UBR5 (#sc-515494) were purchased from Santa Cruz Biotechnology (Heidelberg, Germany).
All primary antibodies were diluted 1:1,000 except for total eEF2 and total 4E-BP1, which were diluted 1:2,000, and total UBR5 and MuRF-1 which were diluted 1:500. Secondary anti-rabbit (#7074; 1:10,000) and secondary anti-mouse (#7076; 1:10,000) were purchased from Cell Signaling Technology.
StatisticsConventional methods were employed to calculate means and SE of the mean. A three-way repeated measures ANOVA was employed to compare substrate, metabolite, and protein levels in type I and type II fibers in the low- and normal-glycogen leg pre-exercise as well as changes during exercise in both fiber types in the low- and normal-glycogen leg (leg, fiber type, time). When a significant main effect and/or interaction was observed in the ANOVA, Fisher´s LSD post hoc test was employed to identify where these differences occurred. For variables with missing values, linear mixed-effects models were created with protein levels and interactions as fixed effects, while variation between individuals was treated as random effects. The emmeans package was used to estimate marginal means between leg, time and fiber type.
Pearson´s correlation coefficient (r) was calculated to evaluate a possible relationship between parameters analyzed in the muscle biopsies.
Statistical analyses were performed in Statistica version 13 (StatSoft Inc., Tulsa, USA) and in R version 4.3.0 with a P-value < 0.05 being considered statistically significant. Figures were created using GraphPad Prism version 9.1.2 for Windows (GraphPad Software, San Diego), with the exception of Figs. 1 and 2 that were created with BioRender.com.
Comments (0)