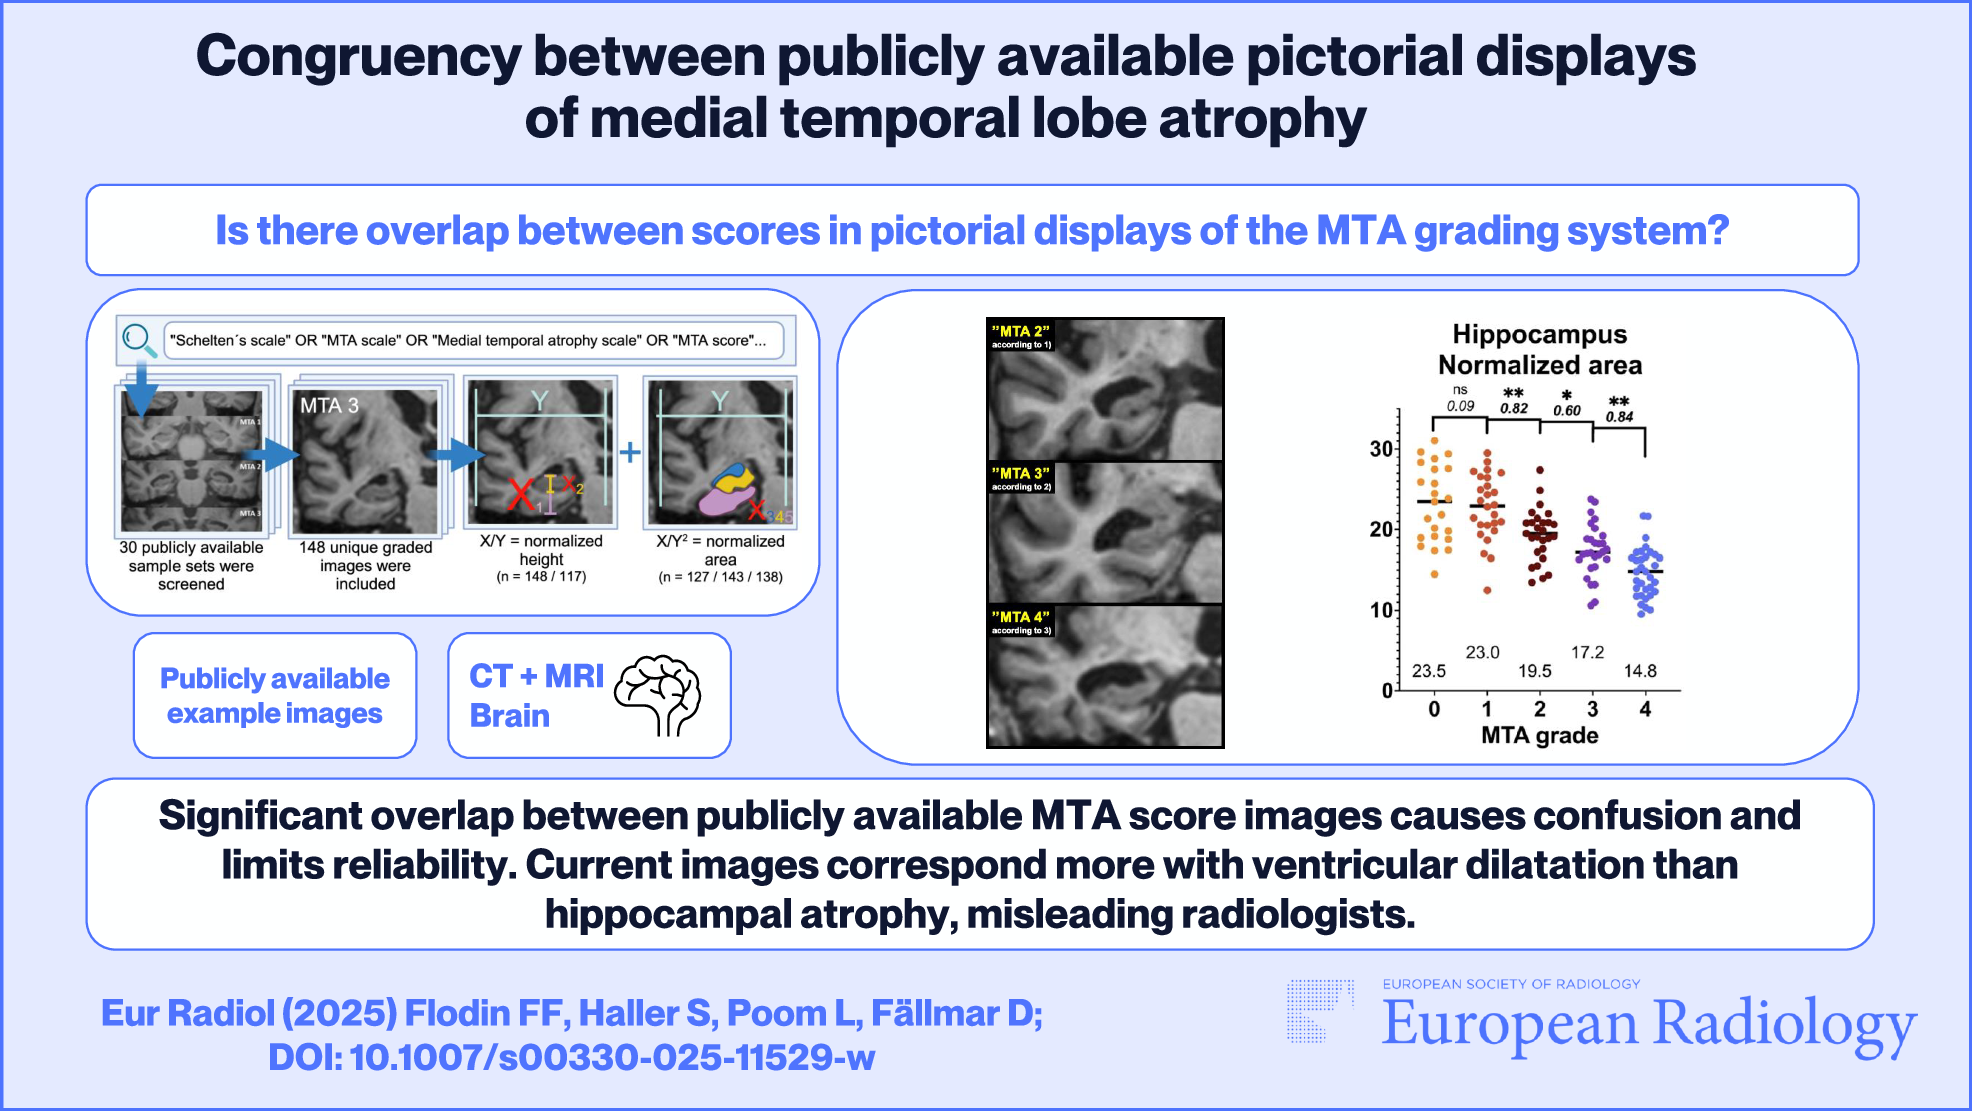
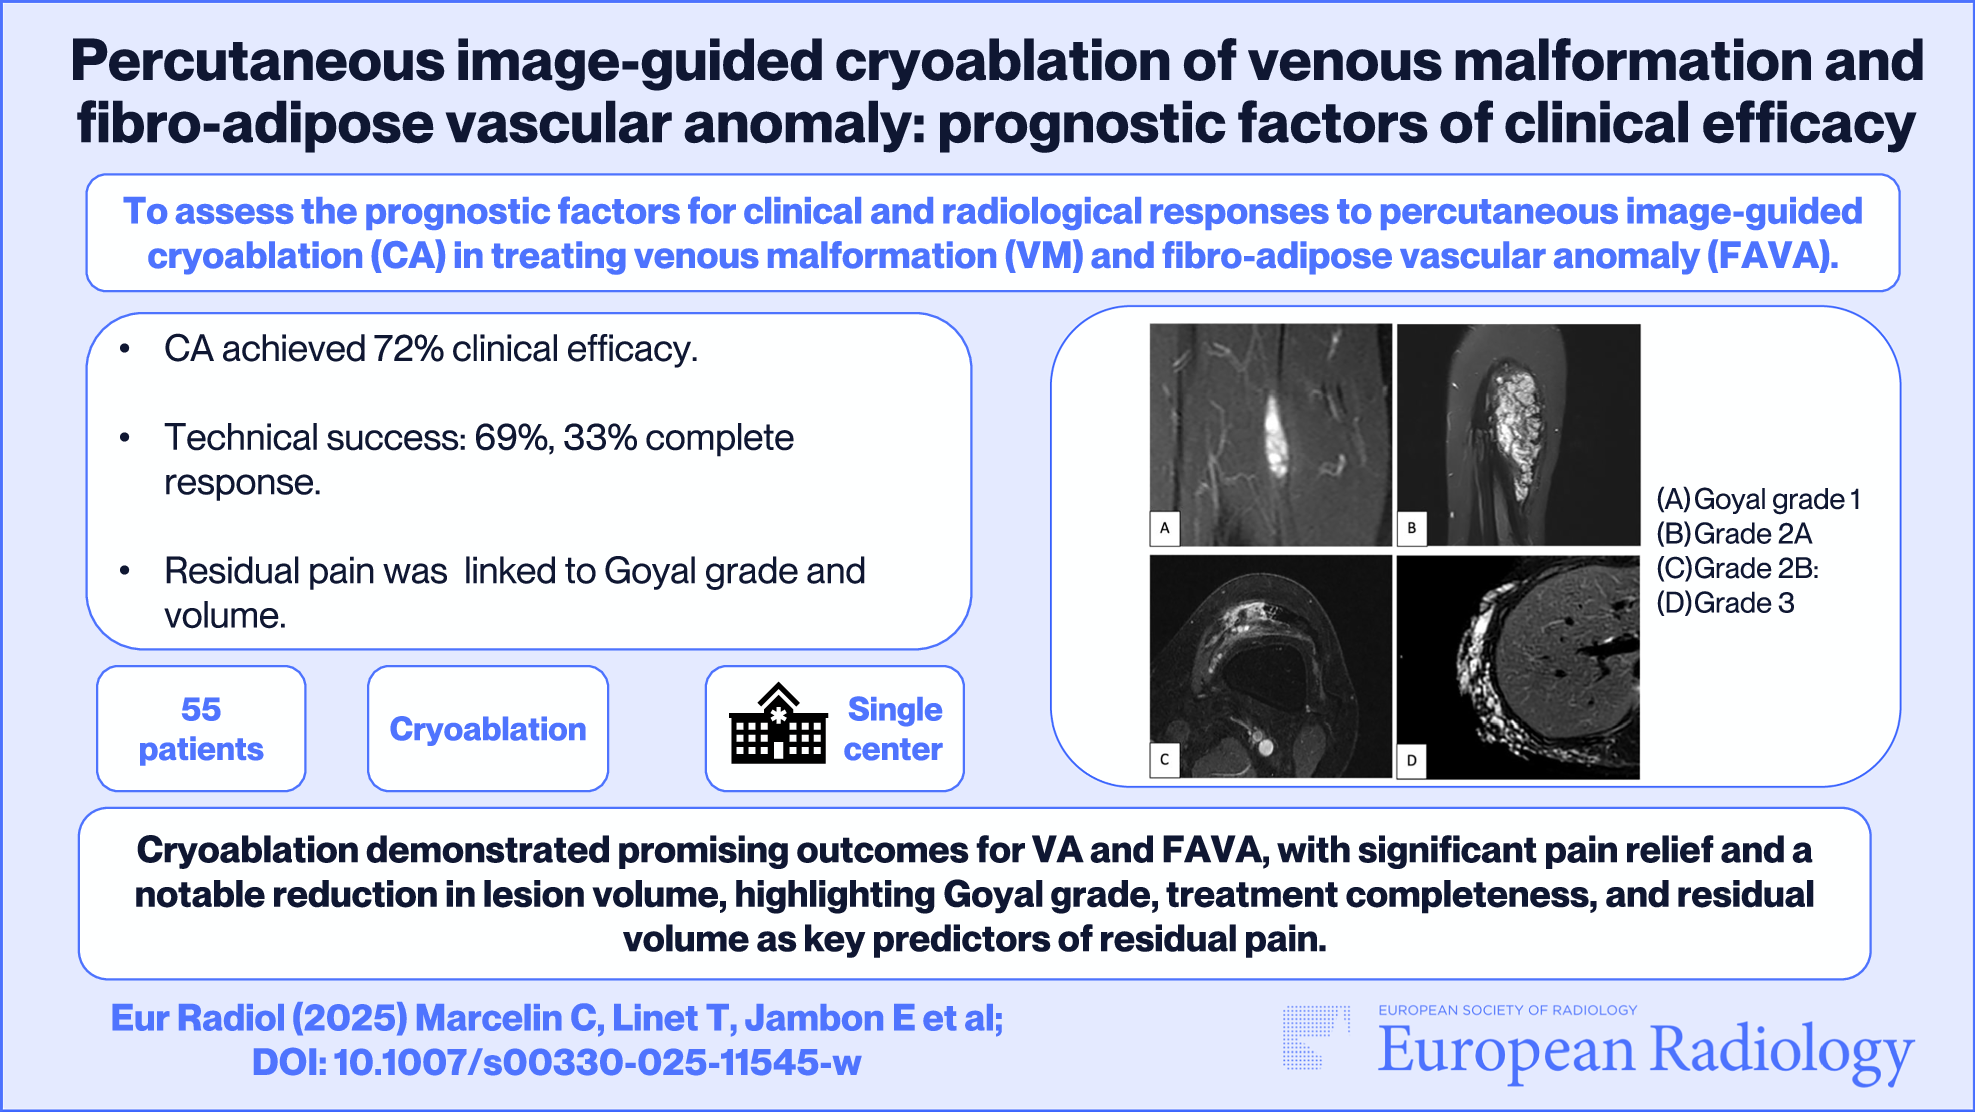
This study has two main findings. The first is a substantial overlap between publicly available pictorial displays of MTA scores when objectively measuring relevant brain structures. Specifically, the overlap highlights the need for clear distinctions between adjacent grades that currently serve as clinical cutoffs (1 vs 2 in younger patients, 2 vs 3 in older). If the different sample images had been congruent, little or no overlap had been found—i.e., clear distinctions between grades. In the present study, areas (more closely related to volumes) had higher congruency between scores than height (and the height of the hippocampus had the weakest correlation coefficient of all measured structures). However, exact areas cannot be assessed visually, and manual delineation is usually considered too time-consuming for clinical routine. This discrepancy suggests that the limitations inherent in visual grading scales may be an incentive for adapting volumetric tools. Another discrepancy is the insufficient congruency between the tilt/position of the coronal slice, shown in Table 1. The most prevalent position was chosen in less than half of the cases, and images displaying MTA grade 4 had a particularly large variance in positioning.
In the present clinical routine, insufficient congruency between different examples of the same scale leads to confusion and inconsistent results. The overlap in appearance presented in this article (quantitatively in Figs. 2, 3 and Table 1, and qualitatively in Fig. 4) highlights a source of such confusion. Group-level measures of effect sizes ranged from low to fairly high. The individual data points displayed in Figs. 2, 3 offer a visual overview of the overlap, which we consider to be substantial and problematic. That is, many individual data points representing a specific height or area are currently consistent with several different MTA grades, even between groups with larger effect sizes. For the reasons listed above, suggested lectotype images for each MTA score are presented (Fig. 5), with images selected from the present material to match the quantitative analysis.
The second main finding of the study was that the publicly displayed MTA scores are more strongly associated with the area of the temporal horn than with the hippocampus. Also, the TH area had less overlap than HPC measurements, as shown in Fig. 2d and 3a. This may influence radiologists to set MTA scores based more on ventricular dilatation rather than hippocampal atrophy. This can pose a clinical problem in itself, especially in patients with hydrocephalic features, leading to an exaggeration of actual medial temporal atrophy. Early stages of idiopathic normal pressure hydrocephalus can present with memory loss and is an important and treatable differential diagnosis in patients with cognitive issues. Specifically, an overestimation of the MTA grade can lead to a false diagnosis of Alzheimer’s disease in a patient with hydrocephalus, and the opportunity to consider shunt treatment may be lost. Further, a plausible explanation for the large variance found in the TH area in MTA 4 (Fig. 2d, rightmost group) is that some of the patients displayed in the public MTA scales may actually have, to some extent, hydrocephalic features rather than being typical examples of medial temporal lobe atrophy. Since normal pressure hydrocephalus is a common and important differential diagnosis in cognitively impaired patients, the finding of large temporal horns should trigger an assessment of other associated features, such as dilatation of Sylvian fissures, compression of parafalcine sulci, and a narrow callosal angle.
In the assessment of MTA, the hippocampal formation is assessed in conjunction with the choroid fissure and temporal horn—where atrophy of the former leads to secondary dilatation of the two latter. The hippocampus is a key structure for several cognitive domains and is a central locus for the pathology in patients with the most common (limbic-predominant) subtype of Alzheimer’s disease or LATE disease. As described in the introduction, it should be stressed that human perception is not ideally suited for estimating a volume from a two-dimensional image and that diameters influence our assessment. One of the key features separating grades 2 and 3—which is often a clinically relevant cutoff—is a loss of height in the hippocampal formation. This is not clearly seen in many of the publicly available sample images and may be more evident in the provided lectotype selection.
The area of the parahippocampal gyrus was also analyzed. This structure has received less attention than the hippocampus but is still an important structure in radiological assessments of cognitive impairment [23]. In the present study, these results did not provide additive information and were largely omitted from the results section.
In this study, we included both MR and CT images for our measurements, which did not pose any difficulties. MR images were slightly easier to measure accurately due to higher resolution and the superior ability of MRI to visualize structures. However, MTA scoring is considered sufficient for CT and is frequently used clinically with CT scans. Since only a minority of the available images were from CT scans, MR images were selected for figures and lectotype images.
When using subjective visual assessment as a semi-quantitative measurement, as the MTA score, the operationalized procedures should be strictly followed. Any deviations from the methodology, in combination with individual/subjective differences, will reduce the inter-rater reliability of that measurement. This is exemplified by a recent study that found large variations in performance between different formats of display of radiological images, and also between individuals within each format [24]. With specific regard to the Scheltens scale, visual assessments of height/length are influenced by a variety of biases, such as an inability to dismiss width [21] and area [22].
Limitations
The collection of images evaluated in this study are from different sources, with various image quality and context—with the common denominator that they have all been selected as typical examples for their respective MTA grade by an expert or researcher in the field. Since this comes with innate diversity, the ensuing congruency is limited, both in terms of the users and for this study. Some of the included images had a suboptimal resolution for the exact delineation of the regions of interest. All measurements in the study have been made by a single person which always entails a risk of bias. To minimize the risk of measuring bias, some images and measurements were repeatedly controlled by a senior consultant in neuroradiology (DF) during the measuring process using a feedback system to the assessor (FFF) to prevent a gradual shift in measurements. Hypothetically, severe atrophy may decrease the total width of the brain (here used as a reference line), but the actual impact of this on our results was considered negligible and most likely limited to the MTA 4 group.
A large number of studies have explored the performance of MTA grading in various clinical and research settings, as outlined in the systematic review of Park et al [8]. Although the lectotype images provided here are directly or indirectly chosen as typical examples from such studies, the accuracy and reliability of the resulting selection should ideally be evaluated. Optimally, such evaluations should be performed by independent research groups in different settings. Also, the subjective preference of different decision support images could be explored to strive for more homogenous compliance among radiologists.
Last but not least, it is plausible that some of the images included in this study had been asymmetrically scaled between X and Y-axes before publication, which could affect both the heights and areas. While this is not improbable, it does not change or diminish our conclusion regarding the confusion that arises for the end users, which is caused by the overlap in visual appearances and lack of congruency.

Comments (0)