
Remember me

Among 25,366 participants, 11,654 (45.9%) were male. After 82,445 person-years of follow-up, 5378 (21.2%) were diagnosed with MASLD. Compared with those without MASLD, participants with MASLD were more likely to be male, older, had higher levels of WC, BMI, DBP, SBP, WBC, neutrophils, lymphocytes, RBC, hemoglobin, platelet, FPG, TC, LDL-C, TG, AST, ALT, GGT, SUA, Scr, lower HDL-C, and had a higher proportions of smoking, drinking, hypertension, diabetes, dyslipidemia (Table 1).
Table 1 Baseline characteristics of the study population with and without MASLDBaseline characteristics of participants categorized by quartiles of cardiometabolic indices are also shown in Tables S1–S6. Individuals exhibiting elevated levels of cardiometabolic indices were predominantly male, older, and demonstrated increased levels of metabolic related factors.
The incidence density of MASLDThe incidence density of MASLD was 65.23 per 1000 person-years. In CMI quartile groups were 17.25, 41.45, 76.62 and 144.97 per 1000 person-years, respectively. In AIP quartile groups were 20.50, 45.27, 73.98 and 136.50 per 1000 person-years, respectively. In TyG quartile groups were 24.85, 48.27, 74.59 and 128.13 per 1000 person-years, respectively. In TyG-BMI quartile groups were 10.16, 36.41, 79.24 and 164.14 per 1000 person-years, respectively. In TyG-WC quartile groups were 11.86, 40.28, 78.60 and 159.79 per 1000 person-years, respectively. In TyG-WHtR quartile groups were 11.92, 43.25, 80.65 and 150.89 per 1000 person-years, respectively. The analysis by age group found that the incidence density of MASLD was the highest in subjects aged 45–59 years, followed by age 60 and over and the lowest was aged 18–44 years (Table S7).
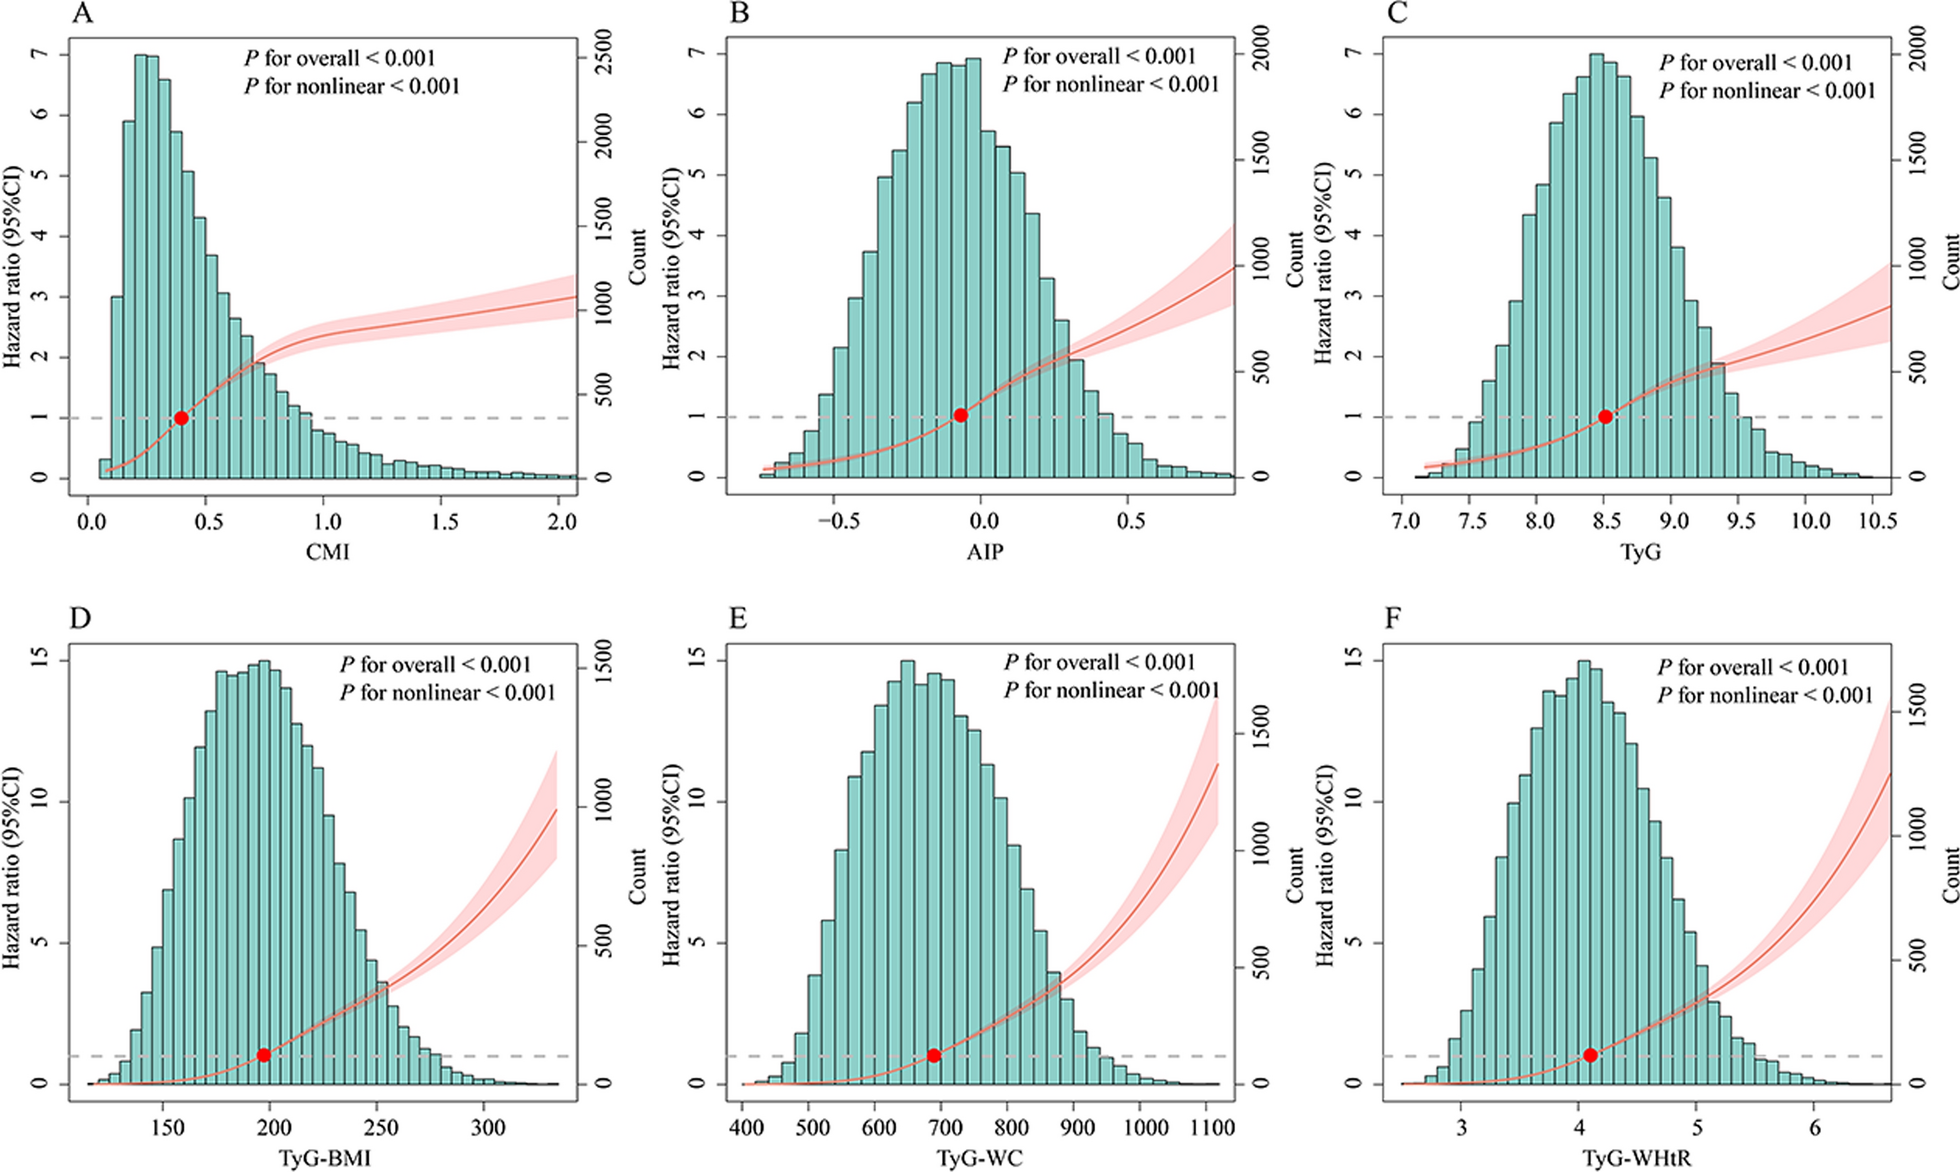
Association between cardiometabolic indices and the incidence of MASLD as well as componentsKaplan–Meier curves showed that individuals in the higher cardiometabolic indices quartiles had greater cumulative incidence of MASLD than those in the lowest quartiles (Fig. S4). The RCS curves indicated that cardiometabolic indices and MASLD exhibited nonlinear associations (P for overall < 0.001, P for nonlinear < 0.001) (Fig. 1). Compared with individuals in the lowest quartiles, the adjusted HR (95%CI) in the highest quartiles of CMI, AIP, TyG, TyG-BMI, TyG-WC and TyG-WHtR were 6.11 (5.45–6.86), P < 0.001; 4.58 (4.11–5.10), P < 0.001; 3.55 (3.21–3.92), P < 0.001; 13.55 (11.80–15.57), P < 0.001; 12.52 (10.93–14.34), P < 0.001; 11.37 (9.96–12.98), P < 0.001, respectively (Table 2). The cardiometabolic indices were also associated with MASLD components, including obesity, raised FPG or DM, raised BP, raised TG and reduced HDL-C (Table S8).
Fig. 1
Restricted cubic spline analysis of cardiometabolic biomarkers with MASLD. CMI cardiometabolic index, AIP atherogenic index of plasma, TyG triglyceride-glucose index, TyG-BMI triglyceride-glucose × body mass index, TyG-WC triglyceride-glucose × waist circumference, TyG-WHtR triglyceride-glucose × waist circumference/height, MASLD metabolic dysfunction-associated steatotic liver disease
Table 2 Associations between cardiometabolic indices and the incidence of MASLDAssociation between cardiometabolic indices and the incidence of liver fibrosisUsing NFS and MAF-5, 256 and 147 MASLD patients were respectively identified with a higher probability of liver fibrosis. Compared with participants without liver fibrosis, participants with fibrosis tended to be male, older, had higher levels of BMI, WC, SBP, DBP, hemoglobin, FPG, GGT, SUA and had a higher proportions of smoking, drinking, hypertension, diabetes (Table S9). A linear correlation was observed between CMI, AIP, TyG-WC and liver fibrosis. TyG, TyG-BMI and TyG-WHtR exhibited nonlinear correlations with liver fibrosis (Fig. S5). Compared with the lowest quartile of TyG-BMI, patients in the highest quartiles had 1.75 times (HR 1.75, 95% CI 1.21–2.54, P = 0.003) and 4.47 times (HR 4.47, 95% CI 2.40–8.32, P < 0.001) higher risks of developing higher NFS and MAF-5, respectively (Table 3, Table S10).
Table 3 Association between cardiometabolic indices and non-invasive fibrosis scoreSubgroup and sensitivity analyses between cardiometabolic indices and MASLDSubgroup analyses revealed that in each subgroup stratified, the positive associations between cardiometabolic indices and MASLD were consistent, but significant associations were more likely to be observed among individuals who were females, and individuals without obesity, without hypertension (Tables S11–S16). In the sensitivity analyses, excluding individuals with MASLD occurring within first year of follow-up (n = 1107) and excluding individuals who used antihypertensive, hypoglycemic (n = 1518), the results were similarly (Tables S17–S18). After dividing participants into low and high groups according to the optimal cutoff point, we found that compared with the low group, individuals in the high group had a 2.78 times, 2.22 times, 2.01 times, 3.60 times, 3.25 times, 3.27 times greater risk of developing MASLD, respectively (CMI: HR = 2.78, 95% CI 2.60–2.97; AIP: HR = 2.22, 95% CI 2.09–2.36; TyG: HR = 2.01, 95% CI 1.89–2.14; TyG-BMI: HR = 3.60, 95% CI 3.38–3.84; TyG-WC: HR = 3.25, 95% CI 3.03–3.47; TyG-WHtR: HR = 3.27, 95% CI 3.06–3.49) (Table S19). In addition, after PSM, the results still indicated a positive association between cardiometabolic indices and MASLD (Figs. S6–S11, Table S20).
Mediation analyses between cardiometabolic indices and MASLDMediation analyses showed that WC and BMI mediated a more significant proportion of indirect effects in the associations between cardiometabolic indices and MASLD (Fig. 2, Table S21). For CMI, AIP, TyG and its derived indicators, the mediation proportions of WC-mediated MASLD were 40.3%, 32.8%, 37.7%, 16.2%, -7.9%, 37.8%, respectively. BMI mediated 40.4%, 33.2%, 36.5%, − 10.4%, 37.4%, 48.5% of the associations between CMI, AIP, TyG and its derived indicators and MASLD. Figure 2 showed the proportion of indirect effects mediated by WBC.
Fig. 2
Mediation analysis of cardiometabolic indices with MASLD. CMI cardiometabolic index, AIP atherogenic index of plasma, TyG triglyceride-glucose index, TyG-BMI triglyceride-glucose × body mass index, TyG-WC triglyceride-glucose × waist circumference, TyG-WHtR triglyceride-glucose × waist circumference/height, MASLD metabolic dysfunction-associated steatotic liver disease, WBC white blood cell, WC waist circumference
Predicive performance comparisonTime-dependent ROC curves showed that TyG-BMI had the highest AUC in predicting the onset of MASLD (Figs. 3, and S12). To further validate the predictive performance of cardiometabolic indices for MASLD onset, we computed time-dependent Harrell’s concordance indices (C-index). Among all indices, TyG-BMI demonstrated the highest predictive ability (C-index = 0.768, 95% CI 0.762–0.774), followed by TyG-WC (C-index = 0.758, 95% CI 0.752–0.764) and TyG-WHtR (C-index = 0.745, 95% CI 0.739–0.751). Conventional anthropometric measures such as BMI (C-index = 0.744, 95% CI 0.738–0.750), WC (C-index = 0.735, 95% CI 0.729–0.741), and WHtR (C-index = 0.716, 95% CI 0.710–0.722) exhibited moderate predictive value, while CMI (C-index = 0.725, 95% CI 0.717–0.733) and AIP (C-index = 0.703, 95% CI 0.695–0.711) showed relatively lower performance. Notably, the baseline TyG index had the weakest association with MASLD risk (C-index = 0.685, 95% CI 0.677–0.693). To further explore sex differences in predictive performance, we conducted time-dependent ROC analyses stratified by sex. We found that cardiometabolic indices had a higher AUC in predicting the onset of MASLD in females and TyG-BMI had the highest predictive value (Fig. S13).
Fig. 3
Time-dependent predictive performance of cardiometabolic indices for predicting the onset of MASLD
Comments (0)