
Remember me


Quetiapine fumarate was purchased from RIA International LLC, Ludiflash® was gifted by BASF, AFFINISOL™ HPMC HME LV15 Hypromellose was gifted by Colorcon, commercially available quetiapine fumarate tablets were procured from Ascend laboratories LLC and other chemicals used such as methanol, deionized water, etc. were purchased from Fisher Scientific.
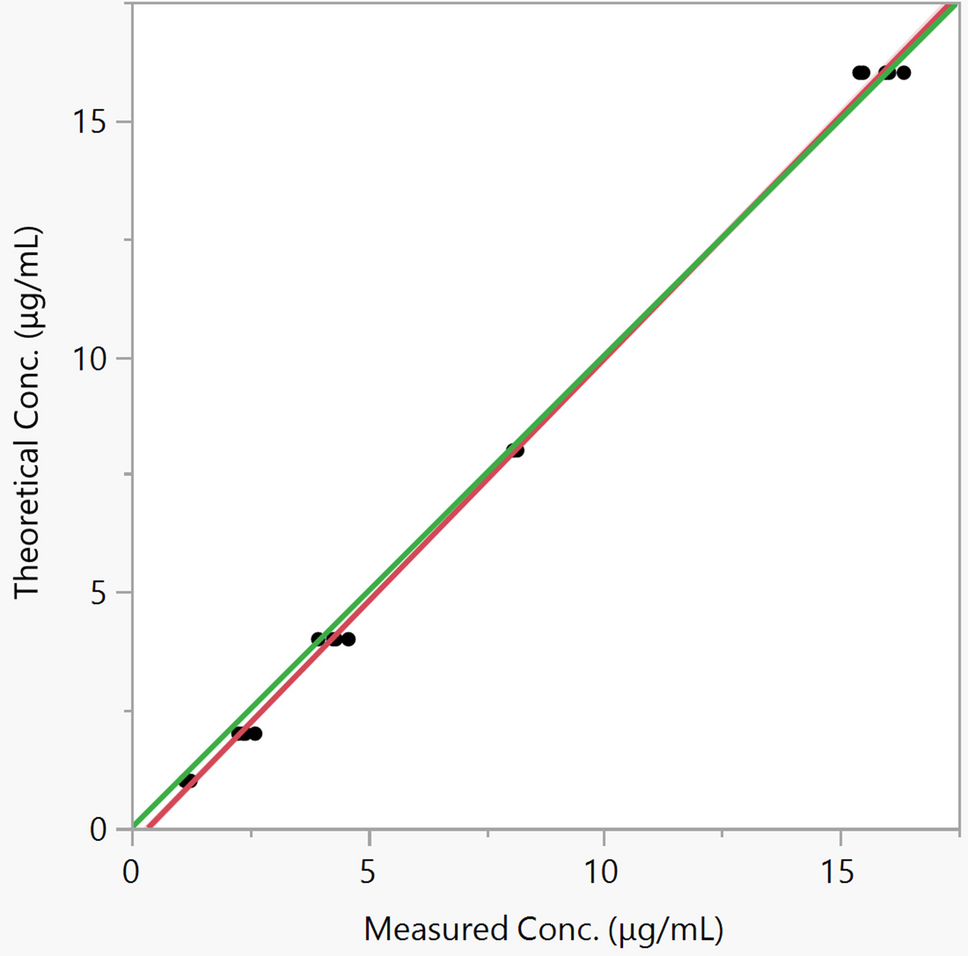
MethodsUV-Visible Spectroscopy MethodThe calibration curve of QTF was obtained using UV-Visible spectroscopy (Thermo Scientific Genesys UV-Visible Spectrophotometer, USA) with water as the solvent. A stock solution of 1 mg/mL QTF was prepared, and subsequent dilutions of 5 µg/mL, 10 µg/mL, 15 µg/mL, 25 µg/mL, 35 µg/mL, 40 µg/mL, and 50 µg/mL were made. The calibration curve was generated using the absorbance values measured at the λmax of 290 nm [16].
Twin Screw Melt Granulation (TSMG)Preparation of BlendsA batch size of 50 g was prepared for each of the six formulations, designated as F1 to F6, as shown in Table 1. Each tablet contained 345.56 mg of QTF (Eq. 300 mg base) [17]. The intragranular composition of these formulations included drug loadings of 25%, 35%, and 45% quetiapine base, with different combinations of Ludiflash®and HPMC HME LV15 (HPMC). Ludiflash® and HPMC were used as a diluent and binder, respectively. Ludiflash® is a co-processed excipient, contains mannitol as the major constituent and 4–6% w/w of crospovidone as a disintegrant [18]. The excipients and QTF were sieved through a #35 mesh and blended using a benchtop blender operating at 10 rpm for 10 min before proceeding to further processing.
Table 1 The intragranular composition of formulationsGranulation Process for Formulated BlendsThe powder blends were granulated using a 16 mm hot melt twin-screw extruder (ThermoFisher Scientific, 16 mm twin-screw extruder). The screw design, illustrated in Fig. 1, was strategically configured to ensure the solid feed underwent thorough and consistent mixing throughout the extrusion process. The design included an extended mixing zone to maximize uniformity, a material conveying zone to maintain smooth material flow, and a terminal mixing zone to ensure final homogenization before ejecting the processed granules.
The twin-screw extruder was operated at a screw speed of 50 rpm, with the temperature set to 150 °C, ensuring controlled thermal conditions. The torque was consistently maintained below 50%, signifying efficient mixing and minimal mechanical resistance during extrusion. The feed rate was maintained at 2–3 g/min, enabling a consistent and uniform material throughput. Following extrusion, the granules were milled using a benchtop blender and then sieved through a #35 mesh to achieve uniform particle size.
Fig. 1
Screw configuration of TSMG used in the current study
Flow PropertiesThe flow properties of all granules were assessed by calculating Carr’s Index and Hausner’s ratio with the help of bulk density (BD) and tapped density (TD). A 250 mL measuring cylinder was weighed, and its empty weight was recorded. Granules were carefully weighed and transferred into the cylinder. The combined mass of the cylinder and granules, along with the volume of the untapped granules, was documented. To measure tapped density, the cylinder was tapped using a tapping device for 10, 500, and 1250 taps, or until the volume change between consecutive measurements was less than 2 mL. If the volume difference exceeded 2 mL, additional sets of 1250 taps were performed until two consecutive readings showed a difference of less than 2 mL. The final tapped volume of the granules was recorded to ensure consistency and accuracy. The bulk density, tapped density, and Hausner Ratio of the granules were calculated using the following Eqs. 1, 2 and 3 [19].
$$\:Bulk\:Density=\frac$$
(1)
$$Tapped\,Density = \frac}}$$
(2)
$$\:\text\text\text\text\text\text\text\text\:\text\text\text\text\text=\frac$$
(3)
Differential Scanning CalorimetryDSC measurements of QTF, HPMC, Ludiflash®, physical mixtures, and extrudates were conducted using a Discovery DSC 25 instrument (TA Instruments, Newcastle, DE, USA) equipped with a Refrigerated Cooling System (RCS90). Approximately 5 mg of each sample was placed in standard aluminium pans, which were then crimped and sealed with aluminium lids. The samples were scanned at a consistent rate of 20 °C per minute across a temperature range of 25–200 °C, with a nitrogen purge flow of 50 mL/min. An empty pan was used as a reference [20].
Attenuated Total Reflection (ATR)IR spectroscopy was conducted to identify molecular interactions of pure QTF, both in isolation and in the presence of Ludiflash® and HPMC HME LV15 Hypromellose within the formulations, before and after exposure to high shear forces and elevated temperatures. The IR spectra of QTF, HPMC, Ludiflash®, physical mixtures, and extrudates were obtained using an Agilent Cary 660 FTIR spectrometer (Agilent Technologies, Santa Clara, CA, USA). A small sample was placed on the diamond crystal and compressed using a Miracle high-pressure clamp. The samples were analyzed over a scanning range of 4000–650 cm− 1 with a resolution of 4 cm− 1. The FTIR spectrometer was equipped with an attenuated total reflection (ATR) accessory (Pike Technologies, Madison, WI, USA), featuring a single bounce and a diamond-coated ZnSe internal reflection element [21].
CompressionCompression of GranulesBefore tablet compression, 5% of the super-disintegrant croscarmellose sodium was added to the granular mixture and blended in a benchtop V-blender at 10 rpm for 5 min. Following this, 1% of the lubricant magnesium stearate was added, and blended using bench-top V-blender at 10 rpm for an additional 5 min. The blended material was then compressed using a Natoli manual single station compression machine (Natoli NP-RD10A) under a compression force of 4000 to 5500 kPa, using an oval die with dimensions of 11 mm x 18.8 mm. The weight of tablets prepared from six formulations was given in Table 2. Though the final weight of each formulation varied, the dose remained constant at 345.56 mg of QTF (Eq. 300 mg base) per tablet.
Table 2 Final composition and final weight of the tabletsAssay of Compressed & Commercially Available Quetiapine Fumarate TabletsThe strength of the commercial quetiapine fumarate tablet was 345.56 mg of QTF (Eq. 300 mg base). An assay was performed for each of the compressed formulations (F1, F2, F3, F4, F5, F6) as well as the commercially available quetiapine fumarate tablets. The 10 tablets of each formulation were crushed in a motor and pestle, and the powder equivalent to one tablet weight was dissolved in a methanol and water mixture at a ratio of 30:70 [22]. The mixture was sonicated for one hour, and the absorbance of each solution was recorded using UV-visible spectroscopy at a λmax of 290 nm.
Evaluation of TabletsThe evaluation of the tablets included tests for weight variation, hardness, thickness, friability, and disintegration time. For the weight variation test, the individual weights of 20 tablets from each formulation were recorded using an balance. The weight variation test was performed because the percentage of QTF in the formulation is ≥ 25 mg and constitutes ≥ 25% of the total weight of the tablet. The acceptance value for the weight variation was then calculated using Eq. 4 [23].
$$\:AV=\left|M-X\right|+k*s$$
(4)
If 98.5% ≤X ≤ 101.5%, then M = X.
If X < 98.5%, then M = 98.5%, (AV = 98.5 – X + ks)
If X > 101.5%, then M = 101.5%, (AV = X – 101.5 + ks)
$$\:_=\raisebox_*A$}\!\left/\:\!\raisebox\right.$$
X: Mean content of the dosage units (expressed as a percentage of label claim).
χi: Individual content of each unit (expressed as a percentage of label claim).
n: Number of units tested.
wi: individual weight.
A: Assay.
W: Average weight.
The hardness test was conducted on 10 tablets from each formulation batch using a tablet hardness tester (VK 200, Optimal) to determine the average tablet hardness or crushing strength. Tablet thickness was measured individually for 10 tablets using a digital vernier callipers.
For the friability test, 10 tablets were tested, as the weight of each tablet exceeded 650 mg. The tablets were weighed and placed into a friability tester (FT2, Sotax), then subjected to 100 revolutions (4 min at 25 rpm). The initial weight (IW) and final weight (FW) of the tablets were recorded, and the percentage friability was calculated using Eq. 5 [24].
$$\:\text\:\text\text\text\text\text\text\text\text\text\text=\:\frac\text-\text\text}\text}\text100$$
(5)
For the disintegration time test, one dosage unit was placed in each of the six tubes of the disintegration test basket, and a disk was inserted in each tube. The apparatus (Dr.Schleuniger Pharmatron DT2-IS) was operated using water as the immersion fluid, maintained at 37 ± 2∘C The disintegration time for each formulation was recorded.
Dissolution Studies of Compressed & Commercially Available Quetiapine Fumarate TabletsThe drug release studies were conducted for each batch of compressed QTF tablets as well as for the commercially available tablets using the dissolution method outlined in FDA. A USP Type-II paddle apparatus was used at 37 °C with 900 mL of water as the dissolution medium, operating at 50 rpm. Samples of 2 mL were drawn at intervals of 10, 15, 20, 30, 45, and 60 min, following FDA criteria. The samples from each of the six batches were then diluted by a dilution factor of 10, and the diluted samples were analysed using UV-visible spectroscopy at 290 nm. The absorbance of each sample was recorded, and the cumulative percentage release of the compressed tablets was calculated [25]. The drug release profiles of the compressed formulations were compared with the commercially available tablets by calculating the dissimilarity factor (f1) and similarity factor (f2) as defined in the USP. The formulation that most closely matched the drug release profile of the commercial product was selected as the lead formulation.
Comments (0)