
Remember me
An a priori power analysis (G*Power version 3.1.9.4; Heinrich Heine University Düsseldorf, Düsseldorf, Germany) showed that a minimum of eight participants was required to address the main research question, based on conventional α (0.05) and β (0.80) values, and an effect size of 0.51 as reported by Endo et al. (2012) using the post-exercise reduction in MAP as the primary dependent variable. Therefore, 12 healthy, recreationally active but untrained, normotensive Asian men (age: 24 ± 1 years; height: 178.0 ± 5.5 cm; mass: 78.0 ± 9.3 kg; \(}\text}_} }\): 37 ± 6 mL·kg−1·min−1; peak power output: 266 ± 25 W) were recruited for this study. Although recruitment targeted both males and females, the three females that initially took part did not complete all trials. An additional effort was made to recruit more female participants, but none were willing to take part before the end of the study. This study was approved by Xi’an University Science and Technology human ethical committee (XUST-IRB2022002) and registered on the China clinical trial database ChiCTR2300071885, with each participant providing written and informed consent and adhering to the latest version of the Declaration of Helsinki.
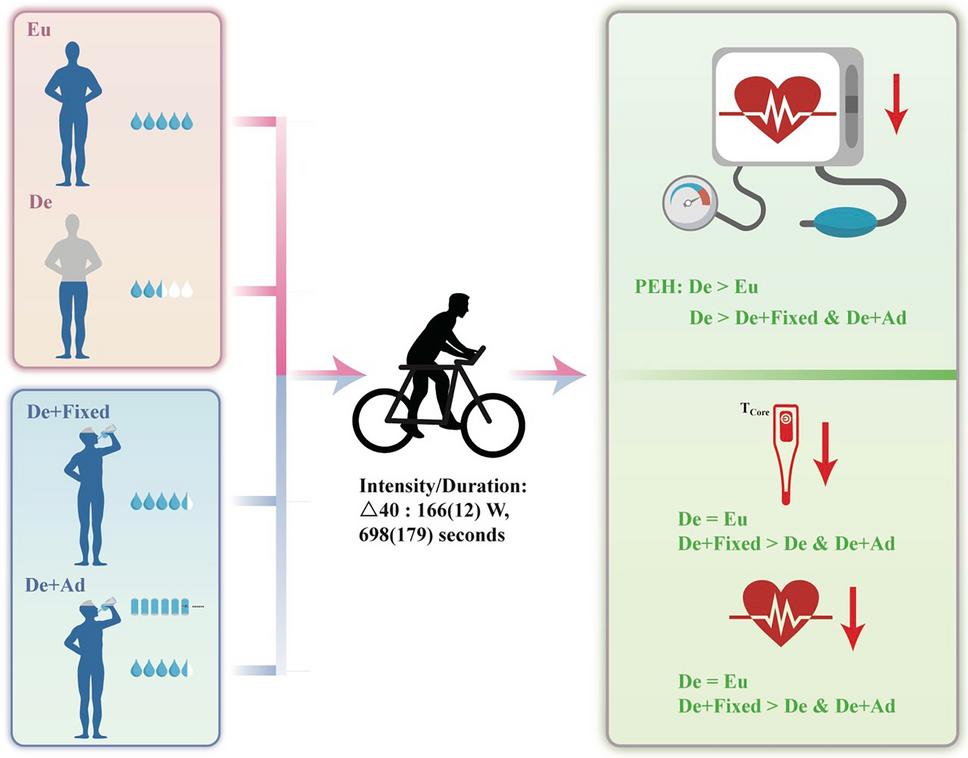
Experimental overviewAll participants reported to a temperature-controlled laboratory (24.1 ± 0.7 ℃, 50 ± 5% relative humidity) on six occasions: 1): a maximal ramp incremental exercise test, 2) a familiarisation trial with 12-h fluid deprivation to estimate the mass lost during exercise; 2) four experimental trials comprising a full crossover euhydration trial (Eu), 12-h fluid deprivation trial without fluid replenishment (De), 12-h fluid deprivation with a fixed fluid intake matched for body mass lost (De + Fixed) and 12-h fluid deprivation with ad libitum drinking (De + Ad). To prevent an unequal time to exhaustion between the dehydration trials and the euhydration trial, one of the dehydration trials was performed first until volitional exhaustion and thus full randomisation across trials could not be achieved. However, the order of the dehydration trials was randomised and counter balanced. Each trial was performed at the same time of day (all trials started at 7 am) to eliminate the effect of diurnal rhythms on blood pressure and body temperature fluctuations and was separated by at least 1 week to ensure full recovery. Furthermore, all participants were unaware of the purpose of this study.
Ramp incremental protocol testFollowing anthropometric measurements, all participants completed a ramp incremental exercise test on a cycle ergometer (Ergoline, USA) for determination of \(}\text}_} }\), the gas exchange threshold (GET), the mean response time (MRT) of oxygen uptake (\(}\text}_}\)) kinetics, and subsequently the power output associated with the 40% difference between the GET and VO2max (Δ40%). The ramp incremental test consisted of a 4-min baseline period of cycling at 20 W, followed by a ramped, linear increase in work rate of 20 W/min at a fixed cadence of 70 rpm until the participant could no longer maintain the required cadence of 60 rpm despite strong verbal encouragement. Ventilatory and gas exchange variables were measured continuously breath-by-breath throughout each test. \(}\text}_} }\) was defined as the highest 20 s average obtained at the end of the test. The GET and MRT were determined as previously described (Goulding et al. 2017). In brief, the GET was independently verified by two different investigators (THL and RPG) using the following criteria: (i) a disproportionate increase in CO2 production (VCO2) relative to \(}\text}_}\) using the V-slope method (Beaver et al. 1986); (ii) an increase in the ventilatory equivalent for O2 (i.e. \(}}_}} /}\text}_}\)) without an increase in the ventilatory equivalent for CO2 (i.e., \(}}_}} /}\text}_}\)); and an increase in end tidal O2 tension with no change in end tidal CO2 tension. Exercise intensity was based on Δ40% as our pilot testing indicated that this intensity was the most effective in eliciting a post-exercise hypotension response.
Hydrations status and PEH trialsThe euhydration trial was conducted without special pre-treatment although participants were requested to ensure an habitual hydration state and their fluid consumption was tracked (2.3 ± 0.9 L) during the 24 h prior to their trial (Eu), with this verified by their urine specific gravity (USG) being less than 1.02 using a refractometer (Atago PAL-10S, Tokyo, Japan) (Oppliger et al. 2005). For the dehydration trials, 24 h prior to the exercise trials, all participants were allowed to drink only 1 L of fluid up until the completion of their lunch and told to refrain from any fluid intake for the next 12 h (Fig. 1). In addition, they were advised to avoid any high sodium in their diet as this would influence their blood pressure and fluid regulatory responses. The criteria for dehydration included a net reduction of body mass, urine specific gravity being ≥ 1.02, and an elevated plasma osmolarity. Following 12 h of fluid deprivation, the participants weighed themselves nude, provided a urine sample, and then rested on the cycle ergometer for 15 min to allow for resting blood pressure measurement and venepuncture procedure. Upon completion of the venepuncture procedure, the participants cycled at Δ40% for the same duration as the first dehydration trial, until exhaustion. Upon completion of the euhydration and the dehydration-only trials, all participants were given fluid equivalent to 0.1% loss of their body mass from the familiarisation to alleviate a dry mouth. Participants then underwent 1 h of seated resting recovery on the cycle ergometer and all measurements were completed whilst participants were seated on the cycle ergometer.
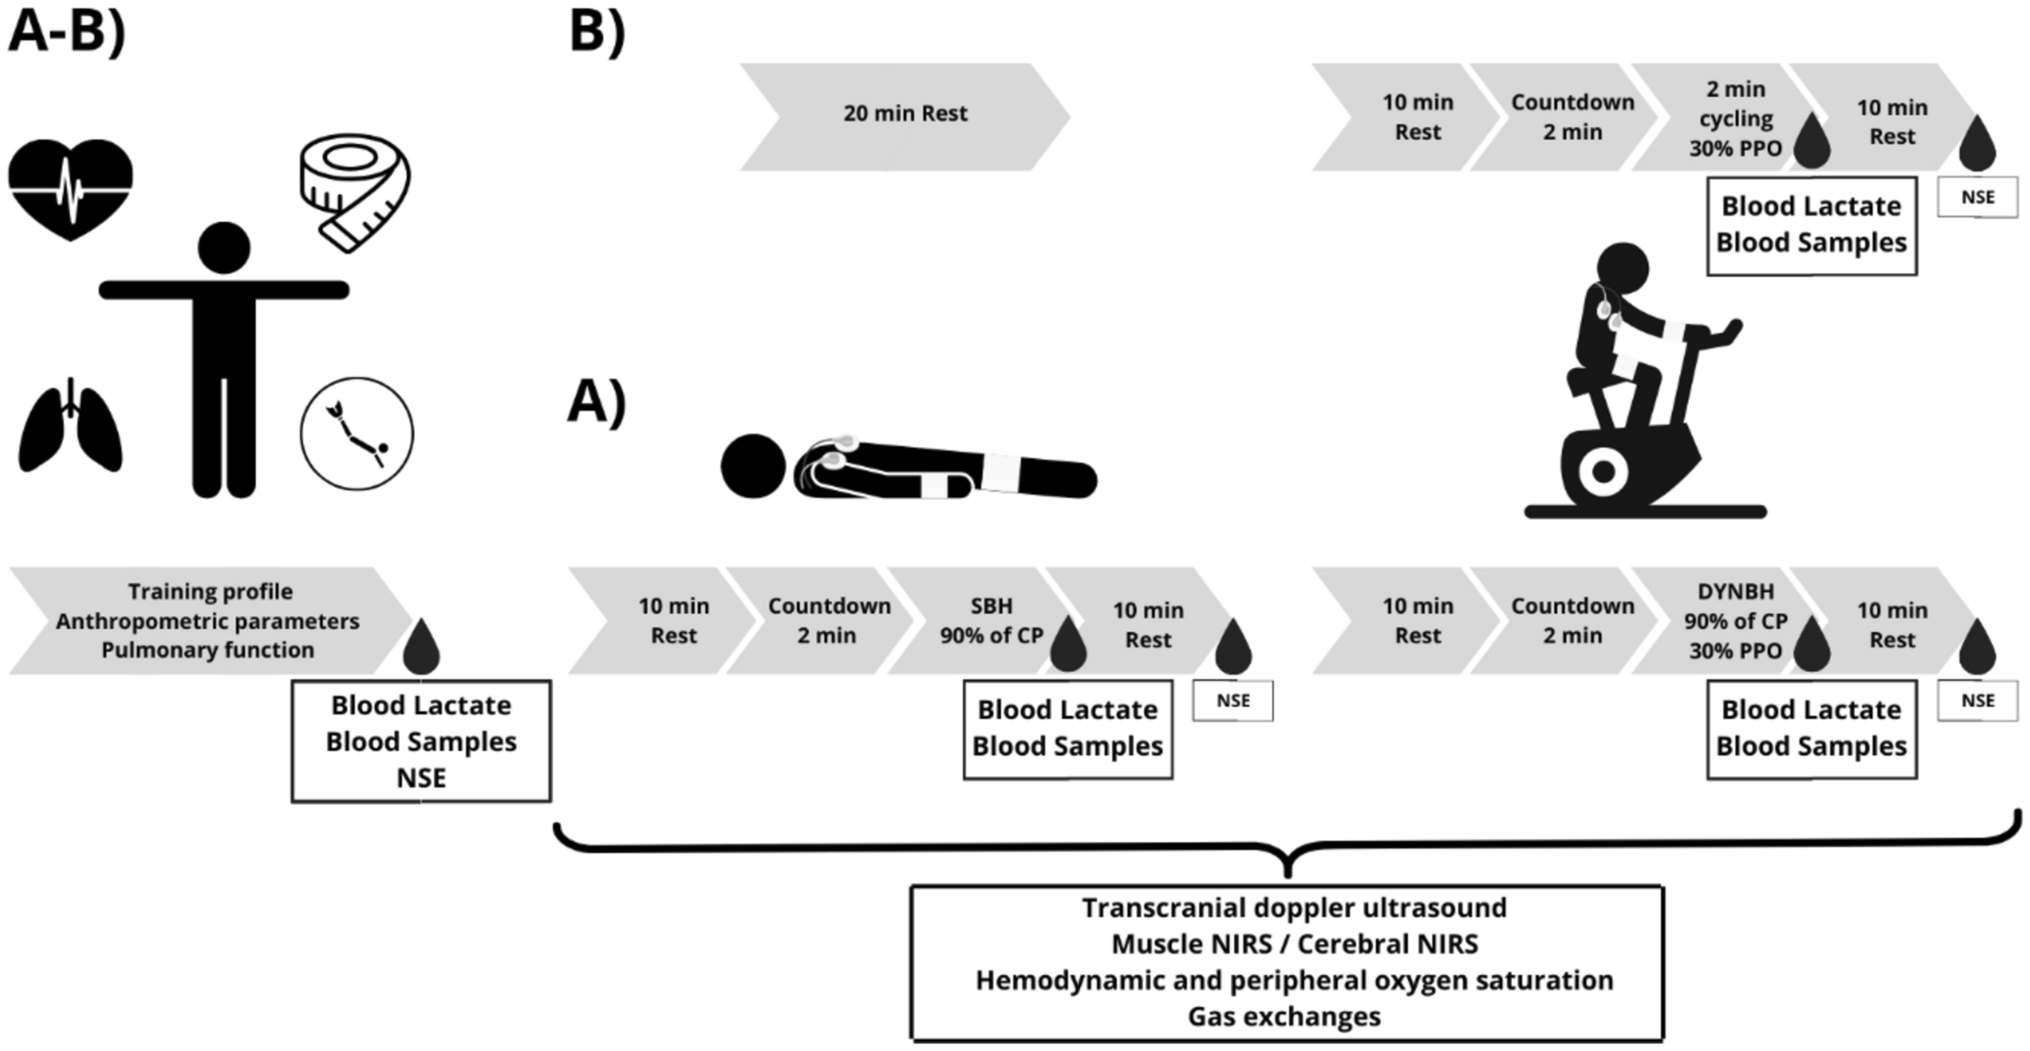
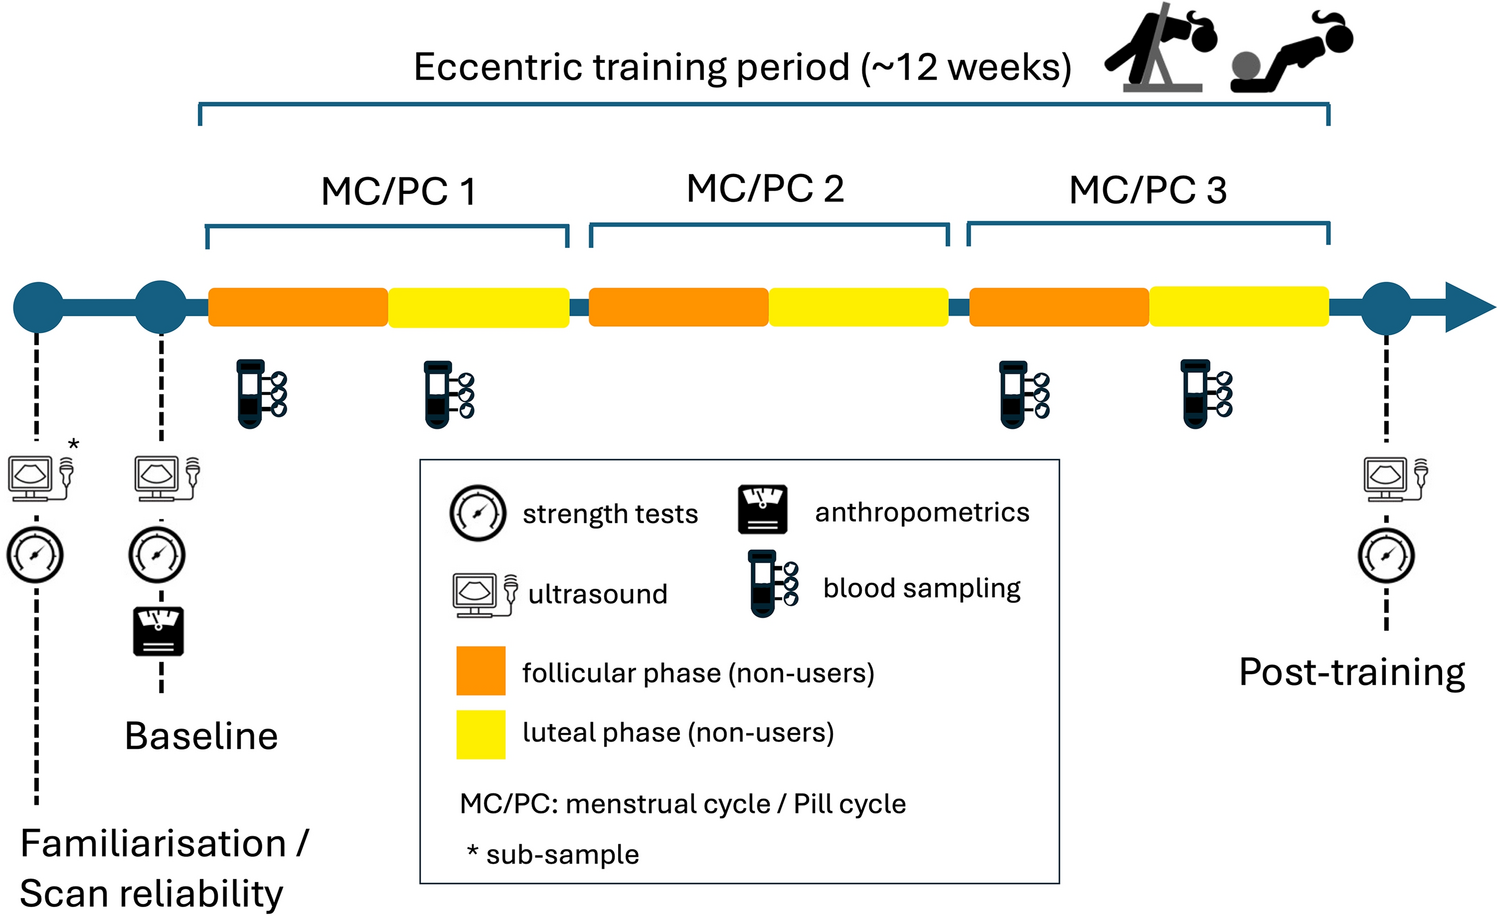
Fig. 1
A schematic overview of the experimental protocol
In the fixed drinking protocol, the participants were instructed to consume a bolus of a low-calorie electrolyte drink (Alienergy, Genki Forest (Beijing) Food Technology Group Co., Ltd.) equivalent to replacing 100% of their body mass lost, within 5 min. The drink was provided at a fluid temperature of 22.2 ± 0.2 °C, measured 273 mOsmol/kg with the following composition per 100 mL: zinc 0.4 mg, carbohydrate 2.5 g, sodium 20 mg, potassium 4 mg, chloride 20 mg, Vitamin E 1.4 mg α-TE, Vitamin B6 0.11 mg. The fixed volume drinking protocol based on nude weight change was consistent with Endo et al. (2012) regarding oral fluid intake on PEH. In the ad libitum drinking trial, participants were allowed to drink freely with the timing and volume of drinking recorded as their drinking behaviour. We selected a low-calorie electrolyte solution instead of water as isotonic solutions with electrolytes could potentially facilitate greater plasma volume expansion and are more ecologically valid.
MeasurementsCore temperatureAs core temperature (Tcore) can modulate changes in post-exercise vascular compliance, which could in turn influence the magnitude of post-exercise hypotension, we measured Tcore to provide insight into this potential mechanism. Tcore was measured by a rectal thermistor (TMQ-DAG, Unimed, China; accurate to 0.1 °C).
CardiovascularHeart rate was recorded continuously from the detection of R–R intervals (Polar Vantage XL, Polar Electro, Kempele, Finland) whilst brachial artery blood pressure was measured manually via sphygmomanometry (Yuwell, Jiangsu, China). Blood pressure measurements were performed in duplicate by the same experienced operator at rest, end-exercise, and every 5 min during the recovery period. Mean arterial pressure (MAP) was calculated as diastolic blood pressure + 1/3 pulse pressure. Vascular stiffness was estimated via brachial ankle pulse wave velocity (baPWV, BP-203RPE III, Omron, Japan) before and after 60 min of the recovery as a surrogate for arterial compliance (Kingwell et al. 1997).
AnthropometricBody height and mass were measured using a stadiometer (Seca, Hamburg, Germany; accurate to 0.1 cm) and scale (Jadever, Taipei, Taiwan; accurate to 10 g).
USG and haematological variablesUSG was measured by refractometer (Palette, Atago, Japan). The blood samples were collected from the antecubital vein at rest and after 1 h of recovery following ≥ 15 min seated rest. Blood samples were dispensed into vacutainer tubes containing clot activator or anticoagulant (K3EDTA). Immediately following the venepuncture procedure, all blood samples were sent to the clinical laboratory located at the University affiliated hospital for the analysis of complete blood cell count (haematological analyser, XN-2000, China), aldosterone (Thermo Fisher, 6.9% intra assay coefficient, sensitivity 4.97 pg/mL) and plasma osmolality (OsmoPro, Advance Instrument, USA), using standard clinical procedures (freezing point). Capillary blood samples were also collected from a fingertip, in duplicate at 12 h prior to dehydration, pre-exercise, immediately following exercise and at the end of the recovery, to provide the time course change in plasma volume from rest, according to the equation developed by Dill and Costill (Dill and Costill 1974) and being analysed for haemoglobin concentration and haematocrit (Hemo Control, EKF diagnostic, Germany).
PerceptionsThirst sensation was measured at rest, end of exercise and at every 5 min interval during the recovery period using the 7-point scale (1 (not thirsty at all)—7 (very very thirsty)) as outlined in the review by Adams et al. (Adams et al. 2020). Rating of perceived exertion was measured using the 15-grade Borg scale ranging from 6 to 20 (Borg 1970).
Statistical analysisBlood pressures were analysed as an absolute value as well as the minimum values for each trial as an indication of the magnitude of PEH. Resting physiological and haematological variables were analysed using one-way repeated measures ANOVA, whilst during recovery all data were analysed using two-way repeated measures ANOVA (trial * timepoints). In all cases, where main or interaction effects occurred, post hoc pairwise analyses were performed using paired t-test with Bonferroni adjustment where relevant. Homogeneity of variance was examined by Levene’s test, and the normality of the data were examined by the Kolmogorov–Smirnov Test and verified by QQ plot inspection and the Anderson Darling Test. All statistical analyses were performed with SPSS software for Windows (IBM SPSS Statistics 20, NY, USA) and figures were produced using GraphPad Prism (Prism version 7.00, GraphPad Software). Data presented are means (SD), unless otherwise stated. Statistical significance was accepted at P < 0.05.
Comments (0)