This systematic review and meta-analysis was conducted in accordance with the Cochrane Handbook for Systematic Reviews and Meta-Analyses [13], the Preferred Reporting Items for Systematic Reviews and Meta-Analyses (PRISMA) [14], and Assessing the Methodological Quality of Systematic Reviews (AMSTAR 2) [15] guidelines. Our study was prospectively registered on the PROSPERO database (registration number: CRD42024595324), and no prior ethical approval was required to conduct this review.
Search strategy and study selection
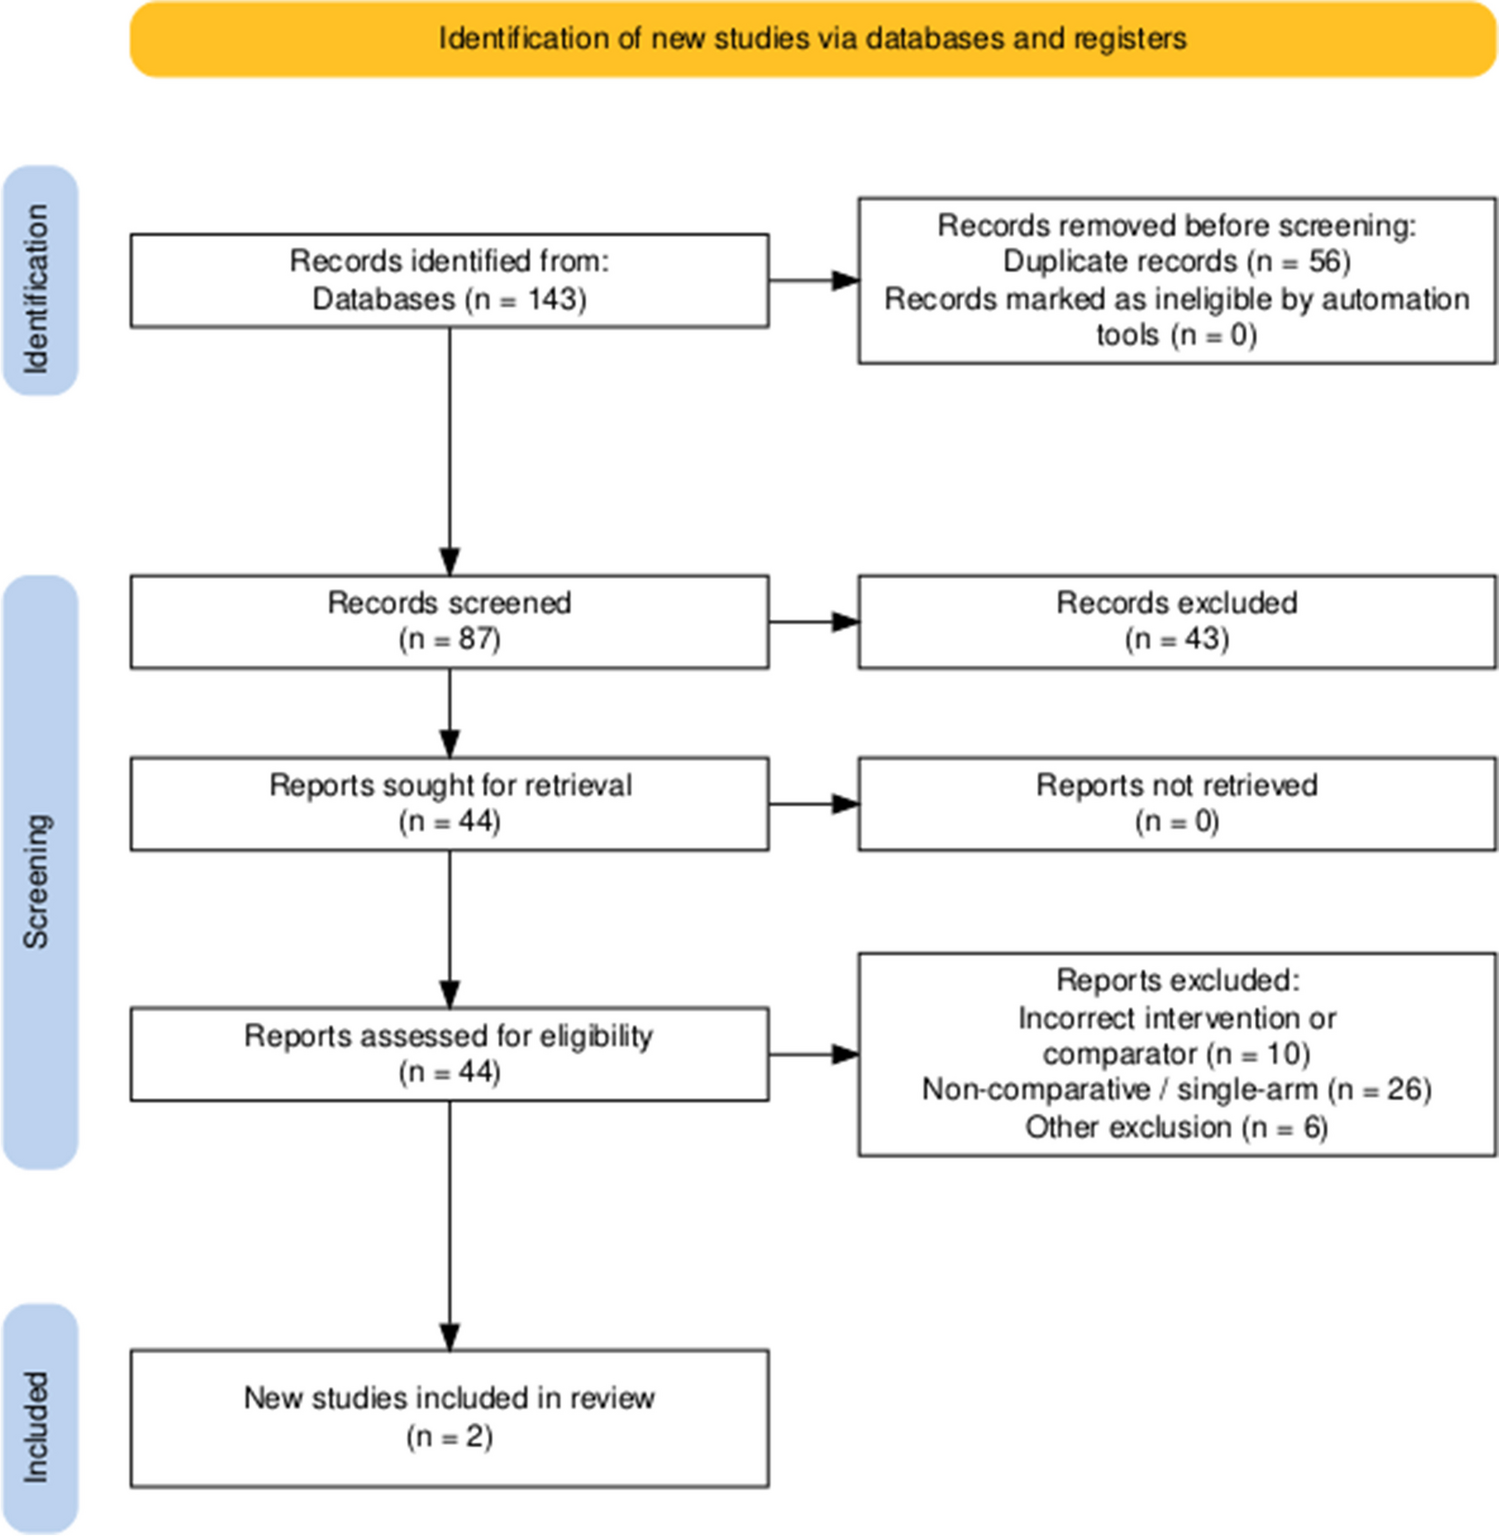
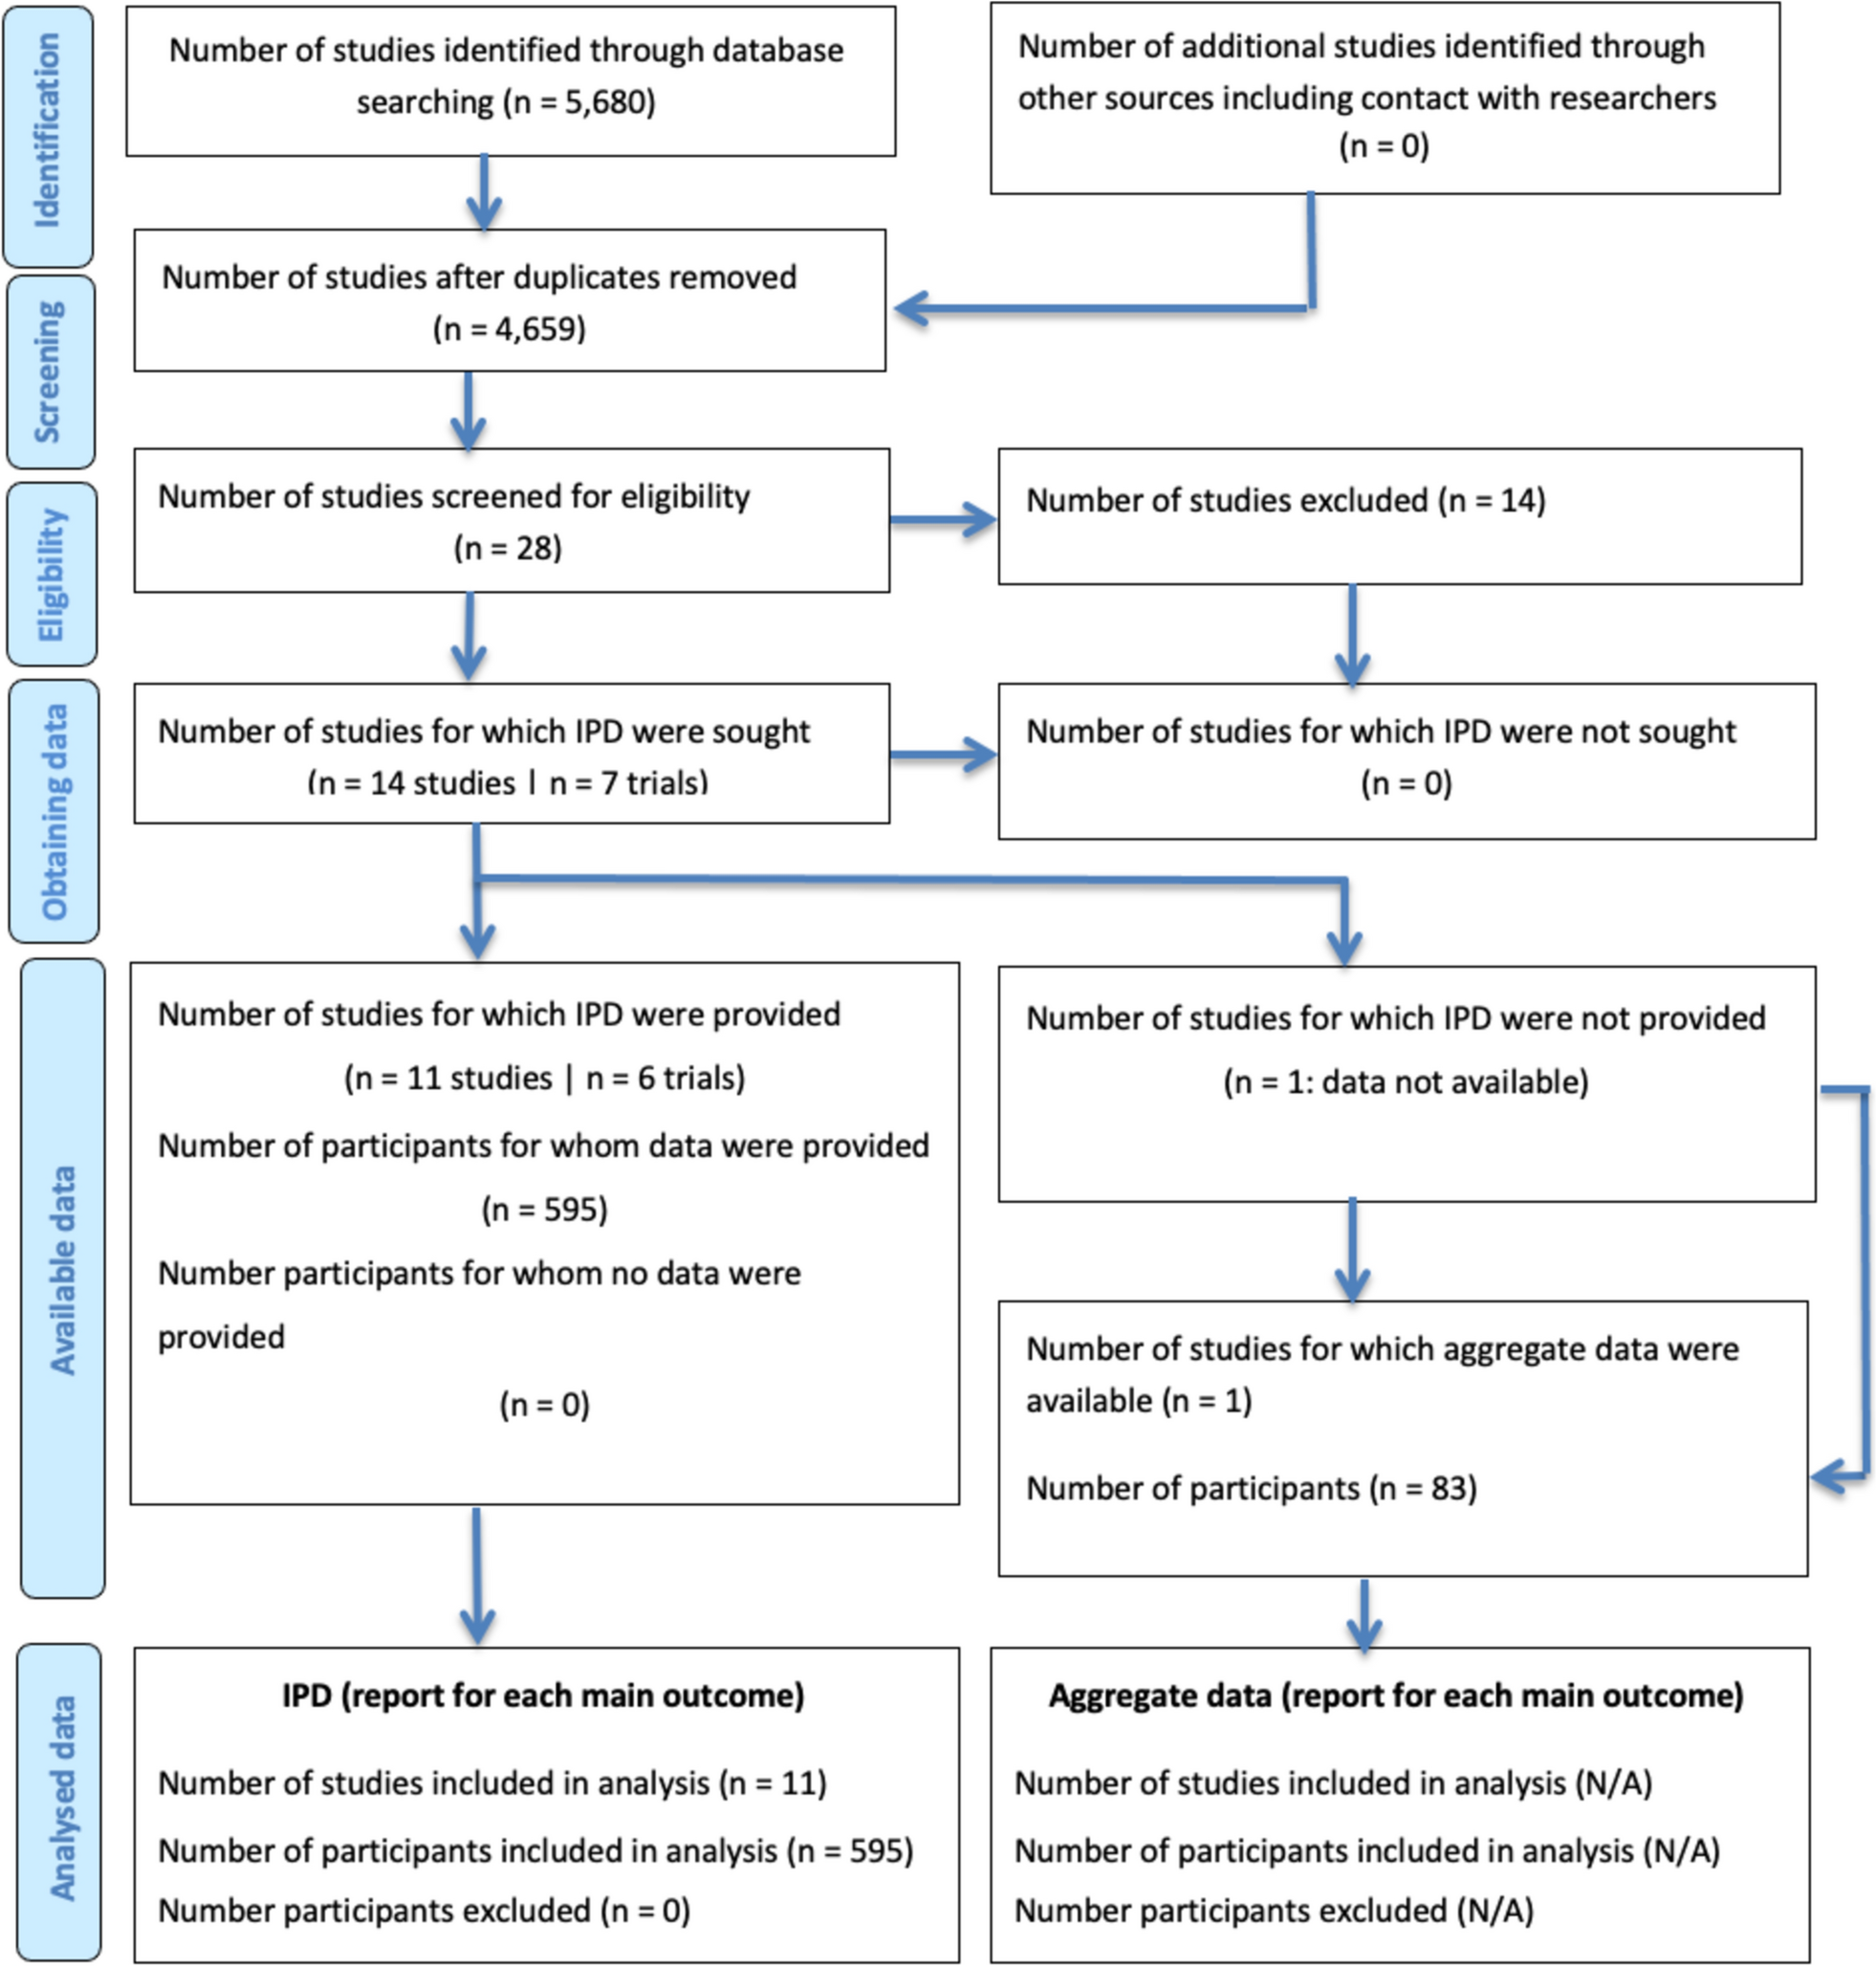
We performed an online search of four electronic databases: Medline, PubMed, Embase, and Cochrane. These data sources were interrogated from inception to 27th September 2024 for all comparative studies of adult patients (> 18 years) with colostomy or previous HP requiring a reversal, either through conventional, multi-port laparoscopy (CL) or single-port laparoscopic reversal (SILS). Our intervention group was SILS and the comparator was CL.
Keywords used in our search included the following: “single-port” OR “single incision” AND “multiport” OR “conventional” OR AND “Colostomy reversal” OR “colostomy closure” OR “Hartmann’s reversal.” Our primary outcomes were operative duration and post-operative mortality rate. Our secondary outcomes were post-operative complications (overall and Clavien-Dindo (CD) grade 3 + complications), length of hospital stay (LOS), re-operation rate, and intra-operative visceral injury. Two authors independently performed the search, title screening, and full-text screening before inclusion. A third author was consulted to resolve any discrepancies arising during this process.
Inclusion and exclusion criteria
Only comparative observational or experimental studies of SILS and CL were included. We specifically excluded studies comparing open surgery reversal, published protocols for clinical trials, single-arm studies, case reports and case series, conference abstracts, online posters, reviews and editorials. No restrictions were applied on language or geographical region.
Data extraction
A Microsoft Excel (Microsoft, v13.5) spreadsheet was created and pilot-tested for data extraction [16]. Data extracted was categorised for both SILS and CL based on study-related data (name of first author, country of origin, title of study, population in each arm, intervention, study inclusion/exclusion criteria, outcomes, and funding), baseline demographics (average age, male gender, smoking, average body mass index (BMI), and American Society of Anaesthesiologists (ASA) 3 + score) and clinical outcomes (mortality, conversion to open surgery, operative duration, visceral injury, failure of procedure, time to first stool, LOS, overall postoperative complications, Clavien Dindo 3 + complications, re-operation, anastomotic leak, bowel obstruction, wound dehiscence, peritonitis, estimated blood loss, and formation of diverting ileostomy).
These are summarized in Tables 1, 2 and 3, respectively.
Table 1 Study-related data for individual studiesTable 2 Patient demographics in included studiesTable 3 Summary of outcomes reported by individual studiesQuality assessment
This review included observational studies only and consequently the star-based scoring system—the Newcastle–Ottawa Scale (NOS) was used [17]. This system assesses the selection, comparability, and ascertainment of exposure in the studied cohorts. A score of 6 or less deems the study to be at high risk of bias (Tables 4 and 5).
Table 4 Newcastle–Ottawa quality assessment scale for cohort studies—Thambi et alTable 5 Newcastle-Ottowa quality assessment scale for case–control studies—D’Alessandro et alStatistical analysis
Statistical and meta-analysis were performed using Cochrane Review Manager [18] (RevMan) (computer program), version 7.2 (Cochrane Collaboration, 2024) based on a random-effects model using the Mantel–Haenszel method. Cochrane Q test was used to assess study heterogeneity and quantified using the (I2) statistic: no heterogeneity at 0%, low heterogeneity at 25%, moderate heterogeneity at 50%, and high/substantial heterogeneity at > 75%.
Forest plots were generated to visually represent outcomes reported by two or more studies with the same variables and units. Dichotomous variables were reported as Odds Ratio (OR) with 95% confidence interval (CI). Continuous variables were reported as mean differences (MD) with 95% CI. The mean and standard deviation (SD) were extrapolated (where necessary) from the median and range of the original data using a validated formula by Hozo et al. [19] Categorical data was reported in the form of percentages or frequency. A P-value of < 0.05 was used as a cut-off for statistical significance in this review.


Comments (0)