
Remember me


The cohort for estimating the current chronic management cost of MI was identified from the VAED. We included people discharged from public or private hospitals across Victoria after admission due to MI (International Classification of Diseases (ICD)−10-Australian Modified (AM) codes: I21-I22) between 1 July 2012 and 30 June 2017 (with follow-up data until 30 June 2018).11,12,13,14 To estimate costs, the Australian Institute of Health and Welfare (AIHW) linked data from the VAED to data from the Pharmaceutical Benefits Scheme (PBS) related to medication dispensing (see Supplementary figure S1 for details) and to data from the Medicare Benefits Schedule (MBS) related to investigations and procedures (see Supplementary figure S2 for details).11 The AIHW also linked the cohort to National Death Index (NDI) to track vital status.11 Hospital admission costs were derived from the National Hospital Cost Data Collection (NHCDC) report covering the years 2012/13 to 2017/18 (see Supplementary Figure S3 for details). Our study adopted a healthcare system perspective, and all costs were adjusted to 2019 AUD using the Health Price Index15 to make the values consistent with the cost burden projection (which begun in 2019).
ExposuresWe stratified the chronic management costs of MI by a number of demographic and clinical characteristics, including age, sex, type of MI (ST-elevation MI (STEMI; ICD-10-AM codes I210-I213) and non-STEMI (I214-I219)), comorbidities (hypertension and diabetes), socioeconomic disadvantage and duration of follow-up (i.e. time since the MI).11 Diabetes and hypertension status were defined via secondary diagnosis codes during admission with MI.11,14 The Australian Index of Relative Socioeconomic Disadvantage (IRSD) was used to summarize information about the economic and social condition within an area.11,16 We assigned an IRSD to each individual based on their last known postcode before admission for MI.11 Using the IRSD, areas were split into quintiles (relative to the entire population of Australia), the first quintile being the most socioeconomic disadvantaged and the fifth quintile being the least disadvantaged.6,11,16
Statistical AnalysisA generalized linear model with a gamma outcome distribution and negative inverse link function, weighted by person-years of follow-up, was used to estimate cost. Univariable models were fit to estimate the overall chronic management cost by age (where age was the mid-point of each age group (in 5-year intervals) and parameterized with spline effects), type of MI, presence of comorbidity status (diabetes and hypertension), socioeconomic disadvantage (IRSD) and year of follow-up. Multivariable models were fitted to estimate the adjusted overall chronic management costs after adjusting for covariates listed above. The crude and adjusted chronic management cost were presented as annual cost per person with the respective 95% confidence intervals (CIs).
Methods for Projecting the Future Cost Burden of Myocardial InfarctionModel OverviewA dynamic multistate Markov model was constructed to project the cost burden of MI for the Australian population aged 30 to 99 years, covering the period from 2019 to 2038 in annual cycles. The main outcome from the model was total healthcare costs—a combination of acute events cost of MI and chronic management cost following MI (i.e. any health-related cost after index MI).
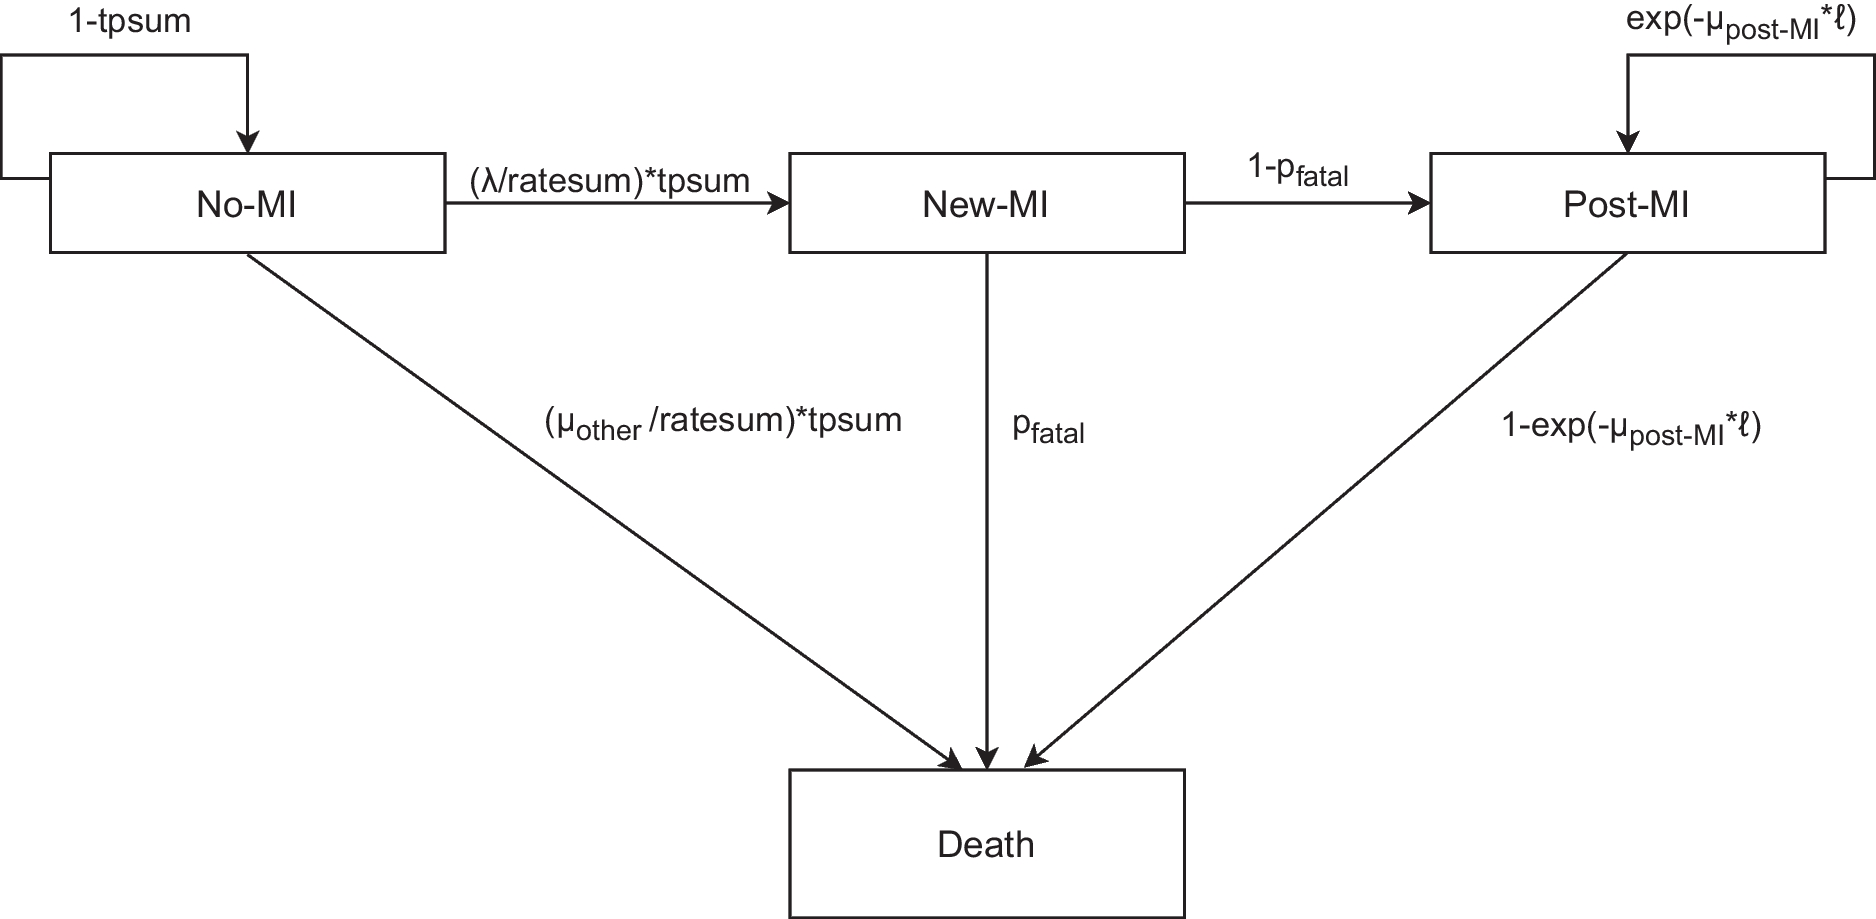
Model StructureThe core dynamic multistate Markov model (Fig. 1) was adopted from a previous Australian projection of health burden of MI for the period 2019 to 2038.13 Briefly, the model constitutes four health states including three alive health states and one death health state (the only absorbing health state). The alive health states were “alive, with no MI”, “alive, new MI” and “alive, post-MI”. The death health state could be due to “death, without MI (i.e. death other)”, “fatal-MI” or “death, post-MI”. Transitions between health states were simulated using a Markov model. The dynamic nature of the model reflects the consideration of demographic change over the course of projection time where people who were aged under 30 years in previous years could enter the model once they reach age 30.
Figure 1
Structure of the multistate Markov model and associated transition probabilities. MI, myocardial infarction; ℓ: 1-year period, λ: myocardial infarction incidence rate, µother: mortality rate for people without myocardial infarction (i.e. other mortality), µpost-MI: post-myocardial infarction all-cause mortality rate, pfatal: proportion of fatal myocardial infarction ratesum: λ + µother; tpsum: 1-exp(-ratesum* ℓ). Ratesum is the sum of incidence rate of Myocardial infarction and mortality rate for people without myocardial infarction (i.e. other mortality); tpsum: transition probability of ratesum.
PopulationThe Australian population aged 30 to 99 years in 2018 was used as the initial population for projection (see Supplementary Table S1).17 This population was then followed in annual cycles from 2019 to 2038. Australian residents and migrants were included in the model throughout the projection time whenever they were eligible to be part of the model (i.e. once they aged from 29 to 30 years at the beginning of each cycle or immigrated into Australia).18 The cohort exited the model under one of the three conditions: (a) after the 20-year follow-up; (b) upon reaching age 99, even if not been followed for the full 20 years; or (c) upon death before the end of follow-up period. The model assumed the age- and sex-specific rates and proportion remained constant throughout the projection period.
Data SourcesData inputs to derive the transition probabilities for the dynamic model were primarily sourced from the VAED. Description of the VAED and data linkage was stated above.11,13 Victoria is the second populous state in Australia with a population of more than 6.5 million (25.6% of the total population) in 2021.19 Furthermore, Victoria has a similar age, sex, socioeconomic status, remoteness and ancestry distribution compared with the total Australian population.19 Thus, our sample is likely reasonably representative of Australia. In addition to the VAED, age-group and sex-specific prevalence of MI and all-cause mortality from the general Australian population was supplemented from the AIHW and Australian Bureau of Statistics (ABS), respectively.20,21
Costs incorporated in the dynamic model were based on the healthcare system perspective. Acute event costs related to hospitalization due to MI were sourced from the NHCDC version 10 round 24 for 2019/20 (see Supplementary table S2).22 In the base case, we assumed that half of the death due to MI (i.e. fatal-MI) occurred while hospitalized and, therefore, would incur acute events cost.6,8 Furthermore, we assumed that the acute event costs were the same by age and sex.22
Chronic management costs were based on the predicted single-year age follow-up costs for the cohort with MI in the VAED. To generate cost inputs for the dynamic model, a generalized linear model was fit with a spline effects of age and time since index MI, and an interaction between the two, stratified by sex. These models were then used to estimate the chronic management cost of MI by sex, age and year of follow-up (see Supplementary Table S3). All costs in projections were adjusted to 2019 AUD using the Health Price Index.15
Estimating Transition Probabilities for the Dynamic Multistate Markov ModelProportions and rates used in the dynamic multistate Markov model were estimated using generalized linear models. Full details of the models applied to estimate the rates and proportion have been described elsewhere.13 The estimated rates were converted to transition probabilities.23
OutcomesOnce the model was populated by the transition probabilities and proportions, outcomes related to health burden of MI were projected including number of MI events and years of life lived with MI.13 To project the acute events cost of MI over 20 years, the acute event cost described above was multiplied by the number of non-fatal MIs and half of the projected number of fatal-MIs. Likewise, the projected chronic management cost was calculated by multiplying the projected years of life lived with MI (undiscounted) with the single year age estimated chronic management cost for cohorts in the VAED. The projected total healthcare cost was calculated by combining the projected acute events cost and chronic management cost. For all projected costs, a 5% annual discounting was applied in the base case.23 The 5% annual discount rate reflects the Pharmaceutical Benefits Advisory Committee guideline for costs and health benefits that occur beyond the first year.24 Projected costs were presented by age-group and yearly projection period, stratified by sex, at a population level.
Sensitivity and Scenario AnalysisTo derive the 95% uncertainty intervals (UI) for the projected cost burden outcomes, Monte-Carlo simulation with 1000 iterations was performed by drawing distributions appropriate for each parameter (see Supplementary Table S4). Scenario analyses were also performed including: (a) varying the discount rate (0% and 3%), (b) considering all people with fatal-IS would incur acute event costs and (c) changing the duration of projection from 20 to 10 years (2019–2028). All analyses were performed using Stata version 18.0 (StataCorp, USA).
Model ValidationModel validation was performed based on the assessment of the Validation Status of Health Economics decision models.25 To check face validity, we compared our projected, undiscounted total healthcare cost of MI for 2019 to 2021 to the AIHW reported cost of coronary heart disease (CHD) for year 2019 to 2021 (for further details, see Supplementary material page 19 and Supplementary Figure S4).15,26,27
Comments (0)