This retrospective cohort study was exempt from review and informed consent by the institutional review board at the University of California Davis (IRB # 2062965-1).
Study Population and Data Source
UCDH encompasses two hospitals of 646 beds, 70 ambulatory clinics, 2200 physicians seeing over a million visits annually, and 160,000 patients across 33 counties. UCDH previously introduced primary care managers assigned to each clinic to coordinate care and respond to patients’ acute clinical decline. To enhance patient care, UCDH developed a machine learning (ML) predictive model to facilitate identifying patients who may benefit from care management services (i.e., future 12-month risk of hospitalization or emergency department (ED) visits). This model used electronic health record (EHR) and claims data to generate input features, ascertain patient outcomes, and define patient subgroups.
Using the BE-FAIR framework, we assessed bias by studying differences in future 12-month predicted versus actual unplanned hospitalizations and ED visits between patients of different race-ethnicity, gender, and location. Location data were used to define social vulnerability by the Area Deprivation Index (ADI)32,33 and California-specific Healthy Places Index (HPI).33 Data was collected from 9/30/2020 to 10/1/2021 with the outcome, unplanned admissions, or ER visits, collected from 10/1/2021 to 10/1/2022. The team used HPI data as it aligned with other state and county-based outreach efforts. (See Appendix: Table A1, metric definitions.) We analyzed all metrics to be complete and valid based on chart reviews of randomly sampled patients and encounters.
Table 1 Bias-reduction and Equity Framework for Assessing, Implementing, and Redesigning (BE-FAIR) Healthcare Predictive ModelsFramework and Approach
UCDH created a multispecialty leadership team to develop a framework to assess, mitigate, and monitor for bias in system-wide predictive models including population health, equity, and information technology experts. Patient input was elicited for aspects of development. The team met bimonthly over 2 years to create and implement Bias-reduction and Equity Framework for Assessing, Implementing, and Redesigning (BE-FAIR) healthcare predictive models, which includes steps to evaluate and mitigate bias in model development and implementation (Table 1).
The team applied BE-FAIR to the population health predictive model. This model provides care managers with predicted probabilities for future 12-month hospitalizations or ED visits for individual patients. Patients above a threshold percentile of risk (i.e., 60% or greater defined due to outreach staff bandwidth limitations) are identified, and, with primary care clinician guidance, determined if they may benefit from program enrollment. If appropriate, staff proactively contact patients, provide needs assessments, and begin pre-defined care management workflows.
Framework implementation as intended for the population health predictive model:
Steps 1–2: Apply an anti-racism lens to proactively identify and address bias and race-based assumptions from the start. Meaningfully engage partners that have insights into the perspectives and experiences of the impacted communities. The team created a charter prioritizing health inequity across all initiative phases that could implement across primary care clinics uniformly. The charter outlined a mission statement aimed to transparently evaluate for bias, defined a diverse planning team, defined model development and evaluation phases, and proactively identified relevant systematic, structural, and interpersonal risks of bias for each phase. For example, the planning team members represented diverse race/ethnicities, community representation, disciplines, clinical specialties, and content expertise. During metric selection, the team assessed for missing data to address potential under coverage bias (i.e., inadequate representation within data), while during the patient engagement phase, the risk of non-response and self-selection bias (i.e., only easy-to-reach patients engage) led to registry-based outreach workflows. Through charter development, there was early recognition that patient care decisions would not be dictated by the predictive model alone but rather final decisions were made by human clinical judgement. The team elicited patient feedback to understand perspectives about the consequences of using the model and how best to communicate about use of computer algorithms in care. They also prioritized routinely examining systems-related root causes (e.g., missing data, outcome prevalence, healthcare access, trust) rather than attributing causes to patient race.
Step 3: Review the history of health system interventions among locally underserved communities.The team reviewed the literature for known risks of bias in population predictive models, including bias caused by missing data, selection of model input features, and outcomes. They also evaluated the local history of mistrust between the health system and local minoritized communities with health equity experts, many of whom grew up in or aware of community perspectives. These interviews identified concern that some metrics were hard to capture among certain groups that may face barriers (e.g., underrepresented communities with lower rates of ambulatory visits or transportation barriers) and have missing data so the team suggested improved raw data collection workflows.34,35,36,37 Some patients also noted competing priorities that made answering the phone difficult during outreach so the team improved workflows to reach out at different times thus allowing patients to engage when they could.
Step 4–5: Disaggregate baseline data for training models across racial, cultural, and socioeconomic demographics. Select technical features with clear causal relationship to the desired outcome, avoiding blind use of classifications such as race, and establish equitable outcomes across different groups as the desired goal. The team assessed baseline data for the availability and quality of data disaggregated by race-ethnicity, gender, and HPI. The team reviewed each candidate model feature and patterns of missing data within patient groups. Discussion points considered how use of differentially missing data may result in underrepresentation of patient groups and choice of metrics including geolocation (e.g., HPI, ADI) and healthcare utilization patterns over time. The outcome measure was predetermined as there was an operational need to reduce unplanned hospitalizations and ED visits. The team conducted additional analyses to assess each outcome alone and combined after assessing differences by race-ethnicity, gender, and HPI. Ultimately, the 31-feature predictive model was developed from 215 candidate features hypothesized to correlate with the outcome.
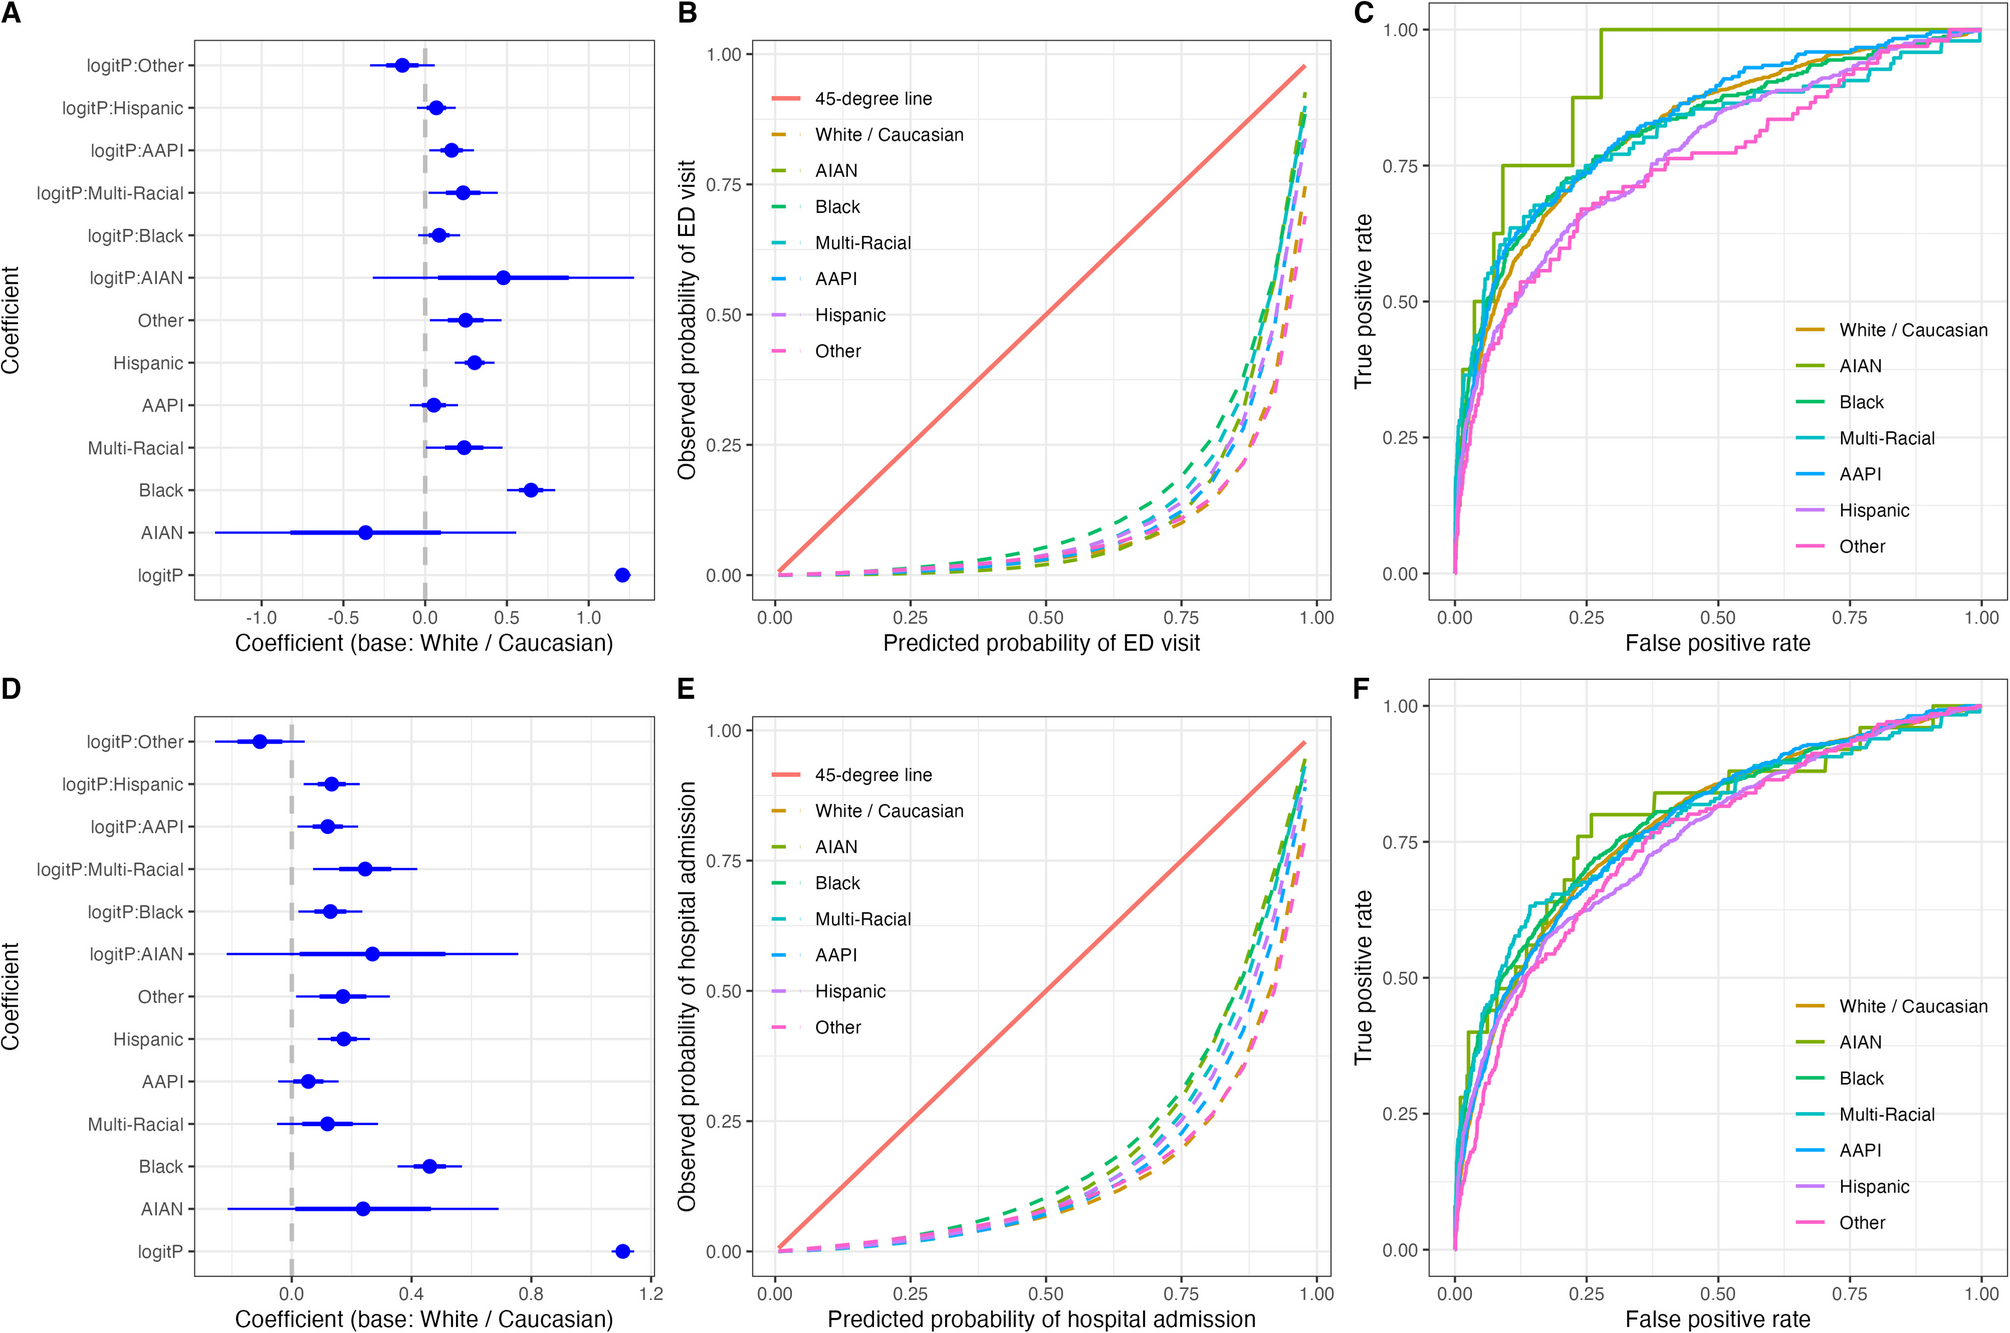
Step 6: Transparently develop and evaluate healthcare predictive models for differential performance among populations or exclusion of patients when models are used to mitigate bias. The team evaluated calibration and discrimination to identify differential performance of the model across groups at different levels of predicted risk to help identify where the model increased risk of bias.
Step 7: Utilize Culturally and Linguistically Appropriate Services (CLAS), cultural humility, and trustworthiness strategies to inform intervention design and implementation:Care management outreach staff were trained on how structural racism and other forms of social disadvantage impact patient engagement and ways to address patient concerns about bias and mistreatment that foster trustworthiness.38 Decisions for patient care (e.g., patient outreach) were not dictated by the predictive model alone; rather, final outreach decisions were made by human clinical judgment (i.e., care management staff assess appropriateness for enrollment based on chart review and patient conversations). The team also exercised transparency by creating an electronic health record smart phrase to explain to patients that a model was used to identify them for outreach.
Step 8: Institute inclusive and equitable continuous improvement: The team performed a formal evaluation of bias (see the “Statistical Analysis” section). The continuous monitoring and oversight for model drift over time (i.e., assessed model performance statistics and population demographic changes) was measured and reported to an institution-wide, multi-disciplinary oversight committee to ensure transparency.
Step 9: Address underlying structural inequities through advocacy, education, and anchor strategies: The team initiated an education program to teach health system leaders on how to utilize the BE-FAIR framework to mitigate bias in other areas. The team also advocated for more culturally informed approaches to engage populations identified in this project and developed regional workforce and procurement anchor strategies to improve the social determinants of health in under resourced neighborhoods.
Statistical Analysis
As part of Step 8, to institute inclusive and equitable continuous improvement, the team assessed model bias in a retrospective cohort using calibration (i.e., comparing predicted risk to observed outcome rates) and discrimination metrics39,40 across pre-specified patient groups. To evaluate differential calibration intercepts and slopes, the team used logistic regression to model observed events over a 12-month period versus the predicted probability from the model (logit transformed) with inclusion of a group variable (race- ethnicity, HPI, or gender) and their interaction with predicted probability. Significant main effects for the group variable indicate differential calibration intercepts and a significant interaction indicates differential calibration slopes by group. We report log odds ratios, 95% confidence limits, and p-values for these analyses. For discrimination, we estimated the area under the receiver operating characteristic curve (AUROC) and compared 95% confidence limits across groups. We further calculated sensitivity, specificity, positive predictive value, and negative predictive value at a decision threshold of 60, selected a priori based on operational constraints. We used standard confusion matrix metrics instead of any single derived fairness metric because they can be directly evaluated for fairness or can be converted to other fairness metrics. Although our model predicted the combined outcome of hospitalization or ER visit, we also evaluated these two outcomes separately. Encounters with missing values for risk scores, gender, race-ethnicity, or HPI were dropped (N = 31,470, 21.6%) after analysis showed no substantive differences between those with or without missing values. All statistical analyses were conducted using R Statistical Computing Software Version 4.2.1.


Comments (0)