
Remember me
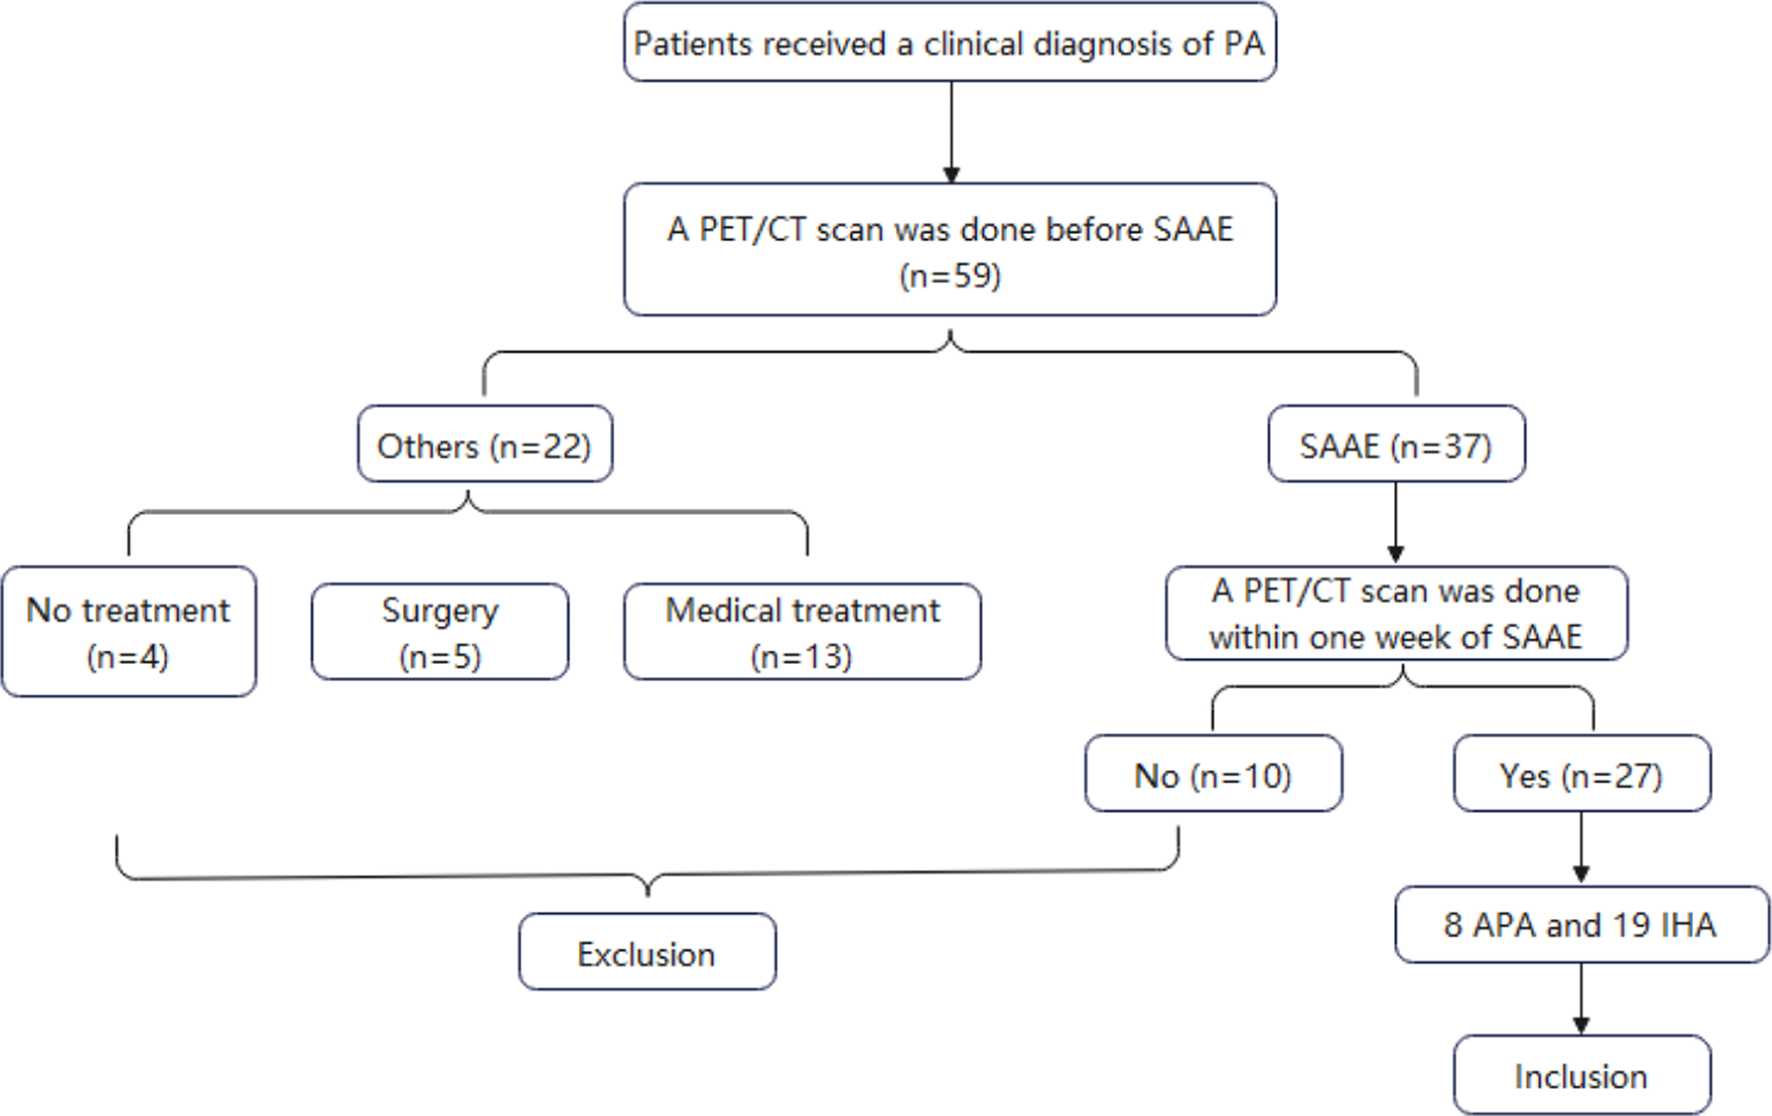


In this study, a total of 27 patients were enrolled, consisting of 10 males and 17 females, including 8 cases of APA and 19 cases of IHA. Patients with APA presented higher aldosterone-to-renin ratio (ARR) values, longer histories of hypertension, and lower potassium levels. In contrast, IHA patients were older and utilized a greater number of antihypertensive medications. However, no significant differences were found in the clinical data between the two groups (P > 0.05 for all comparisons). The basic characteristics of the patients in each group are summarized in Table 1.
Table 1 Clinical Characteristics of 27 Enrolled PatientsAPAChanges in PET/CT parameters before and after SAAEThe changes in PET/CT parameters for the 8 patients with APA before and after SAAE are summarized in Table 2. Postoperative visual analysis revealed a significant suppression of radioactive uptake in the lesions of four patients, accompanied by a decrease in the ARR. This finding suggests that 50% (4 out of 8) of the patients achieved successful embolization treatment. However, the remaining four patients (Patients 1, 2, 4, and 6) exhibited varying degrees of radioactive uptake in their lesions post-surgery, as indicated by visual analysis, highlighting the necessity for further semi-quantitative assessment.
Table 2 Pre- and post-SAAE indicator changes in 8 APA patientsBased on the parameters obtained from PET/CT, 75% (6 out of 8) of the patients demonstrated a significant reduction in these parameters. Although Patients 1 and 2 exhibited some postoperative radioactive uptake, semi-quantitative analysis indicated that both their PET/CT parameters and ARR decreased compared to preoperative levels. This leads to the preliminary conclusion that embolization treatment was also successful for these two cases. Follow-up visits confirmed that both patients achieved partial clinical and biochemical remission. In contrast, Patients 4 and 6 did not exhibit significant changes in PET/CT parameters or ARR before and after treatment. Given the intraoperative vascular embolization and the uncertainty surrounding the embolization effect, the clinicians performed postoperative PET/CT imaging. Finally, by combining clinical manifestations and PET/CT imaging results, the clinicians concluded that the embolization procedure for these two patients had failed, leading to the performance of a second embolization procedure. This suggests that 68Ga-Pentixafor PET/CT can effectively reflect radioactive uptake changes in lesions before and after embolization, providing clinical physicians with imaging evidence that aids in more accurately assessing the effectiveness of embolization treatment and guiding subsequent clinical decisions.
Differences in PET/CT parameters among APA patients with varying therapeutic outcomesClinicians, taking into account the postoperative PET/CT findings, clinical presentation, and intraoperative circumstances, determined that the initial embolization had failed for Patients 4 and 6. Consequently, both patients underwent a second embolization procedure. Follow-up PET/CT scans after the second procedure revealed a significant reduction in lesion radioactive uptake and ARR compared to preoperative levels, indicating the success of the second embolization (as shown in Fig. 2).
Following up on the 8 patients, we systematically evaluated their clinical and biochemical outcomes. The results indicated that, in terms of clinical outcomes, one patient achieved CR, while the remaining seven patients attained PR. Regarding biochemical outcomes, four patients achieved biochemical CR, three patients achieved biochemical PR, and one patient exhibited no significant biochemical response. As shown in Table 3, preliminary analysis indicates that the decrease in PET/CT parameters for patients with biochemical complete remission, including ΔSUVmax (13.58 ± 8.11 vs. 5.20 ± 5.00, 12.78 ± 8.39 vs. 6.00 ± 3.58), ΔLAR (4.18 ± 3.69 vs. 1.17 ± 1.48, 4.28 ± 2.78 vs. 1.11 ± 1.10), and ΔLLR (9.61 ± 7.34 vs. 1.93 ± 2.27, 12.21 ± 8.65 vs. 3.43 ± 2.14), is significantly greater than that observed in patients with partial remission. This finding serves as a valuable reference for assessing therapeutic efficacy.
Fig. 2
Both Patient 4 (row A) and Patient 6 (row D) presented with a soft tissue density nodule in the left adrenal gland before surgery, and visual analysis revealed a significant increase in radioactive uptake in the corresponding area. After the first SAAE, Patient 4 (line B) and Patient 6 (line E) demonstrated continued high radioactive uptake of the lesion, suggesting embolization failure. For further treatment, a second SAAE was conducted, and PET/CT imaging was performed both before and after the procedure. After the second SAAE, Patient 4 (row C) exhibited a significant reduction in radioactive uptake of the lesion, while Patient 6 (row F) demonstrated radioactive uptake similar to that of the surrounding adrenal tissue. In the semi-quantitative analysis, Patient 4 experienced a notable decrease in postoperative SUVmax (23.1 vs. 2.7), LAR (9.63 vs. 0.55), and LLR (19.25 vs. 1.5), ultimately achieving clinical partial remission and biochemical complete remission. Patient 6 also exhibited a downward trend in postoperative SUVmax (11.7 vs. 8.1), LAR (2.49 vs. 1.98), and LLR (5.09 vs. 4.76), ultimately achieving clinical partial remission and biochemical complete remission
Table 3 Variation in PET/CT parameters across distinct therapeutic outcomes in 8 patients with APAIHAChanges in PET/CT parameters before and after SAAEIn this study, a total of 19 patients with IHA were included. Based on the intraoperative embolization findings, 10 patients underwent bilateral adrenal artery embolization, while 5 patients received left adrenal artery embolization. Additionally, due to the narrowing of the adrenal artery, 2 patients achieved successful embolization on the left side but experienced failure on the right, while another 2 patients had successful embolization on the right side but failed on the left.
Focusing on the lesions that underwent successful embolization, visual analysis revealed that only 5 lesions showed a reduction in radioactive uptake, while the remaining lesions exhibited no significant change. Further analysis of the PET/CT parameters for each lesion indicated a statistically significant downward trend in indicators such as LLR-10 min (P < 0.001), TLR-10 min (P < 0.001), LLR-40 min (P < 0.001), and TLR-40 min (P = 0.003) compared to preoperative levels (as shown in Fig. 3). Therefore, for patients with IHA, semi-quantitative PET parameters more accurately reflect the radioactive uptake in lesions before and after surgery than visual analysis does.
Fig. 3
A total of 29 SAAE lesions were observed in 19 patients with IHA. Analysis of the changes in LLR and TLR for each lesion before and after SAAE indicated that the LLR and TLR of most lesions decreased after SAAE, suggesting that SAAE was effective
Relationship between PET/CT parameters and therapeutic outcomes in patients with IHAFor individual patients, the changes in PET/CT parameters for those undergoing bilateral embolization treatment are represented by the average of the changes in both sides.
19 patients with IHA experienced varying degrees of improvement in both clinical and biochemical outcomes (Table 4). In terms of clinical outcomes, 1 patient achieved CR, while 18 patients achieved PR. Regarding biochemical outcomes, 9 patients attained biochemical CR, and 10 patients attained biochemical PR. A more detailed analysis of the PET/CT parameters between the biochemical CR and PR groups revealed that ΔTLR-40 min (P = 0.041) was significantly higher in the biochemical CR group than in the biochemical PR group (Table 5). This finding suggests that a significant postoperative decrease in PET/CT parameters may be associated with a better biochemical efficacy for these patients.
To further elucidate the cutoff value of ΔTLR-40 min between different biochemical outcome groups, a ROC curve analysis was conducted. The results indicated that when ΔTLR-40 min is ≥ 0.07, the biochemical efficacy of patients is significantly better than when it is < 0.07 (AUC = 0.778, P = 0.041) (Fig. 4).
Table 4 Changes in PET/CT parameters across different outcomes in 19 patients with IHATable 5 Changes in PET/CT indicators between different outcomes in 19 IHA patientsFig. 4
ROC Curve for ΔTLR-40 min
Comments (0)