
Remember me
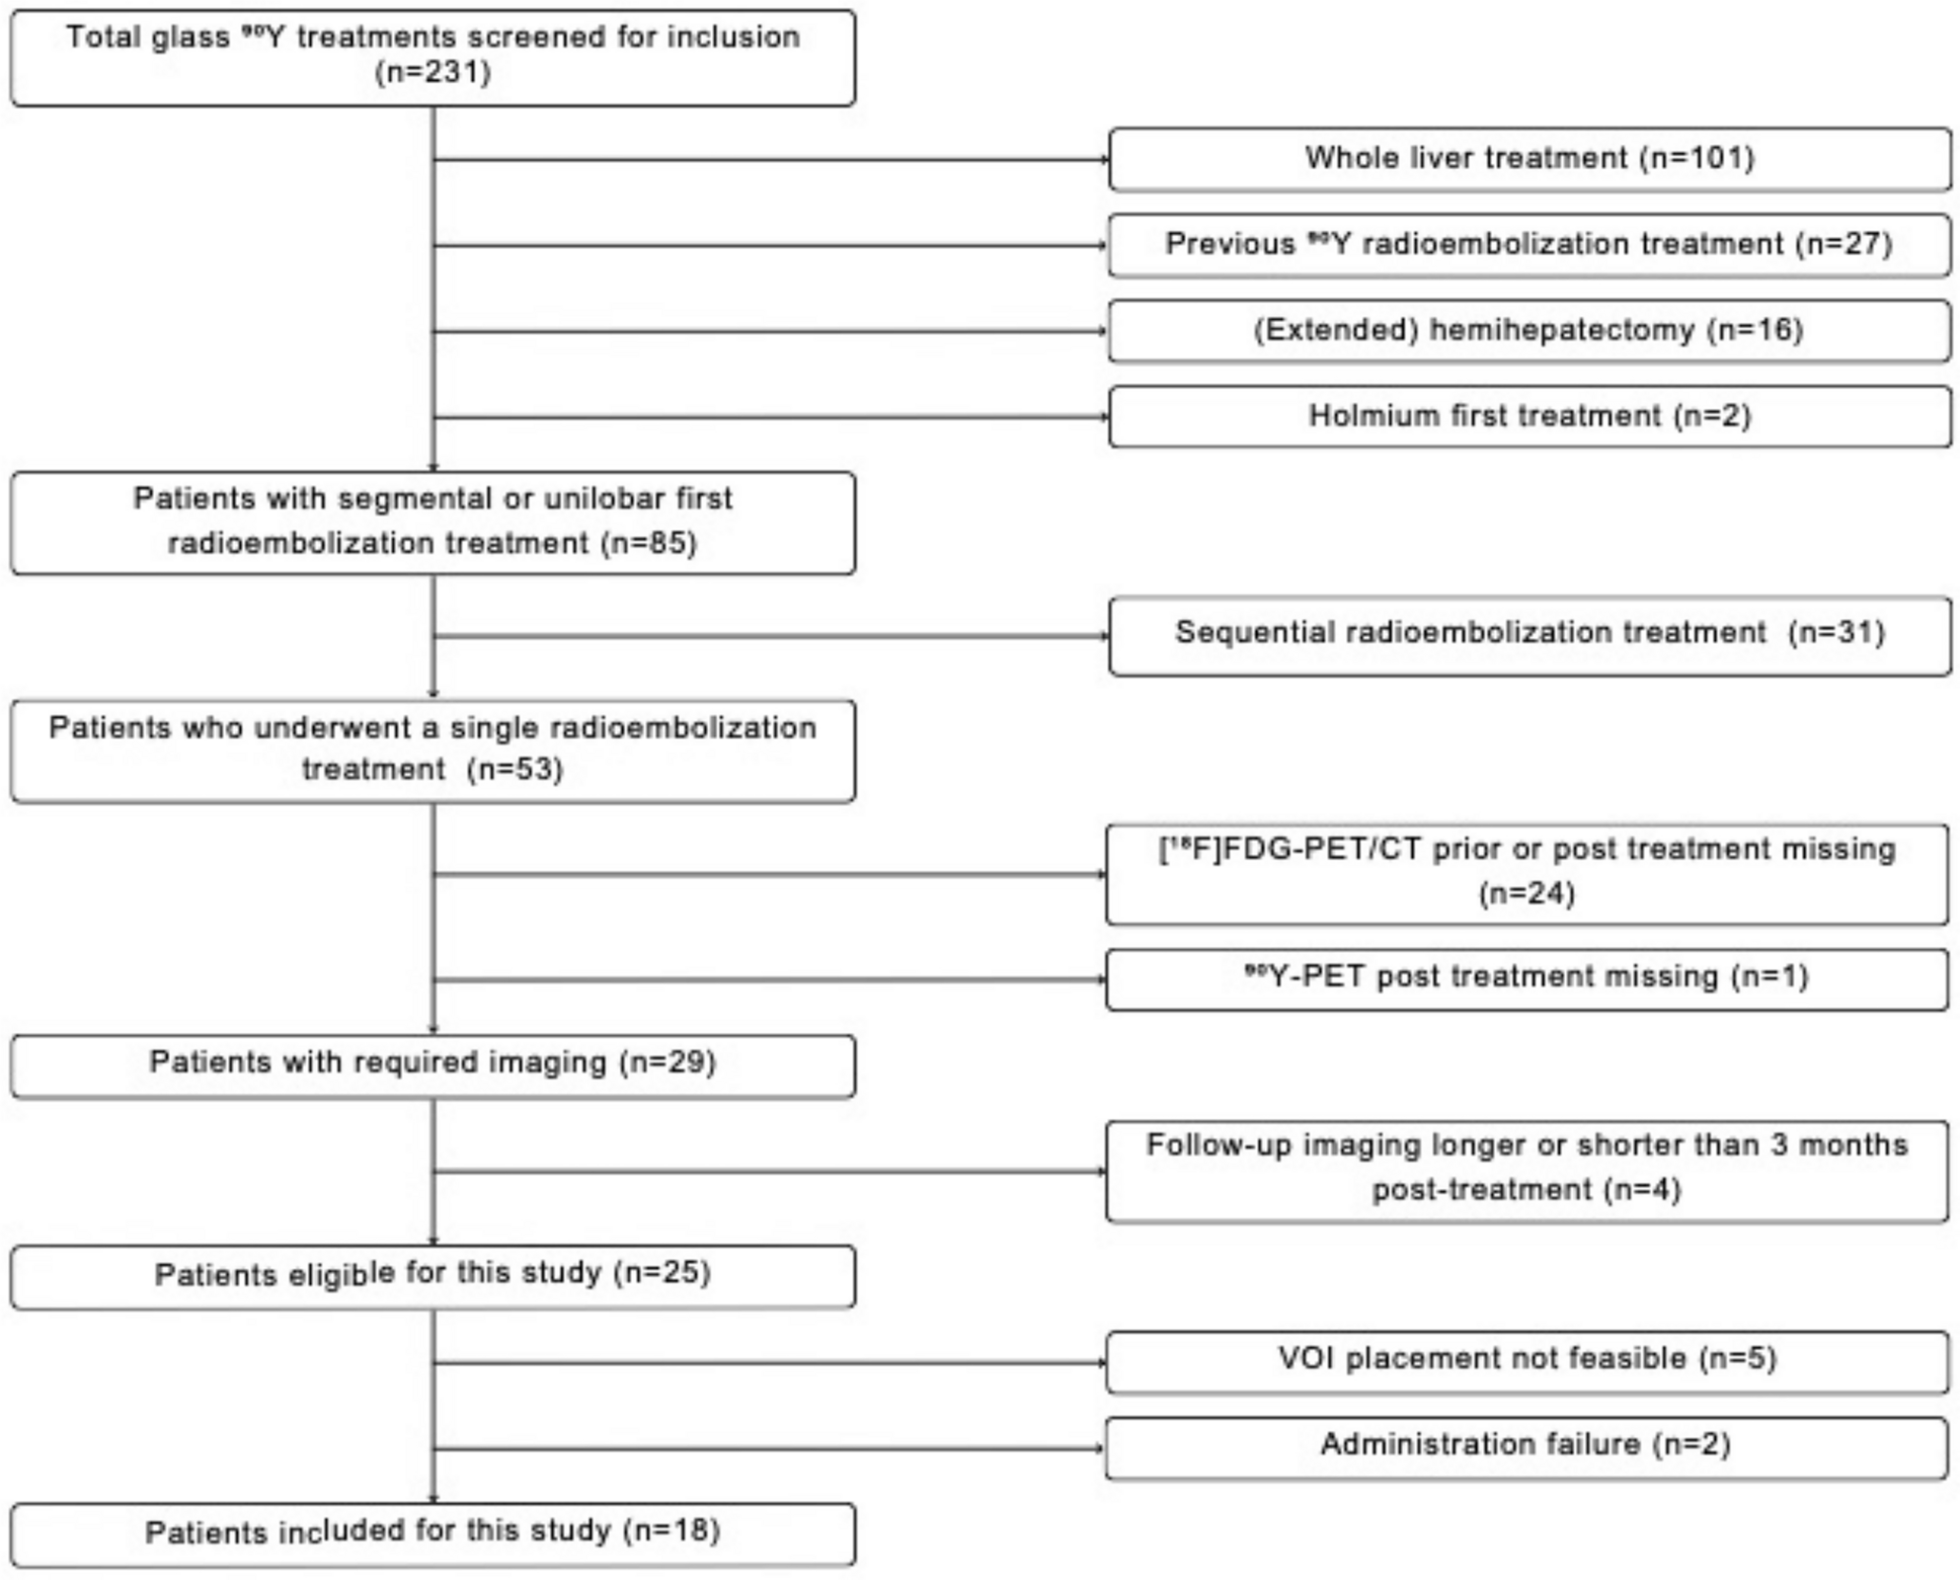
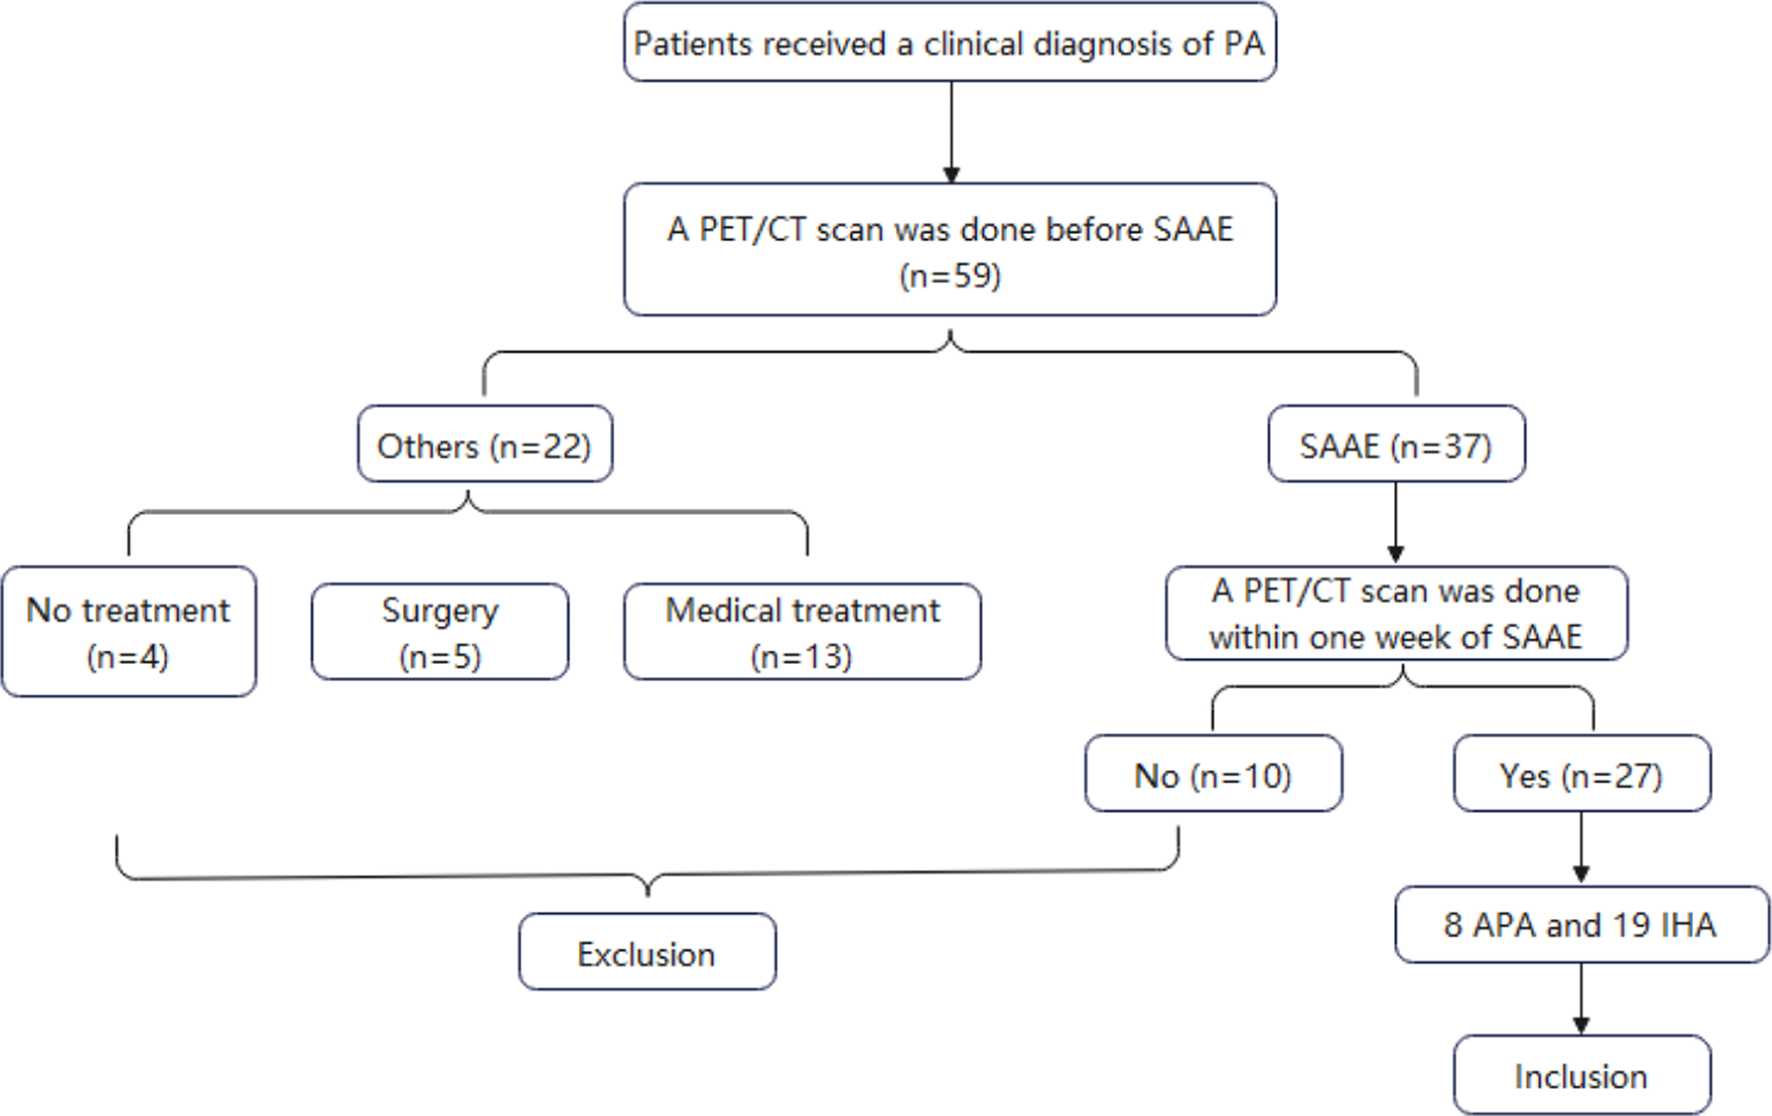


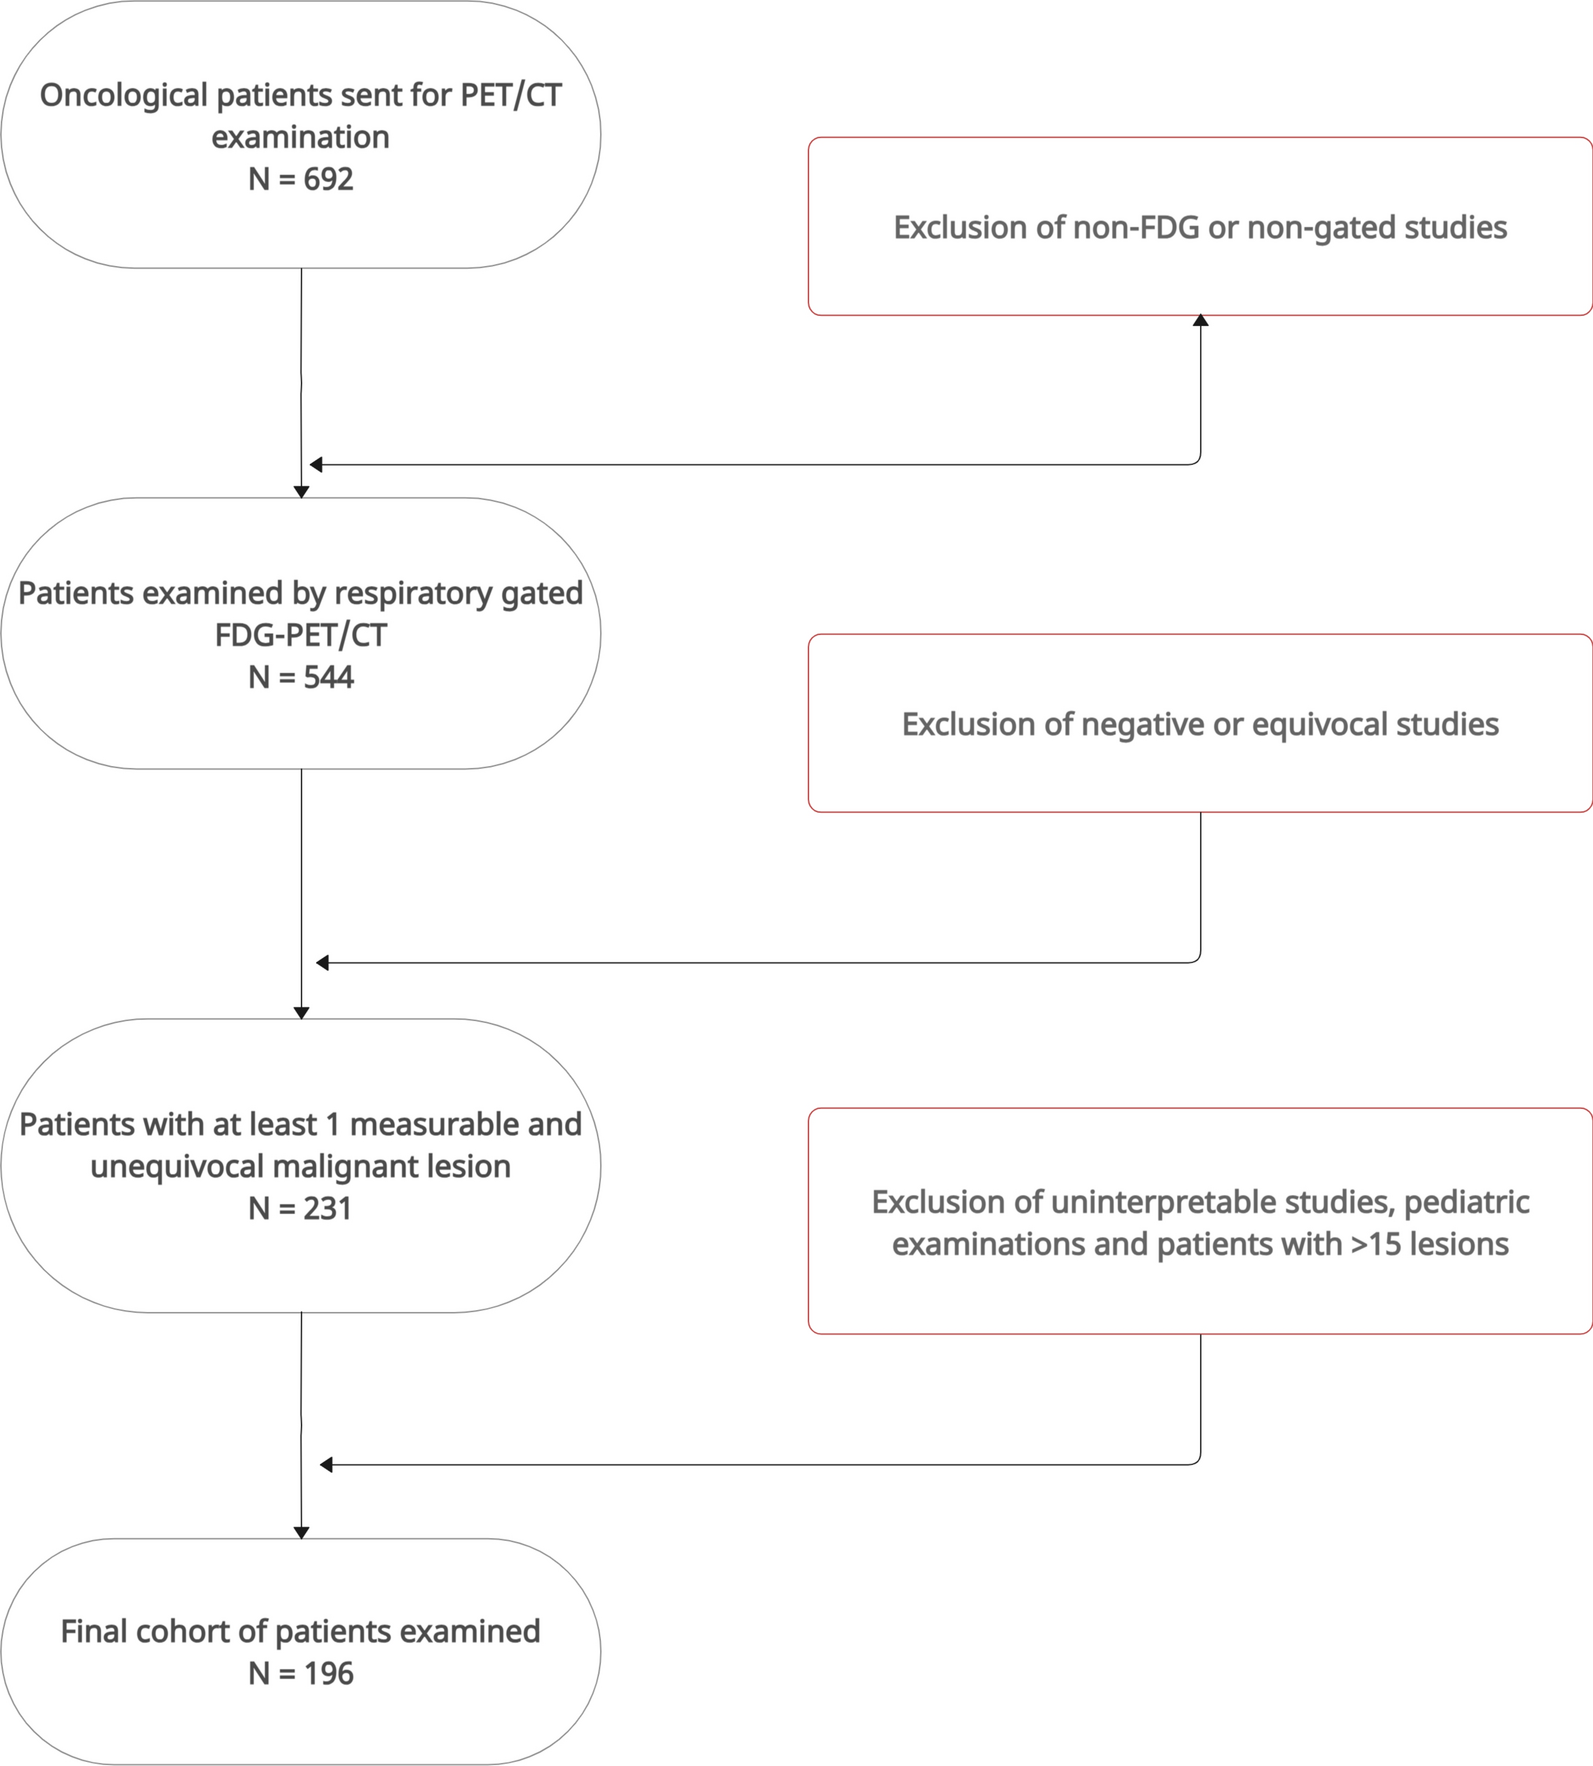
Consecutive patients within a period of 8 weeks were retrospectively screened for inclusion by selecting (Fig. 1) only patients with at least one measurable lesion and excluding non-[18F]FDG PET/CT studies, PET/CT scans without respiratory gating, patients with negative scans, in complete response, with equivocal findings or non-interpretable scans due to technical reasons, and patients under 18 years of age. This study was conducted in accordance to national guidelines and regulations, the requirement for consent being waived according to the national law, the France Reference Method-004. Ethical approval was obtained from the local committee, The Scientific Comission of Therapeutical Trials, IRB no 2024–408.
Fig. 1
Flowchart of study patient inclusion
Patient preparation and PET/CT data acquisition[18F]FDG was administered intravenously to patients, under conditions of fasting for at least 6 h and with a measured glycaemia with a median of 95 mg/dL (range: 72–229), by using a median body weight adjusted-activity of 2.5 MBq/kg, (range:1.71–3.62). PET/CT scans were performed after a median uptake time of 60 min (range: 54–90), on a Siemens™ Biograph Vision 600 digital system in continuous bed motion acquisition mode at a fixed speed depending on the region scanned. PET data were reconstructed using the ultraHD-PET Siemens algorithm (3 iterations, 5 subsets) after data correction for decay, attenuation, scatter and randoms, on a 440 × 440 matrix (isotropic voxel size of 1.65 mm) and a Gaussian filter (3.5 mm FWHM), software version VG80B. CT data were acquired with a free breathing protocol, using a low dose automatic current intensity and tube voltage modulation on a 512 × 512 matrix with a 2 mm slice thickness and a 1 × 1 mm in-plane pixel size.
PET/CT device-based (AZ-733VI, Anzai Medical Corporation) and data-driven respiratory-gating methods (OncoFreeze AI™), using 100% of acquired true coincidences, were used for all patients included.
Device-based and data-driven respiratory PET-gatingThe device employed for external respiratory signal recording, the AZ-733VI, a pressure-sensitive belt, was placed around the base of the patients’ thorax, corresponding to the level of the largest expected magnitude of respiratory-induced displacement.
The data-driven method for respiratory signal extraction from PET raw data, the OncoFreeze AI™, applies spectral analysis on temporally sliced and transaxially downsampled PET histo-projection volumes, after determining the anatomical region by the landmark-based machine learning algorithm ALPHA and partitioning the whole axial extent in 80 mm subvolumes with 70 mm overlap; this method was clinically validated by Buther et al. [9].
After the acquisition or derivation of the respiratory signal, the PET data are reconstructed using an elastic motion correction algorithm, validated by Meier et al. [10], which exploits 100% of the acquired PET signal. Briefly, an optimally amplitude-based, end-expiration, gated PET reconstruction is non-rigidly registered by way of a mass preserving optical flow estimation to the non-gated reconstructed data. In this manner, a fully 3D blurring kernel is calculated and included in the forward projection phase during the reconstruction process, obtaining, after backprojection, a deblurred and motion corrected image.
MeasurementsFor the purpose of this study, all identifiable lesions were reviewed and included, independent of location, by taking into account the nuclear medicine physicians’ reports of positive imaging findings and the ability to confidently measure the lesions. A nuclear medicine physician (LA) measured the SUVmax, SUVpeak and metabolic tumor volume (MTV) by semi-automatic segmentation of lesions, thresholding with 50% of the SUVmax for the ungated, belt-gated and data-driven reconstructions (PET-UG, PET-BG and PET-DDG). The fixed 50% of SUVmax threshold for lesion segmentation was chosen from results in literature on lung lesions [11] and also for enabling comparison with a similar large cohort study [12]. Additionally, reference organs routinely used (blood pool and liver) for oncological [18F]FDG PET/CT studies were sampled by SUVmean and the standard deviation of the uptake, following the recommendations of PET Response Criteria in Solid Tumors (PERCIST) [13] guidelines (30 mm sphere in the right liver lobe and a 10 mm cylindrical VOI in the descending thoracic aorta). These values were used to calculate the threshold for lesion measurability as defined in the PERCIST criteria (i.e. SUVmean liver × 1.5 + 2 × standard deviation liver or SUVmean blood pool × 2 + 2 × standard deviation blood pool), in order to define a virtual PERCIST baseline scan subgroup of patients, and also to calculate the signal-to-noise ratio in these regions as the inverse of the coefficient of variation (i.e. SUVmean/standard deviation for liver and blood pool).
In the case of patients with more than 5, but up to a maximum of 15 lesions, the two most [18F]FDG avid ones were chosen for each organ involved up to a maximum of 5 lesions per patient, and in the case of disseminated bone disease the most avid bone lesion for each level of the body was measured (i.e. head, cervical, thoracic, abdominal, pelvis, proximal and distal extremities).
Data analysisDifferences in the PET metrics were expressed by calculating the percent differences between the gating methods \(\left|A-B\right|/\left(\left(A+B\right)/2\right)*100\)), where A stands for the data-driven method and B for the gold standard device-based one (i.e. ΔSUVmax, ΔSUVpeak and ΔMTV), and by analysing the spread of the Bland–Altman plots. Assuming a normal distribution of between methods differences, we estimated the 95% confidence intervals (CI) of the measured bias. A threshold of 10% was established to evaluate clinically relevant differences between methods. This threshold was chosen based on the QIBA FDG-PET/CT profile recommendations [14], which indicate that under identical acquisition and processing conditions, SUV measurements should demonstrate test–retest coefficient of variation of ≤ 10%. While this threshold was originally established for comparing measurements under identical conditions, we employed it as a conservative benchmark to evaluate differences between gating methods, acknowledging that comparisons between different gating techniques may inherently show greater variability Also, we computed the proportion of patients above the chosen 10% threshold.
Reference tissue differences between PET-UG, PET-BG and PET-DDG were tested by one-way repeated measures ANOVA for the normally distributed data, with multiple comparisons done with Tukey correction, while a Friedman test with Dunn correction for multiple comparisons was applied to the non-normal data.
As stated above, a subgroup of patients was formed by selecting them according to the PERCIST criteria for a baseline scan, including only one lesion per patient with the [18F]FDG uptake above the background reference values (liver or blood pool) and with a lesion size greater than 10 mm in the largest axis, size chosen in order to reduce the impact of partial volume effects.
Finally, we evaluated the potential effects of two common confounding factors on the impact that respiratory motion has on SUV measurements: lesion size and anatomical position. The anatomical localisation was divided into 7 regions: head-neck, upper thorax, lower thorax-upper abdomen soft tissue, lower thorax-upper abdomen bones, abdomen-pelvis soft tissue, abdomen-pelvis bones and extremities. A multilinear regression analysis was chosen to evaluate the impact of these two confounders, with p values less than 0.05 indicating statistical significance. All data analysis and graphical representations were realised in Prism, version 10.1, with the exception of the flowchart diagram, designed in a web-based software, Creately.
Comments (0)