
Remember me
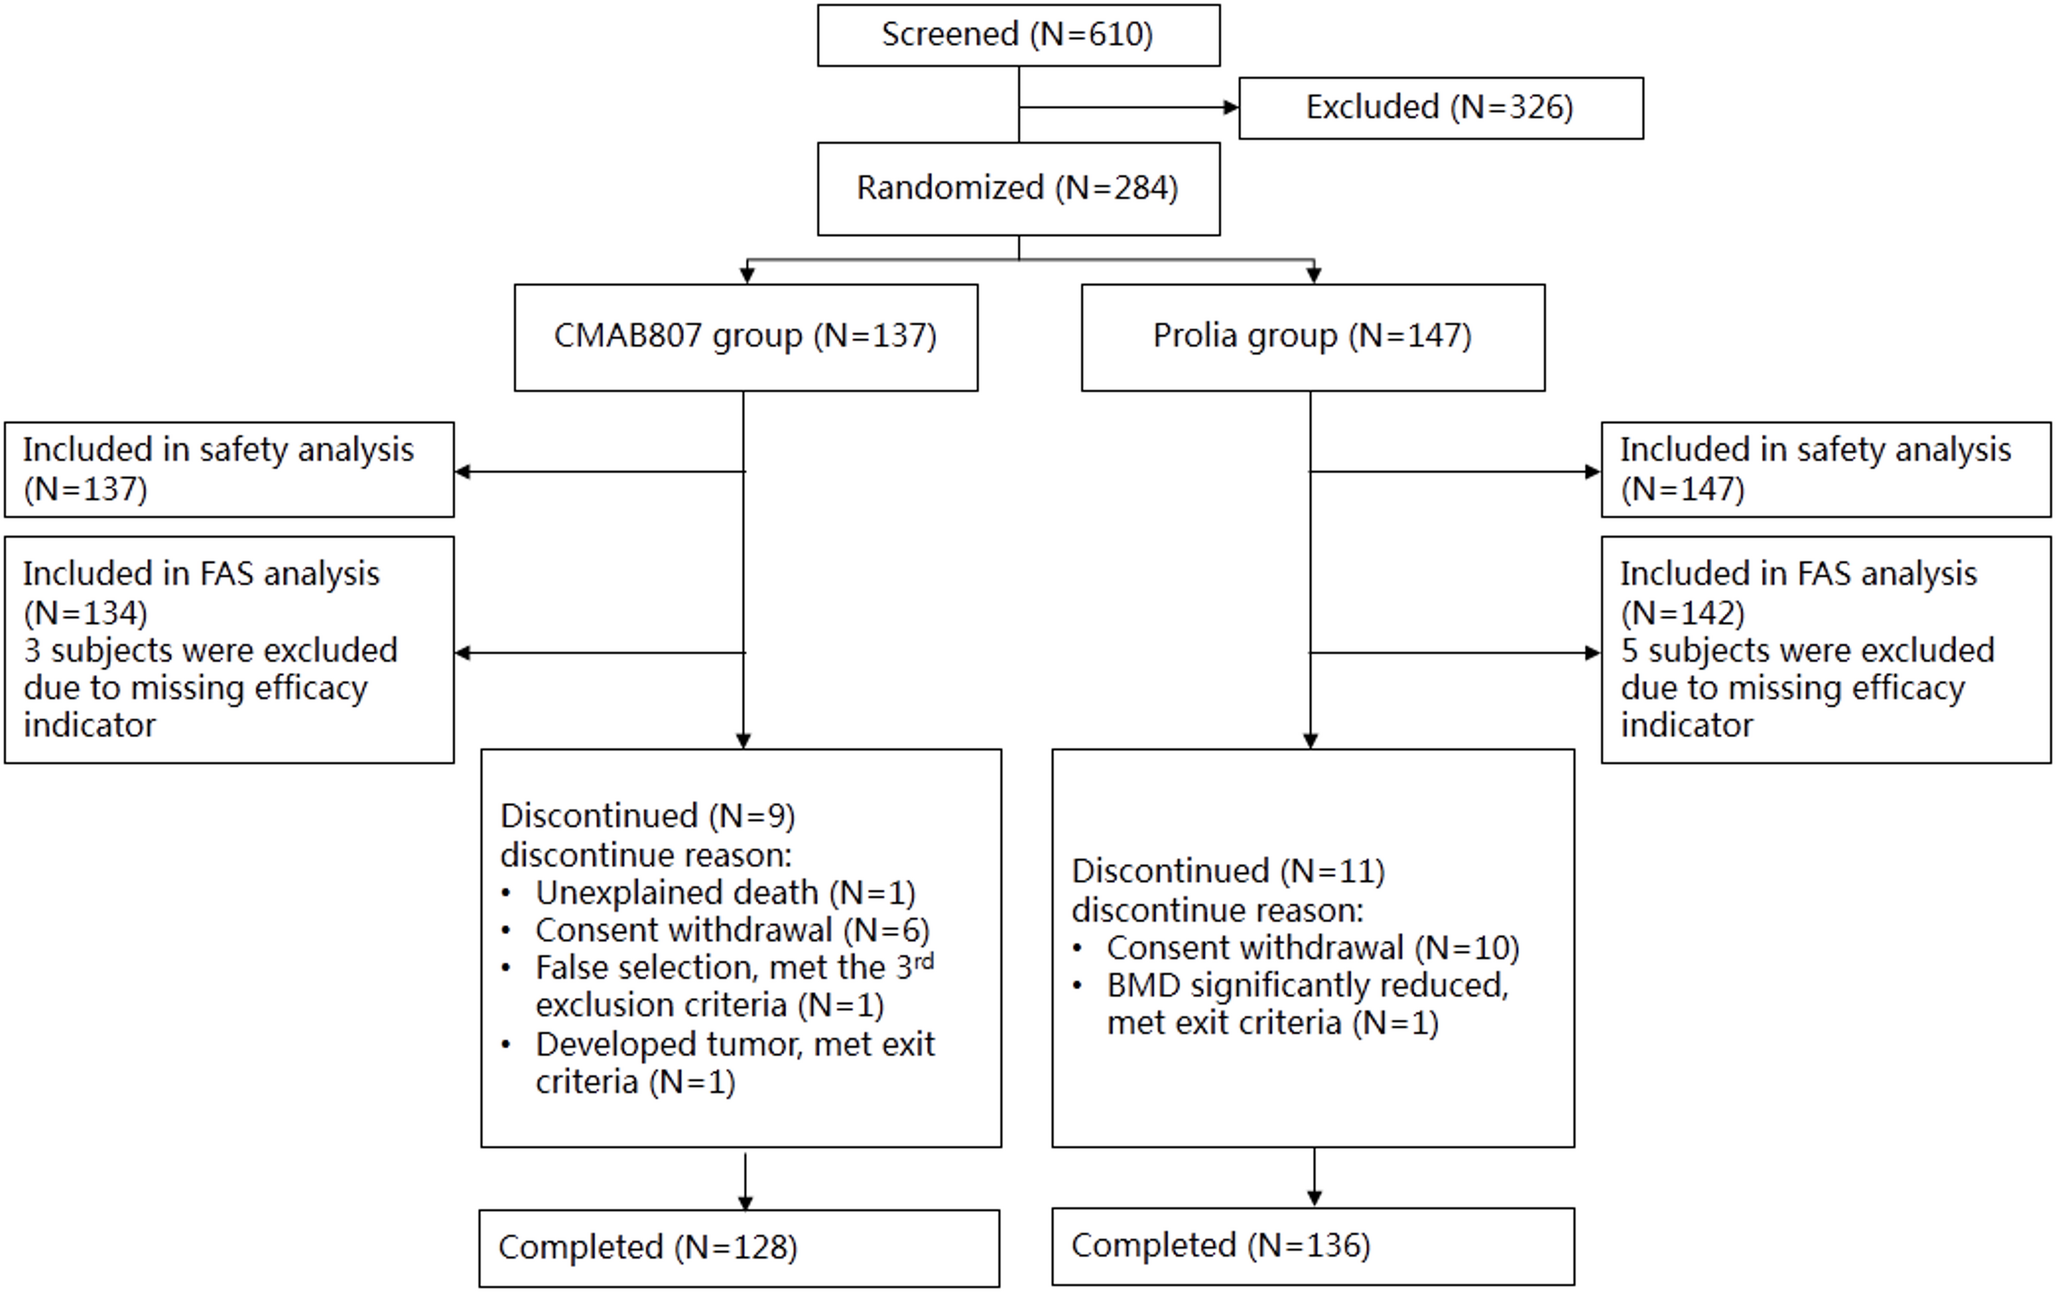
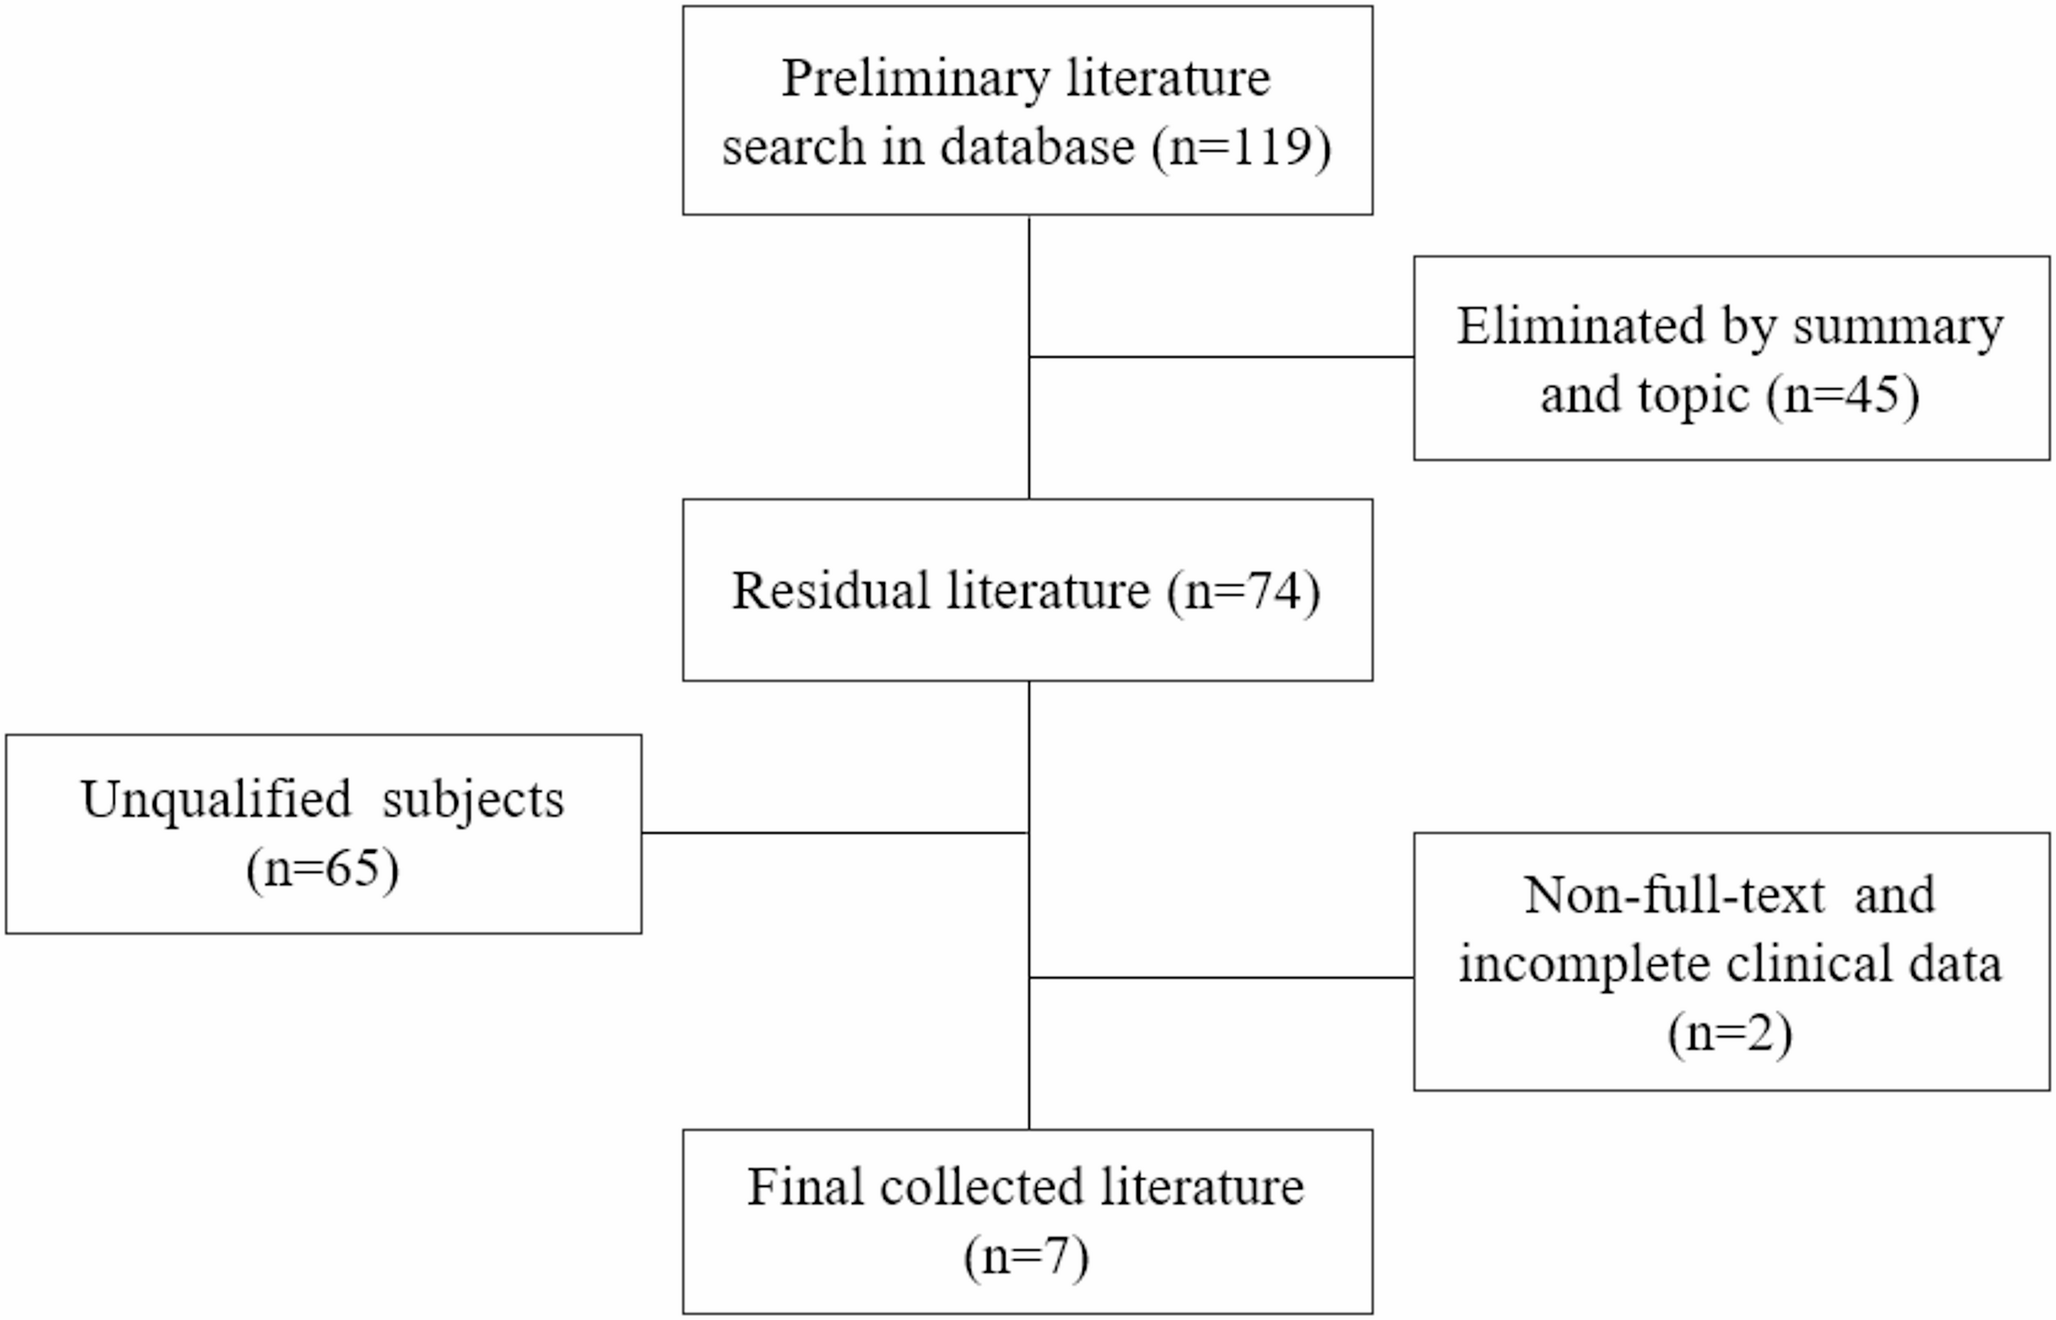
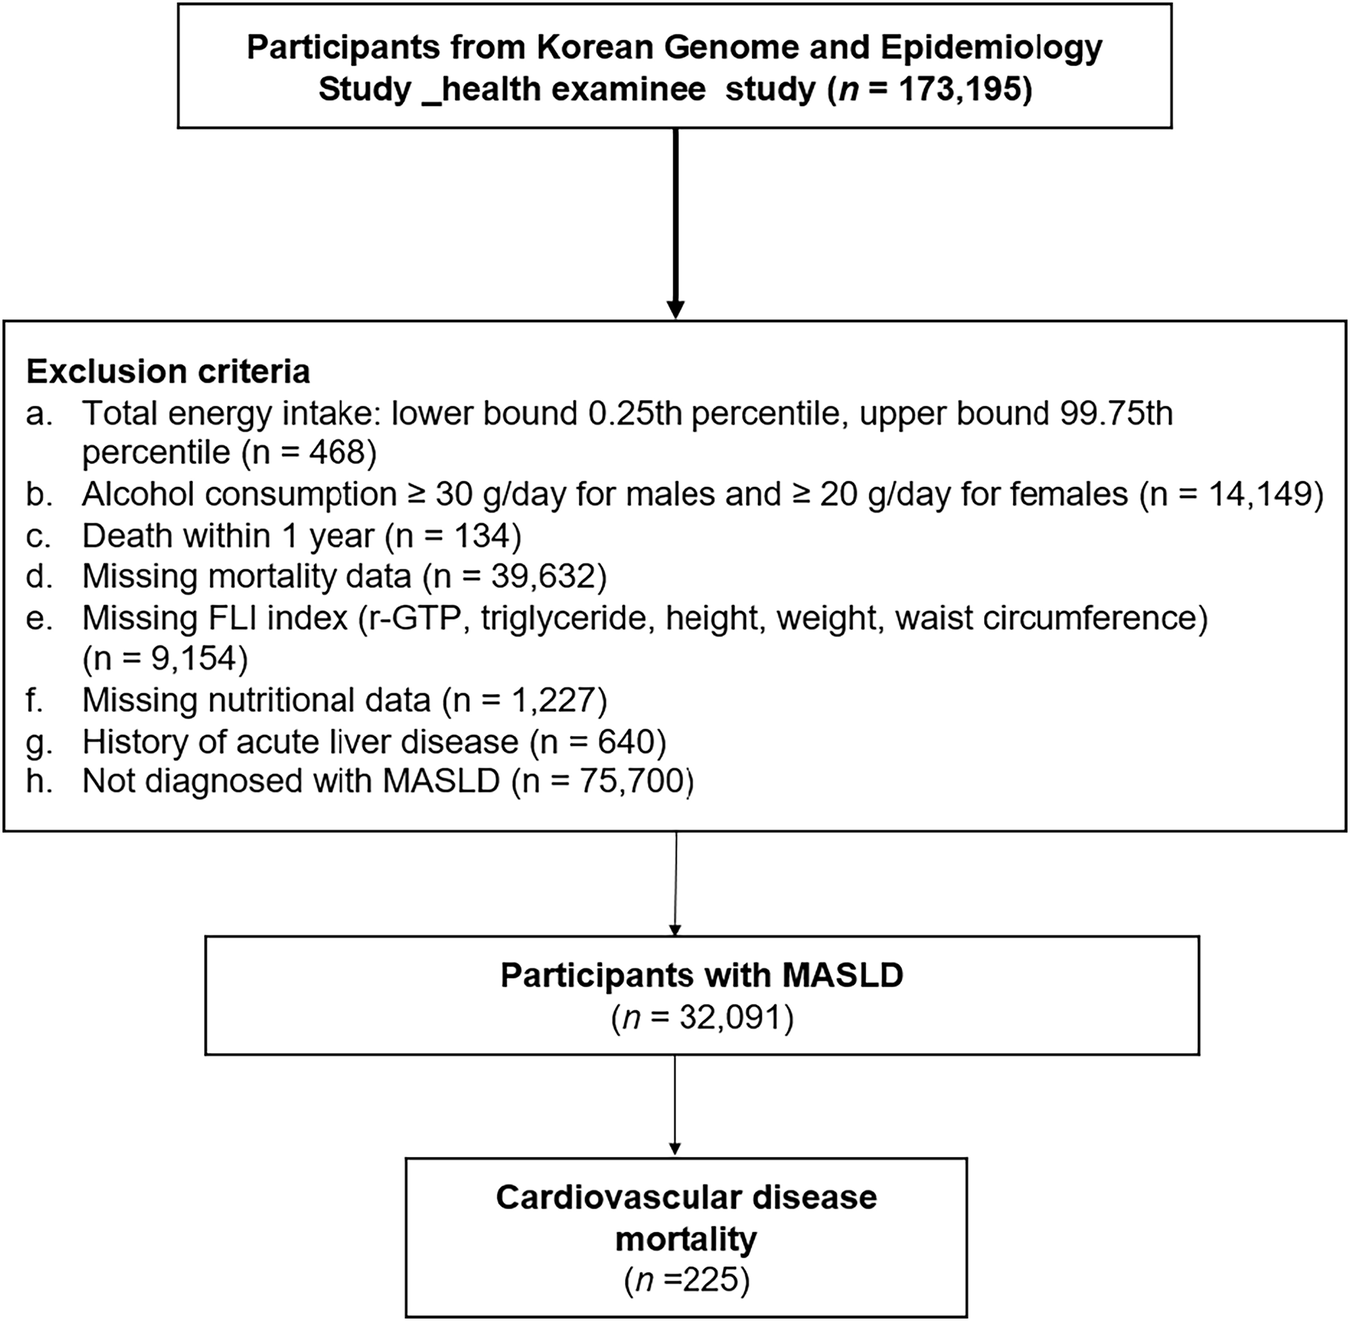
At the time of model establishment, a total of 264 patients who underwent right lateral biopsy or dissection at Affiliated Drum Tower Hospital, Medical School of Nanjing University from January 2017 to August 2022 were included as shown in Fig. 1. They were divided into two groups based on whether the right lateral lymph nodes had metastasized after surgery: the right lateral lymph node metastasis group (163 cases) (pN1b) and the right lateral lymph node non-metastasis group (101 cases) (pN1a or pN0). The basic characteristics of the clinical data of the 264 patients included in the study are shown in Table 1.
Fig. 1
Sample selection criteria
Table 1 Analysis of baseline characteristicsAmong them, there were no statistical differences in encapsular or extraglandular invasion, number of primary tumors, FT3, TT3, FT4, TPOAB, TGAB, TSH (p > 0.05). There were statistical differences in age, gender, maximum diameter of primary tumor, number of right NLN-prRLN metastases, number of right LN-prRLN metastases, TT4, and TG (p < 0.05).
Univariate and multivariate analysis of lymph node metastasis in the right lateral regionVariables with statistical differences in baseline analysis are included to conduct univariate analysis. The age cutoff of 55 years old was determined based on guidelines [4]. The number of NLN-prRLN metastases, TT4, TG, and right LN-prRLN metastases were categorized using the best predictive threshold on the ROC curve. The results of the univariate analysis are shown in Table 2. The differential indicators in the univariate analysis were included and subjected to logistic binary regression analysis. The results are also shown in Table 2. It can be found that age ≤55 years old(OR = 0.390, 95%CI: 0.197–0.774), male gender(OR = 1.968, 95%CI: 1.004–3.856), maximum diameter of primary tumor >1.35 cm(OR = 2.958, 95%CI: 1.474–5.935), right NLN-prRLN metastasis(OR = 2.688, 95%CI: 1.439–5.021), right LN-prRLN metastasis(OR = 3.112, 95%CI: 1.588–6.100), TT4 ≤ 89 nmol/L(OR = 0.426, 95%CI: 0.224–0.809), and TG > 37.5ug/L (OR = 2.078, 95%CI: 1.058–4.081) are independent risk factors for metastasis to the right lateral region. Additionally, due to the concentrated distribution of LN-prRLN metastasis on the right side, the author attempted to incorporate the number of right LN-prRLN metastasis into the model as multi-classification data. However, compared with simply including the presence or absence of right LN-prRLN metastasis, the model’s discrimination did not significantly improve. To simplify the prediction model and improve its efficiency, it was decided to include the right LN-prRLN in the model as a binary classification based solely on the presence or absence of metastasis.
Table 2 Univariate analysis of lymph node metastasis in the right lateral regionEstablish the model and draw the model column chart, relative operating characteristic (ROC) curve, and calibration curveUsing the coefficients mentioned above, a prediction model was developed for lymph node metastasis in the right lateral neck region. In R4.3.1, a static column line diagram was created to illustrate the importance of variable influencing factors, as depicted in Fig. 2. The most crucial factor for predicting lymph node metastasis in the right lateral neck region was the presence of right LN-prRLN metastasis, while age > 55 years and TT4 > 89 nmol/L levels served as protective factors.
Fig. 2
Static column line diagram
Furthermore, an ROC curve was generated using SPSS 26.0, as shown in Fig. 3. The area under the ROC curve (AUC) was calculated to be 83.0% (P = 0.000, 95% CI = 0.781,0.880), with an optimal diagnostic threshold of 0.595. At this threshold, the model exhibited a sensitivity of 81.6% and a specificity of 75.2%. To internally validate the model, the Bootstrap repeated self-sampling method was employed in conjunction with R4.3.1. The model underwent 1000 rounds of resampling, and a calibration curve was plotted. The model’s average absolute error was determined to be 0.02, as depicted in Fig. 4.
Fig. 3
ROC curve of training set
Fig. 4
Calibration curve of training set
Utilizing models to predict validation set data and draw ROC curves and calibration curvesIn SPSS 26.0, a constructed model was utilized to predict and generate the ROC curve for lymph node metastasis in the right lateral region. This was performed on the validation set and Fig. 5 illustrates the results. The area under the curve (AUC) was determined to be 84.8% (P = 0.000, 95% CI = 0.741, 0.956). Utilizing the threshold value in the training set, the sensitivity of the model was 73.3%, while the specificity was 77.3%.
Fig. 5
ROC curve of validation set
To further evaluate the model, R4.3.1 was employed to perform internal validation through resampling 1000 times using the same training set. The model calibration curve was then plotted, as demonstrated in Fig. 6. The average absolute error observed in this process was 0.054.
Fig. 6
Calibration curve of validation set
Draw the decision curve analysis (DCA) and clinical impact curve of the modelTo evaluate the net benefit of the model, compare the net return of this model with the model established by incorporating risk factors as continuous variables and draw a DCA decision curve. Compared with continuous variables, binary classification of variables simplifies the model and results in better net returns when setting the risk below 0.9. It is not difficult to see that the area under the DCA curve is larger than the model established with continuous variables. Therefore, in this example, a simple binary classification of risk factors is more conducive to improving the net return of the model and is suitable for promotion and utilization. The results are shown in Fig. 7.
Fig. 7
Lastly, the model was employed to predict the risk stratification of 1000 individuals, and a clinical impact curve was generated, as depicted in Fig. 8. The solid line dots represent the high-risk population predicted by this model using the respective high-risk threshold probability, whereas the dashed line dots correspond to the actual positive population using the respective high-risk threshold probability. The clinical impact curve allows for a visual assessment of the model’s predictive specificity across various high-risk threshold probabilities.
Fig. 8
Clinical impact curve of the model
Comments (0)