The present research was conducted in the Faculty of Dentistry, Alexandria University following CRIS guidelines for reporting in-vitro studies (Krithikadatta et al. 2014). Ethical approval was obtained from the Institutional Ethical Committee, Alexandria University, Egypt. (IRB # 0852-1/2024-IORG 0008839).
Sample size
The sample size for the study was calculated using a power analysis based on several factors, including a 5% significance level (alpha error), 80% study power (1—beta error), and the variance explained by the effects of composite material, immersion liquid, and immersion time on colour differences, as reported by Karakaş and Küden (2023). The specific variance explained by these factors was estimated to be 0.865. To calculate the sample size, a two-way repeated measures analysis of variance (ANOVA) was used. Using G*Power 3.1.9.7, the sample size was determined to be 12 samples per group. Hence, the total number of samples = sample per subgroup (12) x Number of subgroups (4) x number of groups (3) = 144.
Sample preparation
Forty-eight discs (10-mm diameter × 2-mm thickness) of shade A2 were prepared from each of the three restorative material under investigation in this study giving a total of 144 samples (Tan et al. 2015). These specimens were classified into Group I: Filtek Z250 XT (Nanohybrid, 3 M ESPE, USA), Group II: Cention N (Alkasite composite resin, Ivoclar Vivadent, Schaan, Liechtenstein), and Group III: SDR flow Plus Bulk Fill Flowable (Low viscosity bulk fill material, Dentsply, Germany). (Table 1).
Table 1 Resin composite material used in the studyThe discs were fabricated using a specially designed metal mould. It consisted of a plastic base, two split metal plates and a plastic cover. A transparent mylar strip (Kerr, USA) was placed between the plastic base and the metal plates, below the mould (Tan et al. 2015; Karadas 2016). According to the manufacturer, the transparent strip is 10-cm long, 1-cm wide and 0.05-mm thick. According to the manufacturers’ instructions, the materials were manipulated and packed into the mould, another mylar strip was placed above the metal plate (Karadas 2016; Gonder and Fidan 2022). A 1 mm thick glass slide was placed over the strip and slight finger pressure was applied to obtain a smooth surface and to remove excess material to flatten the surfaces and care was taken to prevent entrapment of air voids within the specimens. (Karakaş and Küden 2023; Karadas 2016; Gonder and Fidan 2022; Al-Haj et al. 2021).
Polymerization
Upon polymerization, the tip of the light unit was placed on the glass slide to ensure that curing was performed from a standardized distance (Elwardani et al. 2019; Bezgin et al. 2015). Polymerization was performed using LED curing unit (Blue phase G2, Ivoclar Vivadent, USA) in standard mode with an intensity of 1200 mW/cm2. The samples were cured through the Mylar strip for 20 s to each surface for a total of 40 s according to the manufacturers’ instructions (Al-Haj et al. 2021; Bezgin et al. 2015). Every five samples the output of the light was checked using a photometric tester (Bluephase Meter II, Ivoclar Vivadent, USA) (Bahbishi et al. 2020). Then, the samples were removed from the mould and were visually inspected for surface defects, those with visible flaws were discarded. The included discs were stored in 20 ml of saliva natura (Medac, UK) at 37 °C for 24 h in an incubator to ensure stabilisation of monomer conversion and to mimic oral conditions (Habib et al. 2017). Then the composite discs were washed thoroughly by distilled water for 10 s and left to dry.
Allocation and blinding
The prepared samples from each main group were placed in identical numbered containers by an independent colleague (NS), who randomly assigned the specimens into subgroups according to the immersion solution used. Allocation was performed by a computer-generated list of random numbers to create block randomization. Hence, each main group was subdivided into 4 subgroups (n = 12), classified as; Subgroup A (control): distilled water (Runyes water distiller, China), Subgroup B: Coca-Cola (Coca-Cola, Egypt), Subgroup C: chocolate milk (Juhayna, Egypt), and Subgroup D: Orange juice (Juhayna, Egypt). Double blind study was implemented since allocation was concealed from both the investigator and statistician (Elwardani et al. 2019).
After baseline measurements, each sample was immersed in undiluted 20 ml of the assigned beverage for 10 min every day. Next samples were washed thoroughly for 10 seco by distilled water. Then samples were re-immersed in saliva natura, which acts as a storage medium, and placed back in the incubator at 37 °C. Every day the immersion solutions were renewed (Mundim et al. 2010).
Optical evaluation
Assessment was done before immersion (baseline) and on day 30 of exposure (Al-Haj et al. 2021). Translucency and colour measurements were performed with a digital spectrophotometer (VITA Easyshade Advance, Vita Zahnfabrik, Germany) according to CIE-Lab system (Commission International de L’Eclairage), that is recommended by the American Dental Association (Karadas 2016; Habib et al. 2017). In which, any colour is expressed through L*, a*, and b* values. The L* represents the measurement along the white-black axis (0: black, 100: white), a* refers to the measurement along the red-green axis (− a*: green, + a*: red) and b* denotes the measurement in the yellow-blue axis (− b*:blue, + b*:yellow). Colourimetric measurements through the CIE-Lab coordinates allows the determination of colour in three-dimensional space (Arregui et al. 2016).
Before measuring, the Easyshade Vita colourimeter was calibrated according to the manufacturer’s instructions. The probe tip was placed perpendicular and well-adjusted to the specimens’ surface to make accurate measurements. Three successive readings were taken on each surface for every specimen, and the average value was recorded. Calibration was repeated every 4 specimens (Karakaş and Küden 2023; Salgado et al. 2018; Hatirli et al. 2022).
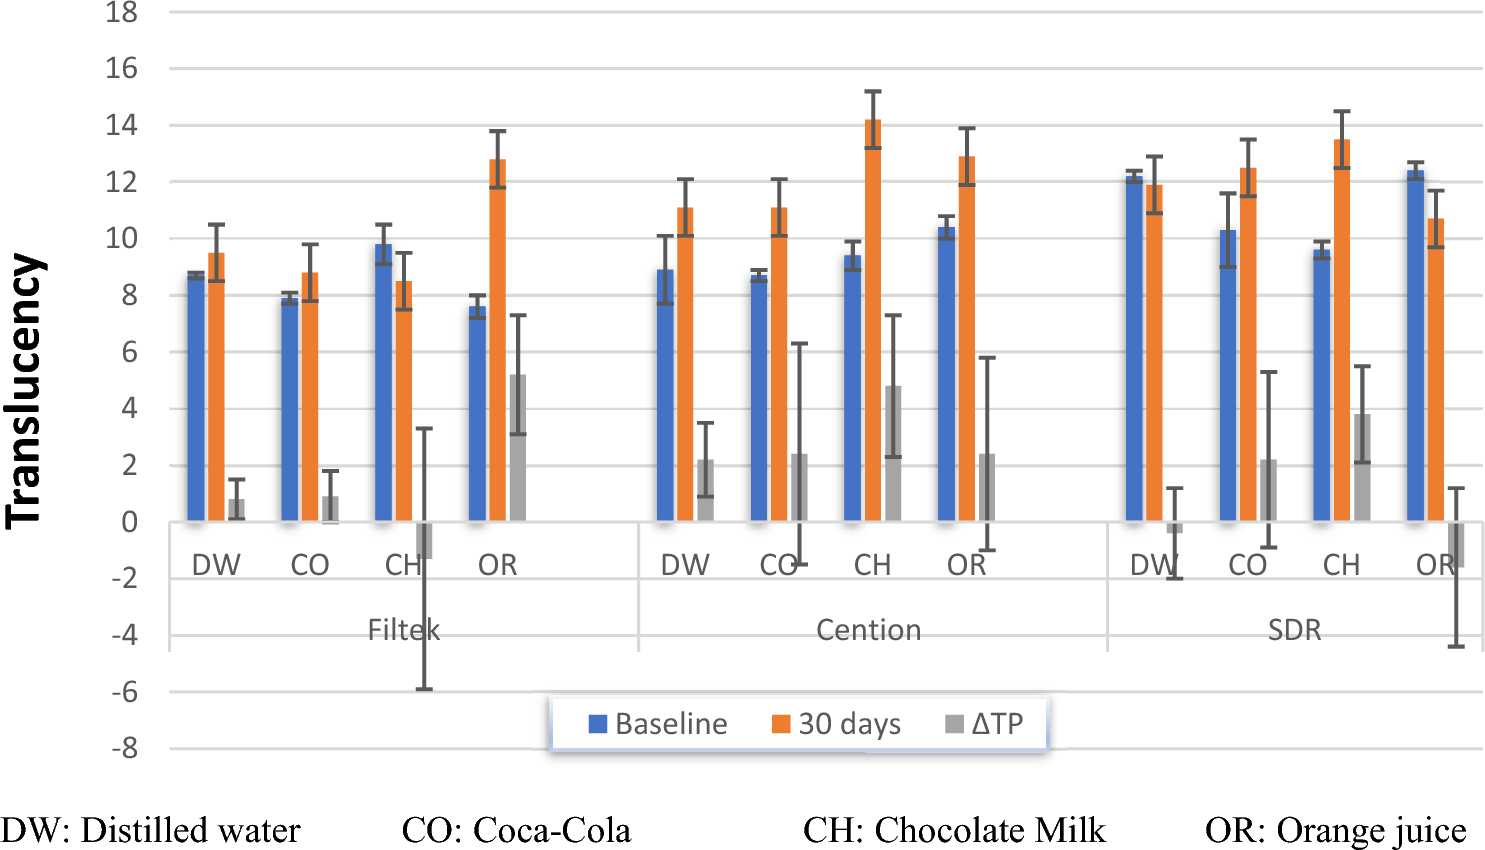
Translucency assessment
Translucency Parameter (TP) was determined by calculating the difference between colour coordinates values obtained for the same specimen against black (L*B = 4.2, aB* = 0.3, bB* = -1.2) and white backgrounds (L*W = 93.3, a*W = − 0.1, b*W = 2.6) according to the following formula: (Karadas 2016; Salgado et al. 2018).
$$ }\, = \, \, \left[ }^_}} }^_}} } \right) + \left( }^_}} }^_}} } \right)^ + \left( }^_}} }^_}} } \right)^ } \right]\,^} \right. \kern-0pt} 2}}} $$
Where the subscript W, refers to the colour coordinate values obtained against a white background and the subscript B, refers to the values against the black background. The difference in TP (∆TP) was calculated by the equation: (Tan et al. 2015).
$$ \Delta }\, = \,}_}} }_}} $$
In this equation, subscript A, refers to baseline measurements and subscript B, refers to measurements after immersion in the beverage (Karadas 2016; Kang et al. 2015).
Colour change assessment:
Colour measurements were obtained over the white background to prevent potential absorption effects on any of colour parameters (Karadas 2016; Habib et al. 2017). The colour difference (∆E) was calculated as follows: (Karadas 2016).
$$ \Delta }\, = \left[ }} \right)^ + \left( }} \right)^ + \left( }} \right)^ } \right]\,^} \right. \kern-0pt} 2}}} $$
Where ∆L, ∆a, and ∆b are differences in L*, a* and b* values between the baseline and after 30 days of exposure (Al-Haj et al. 2021).

Comments (0)