
Remember me
Custom-made media were prepared, in which a single α-ketoacid precursor was supplemented in place of the corresponding amino acid. Tyrosine precursor 1, Phenylalanine precursor 2, Leucine precursor 3, Valine precursor 4, Methionine precursor 5, Isoleucine precursor 6 and Histidine precursor 7 were tested (Scheme 1). For subsequent NMR analysis, isotope-labelled precursors were employed (1*-5*, Scheme 1 and Table 2).
Scheme 1
Amino acid precursors used in this study. p-Hydroxyphenylpyruvate 1; Phenylpyruvate 2; α-Ketoisocaproate 3; α-Ketoisovalerate 4; 4-Methylthio-α-ketobutanoate 5; 3-Methyl-α-ketovalerate 6; 4-(2-Carboxy-2-hydroxyvinyl)-1 H-imidazolium chloride 7; ([3,5-13C2, 2,6-2H2] p-Hydroxyphenyl)pyruvate 1*; ([3,5-13C2, 2,4,6-2H3] Phenyl)pyruvate 2*; [5-13 C, 3,3,4,5,5,5-2H6] α-Ketoisocaproate 3*; [4-13 C, 3, 4,4,4-2H4] α-Ketoisovalerate 4*; 4-[13C] Methylthio-α-ketobutanoate 5*
Table 2 Labelled precursors employed in this studyProtein expression efficiency in media supplemented with each precursor was tested by evaluating the expression level of CA II by SDS-PAGE. Each expression test was carried out with increasing amount of precursor (1x, 2x, and 5x doses relative to the concentration of the corresponding amino acid in the commercial DMEM) and compared to the expression in commercial DMEM (Fig. 2). For all precursors tested, the 2x dose was sufficient to achieve expression levels comparable to those obtained with the corresponding amino acid. Lower levels were obtained with both 1x dose and 5x dose of precursor, the latter being most likely a result of cytotoxic effects due to the high concentration of precursor (Fig. 1). Quantitative analysis revealed that in the lysates from cells treated with DMEM (either commercial or custom-made) CA II concentration was ~ 100 µM, whereas with 1x, 2x and 5x doses of precursor CA II was ~ 35–70 µM, 70–100 µM and 45–85 µM, respectively (Fig. S1).
In E. coli, α-kesoisovalerate 4, acts as a precursor for both valine and leucine (Lichtenecker et al. 2013b). However, the pathway for the synthesis of leucine from α-ketoisovalerate is known to be inactive in mammalian cells (Neinast et al. 2019). Nevertheless, protein expression was tested in media lacking only valine, only leucine, or both. As expected, expression was only achieved in the medium lacking valine, confirming that α-ketoisovalerate only works as a valine precursor in mammalian cells (Fig. 1B).
Fig. 1
Protein expression tests. (A) HEK293T overexpressing CAII, incubated with commercial DMEM, custom-made DMEM w/o Met, custom-made complete DMEM, custom-made DMEM w/ Methionine precursor 5 1x, custom-made DMEM w/ 5 2x, custom-made DMEM w/ 5 5x, custom-made complete DMEM, custom-made DMEM w/ Histidine precursor 7 1x, custom-made DMEM w/ 7 2x, custom-made DMEM w/ 7 5x, protein marker. (B) HEK293T overexpressing CAII, incubated with commercial DMEM, custom-made DMEM w/o Val and Leu, custom-made DMEM w/o Val, custom-made DMEM w/o Leu, custom-made complete DMEM, custom-made DMEM w/ Valine precursor 4 2x w/o Val and Leu, custom-made DMEM w/ 4 2x w/o Val, custom-made DMEM w/ 4 2x w/o Leu, protein marker. (C) HEK293T overexpressing CAII, incubated with custom-made DMEM w/o Phe, custom-made complete DMEM, custom-made DMEM w/ Phenylalanine precursor 2, custom-made DMEM w/ labelled Phenylalanine precursor 2*, custom-made DMEM w/ 2 1x, custom-made DMEM w/ 2 2x, custom-made DMEM w/ 2 5x, protein marker. (D) HEK293T overexpressing CAII, incubated with commercial DMEM, custom-made DMEM w/o Ile, custom-made complete DMEM, custom-made DMEM w/ Isoleucine precursor 6 1x, custom-made DMEM w/ 6 2x, custom-made DMEM w/ 6 5x, custom-made complete DMEM, custom-made DMEM w/ Tyrosine precursor 1 1x, custom-made DMEM w/ 1 2x, custom-made DMEM w/ 1 5x, protein marker
Incorporation of isotopically labelled precursorsFor a subset of the above precursors (Table 2), protein side chain-specific isotopic labelling was evaluated through NMR spectroscopy in both intact cells and cell lysates. To this aim, two model globular proteins, CA II and DJ-1, were transiently overexpressed in presence of isotope-labelled precursors at the optimal doses reported above. To correctly identify the signals arising from the isotope-labelled overexpressed proteins, the spectra were compared with those obtained from control cells transfected with an empty vector and incubated in the same labelled media.
Aromatic labellingWe tested the incorporation of tyrosine and phenylalanine precursors 1* and 2* via in-cell and in-lysate NMR (Fig. 2) and compared the spectra of proteins obtained from a precursor-containing medium to those obtained from a medium containing the corresponding side-chain labelled amino acids, which have been synthetized according to literature (Young et al. 2021) (Supp. Fig. S2). The ensuing in-cell NMR spectra revealed well-defined peaks for the side chain-labelled amino acids. The same peaks were better resolved in the lysate NMR spectra. Peak counting revealed a lower number of peaks than expected (Table 3). Notably, however, the same number of signals was also observed in the spectra obtained using the cognate amino acids (Supp. Fig. S2), indicating that the missing peaks do not arise from incomplete incorporation, but are likely caused by signal overlap and/or exchange broadening. Taken together, these results confirm that the α-ketoacids are transformed in the corresponding amino acids and subsequently integrated in the protein sequence at the correct positions.
Methyl labellingWe performed in-cell and in-lysate NMR experiments on protein samples methyl-13C labelled at valine, leucine, and methionine residues using compounds 3*, 4* and 5*. The resulting in-cell NMR spectra showed well-resolved peaks corresponding to the side chain-labelled amino acids, which were even better resolved in the lysate NMR spectra, confirming the incorporation in the protein sequence (Fig. 3). In the case of valine and leucine precursors, where the methyl groups are not stereospecifically labelled (resulting in a racemic mixture), the number of expected peaks corresponds to twice as many residues in the protein sequence, due to the labelling of both prochiral methyl groups (Fig. 3A, B). Despite the relatively low protein concentrations, ranging between 25 and 50 µM (Supp. Fig. S3), most of the expected methyl peaks were observed in the lysate spectra (Table 3), thanks to the high sensitivity and spectral resolution attained by selective methyl labelling. To assess the contribution of natural abundance 13C in the spectra of selectively labelled samples, a lysate from cells expressing CA II in unlabelled medium was compared to a lysate containing leucine-labelled CA II. No signals from unlabelled protein were detected within the duration of the experiment, indicating that 13C natural abundance does not interfere with the detection of methyl-labelled proteins (Supp. Fig. S4).
Combined precursor incorporationWe then combined multiple precursors in the same culture medium to assess whether the expression and incorporation levels remained unchanged. We chose valine and leucine precursors, which share the same transaminase enzyme, the branched-chain amino acid aminotransferase (BCAT) (Neinast et al. 2019; Toyokawa et al. 2021). This test would thus provide further information on enzymatic overload. Therefore, a custom culture medium containing Val and Leu precursor was made and the NMR experiments was performed overexpressing DJ-1. The resulting in-cell and lysate spectra show a good DJ-1 expression level, similar to the one of DJ-1 with the precursors used separately, and an efficient incorporation of both labelled amino acids (Fig. 4).
Fig. 2
NMR spectra of tyrosine and phenylalanine-labelled proteins. (A) Top: In-cell spectra on HEK293T cells overexpressing CA II (left) and DJ-1 (right), incubated with 1* (orange); HEK293T cells transfected with empty vector, incubated with 1* (black). Bottom: In-solution spectra on HEK293T lysate. Lysate of cells overexpressing CA II (~ 20 µM, left) and DJ-1 (right), incubated with 1* (orange); lysate of cells transfected with empty vector, incubated with 1* (black). (B) Top: In-cell NMR spectra on HEK293T cells overexpressing CA II (left) and DJ-1 (right), incubated with 2* (red); HEK293T cells transfected with empty vector, incubated with 2* (black). Bottom: NMR spectra on HEK293T lysate. Lysate of cells overexpressing CA II (~ 40 µM, left) and DJ-1 (right), incubated with 2* (red); lysate of cells transfected with empty vector, incubated with 2* (black)
Table 3 Observed vs. expected peaks detected in the NMR spectra of cell lysates. a Excluding N-terminal methionineApplication of the methodTo show an example of a possible application of this labelling technique, we chose a set of well-characterized sulfonamide-derived CA inhibitors: Acetazolamide (AAZ) and methazolamide (MZA) which are currently in use as drugs to treat glaucoma, and ethoxzolamide (ETZ) which is an inhibitor of CAs in proximal renal tubules, widely used as a diuretic. All three compounds were previously shown to tightly bind CA II by in vitro and in-cell NMR (Luchinat et al. 2020a, b). We selected the valine precursor 4* as Val residues are present in the CA II ligand binding site. Indeed, from the spectra comparison it is possible to appreciate the change in the shifts of those valine residues involved in the interaction or experiencing an environment variation due to the proximity of the ligand (Fig. 5).
Fig. 3
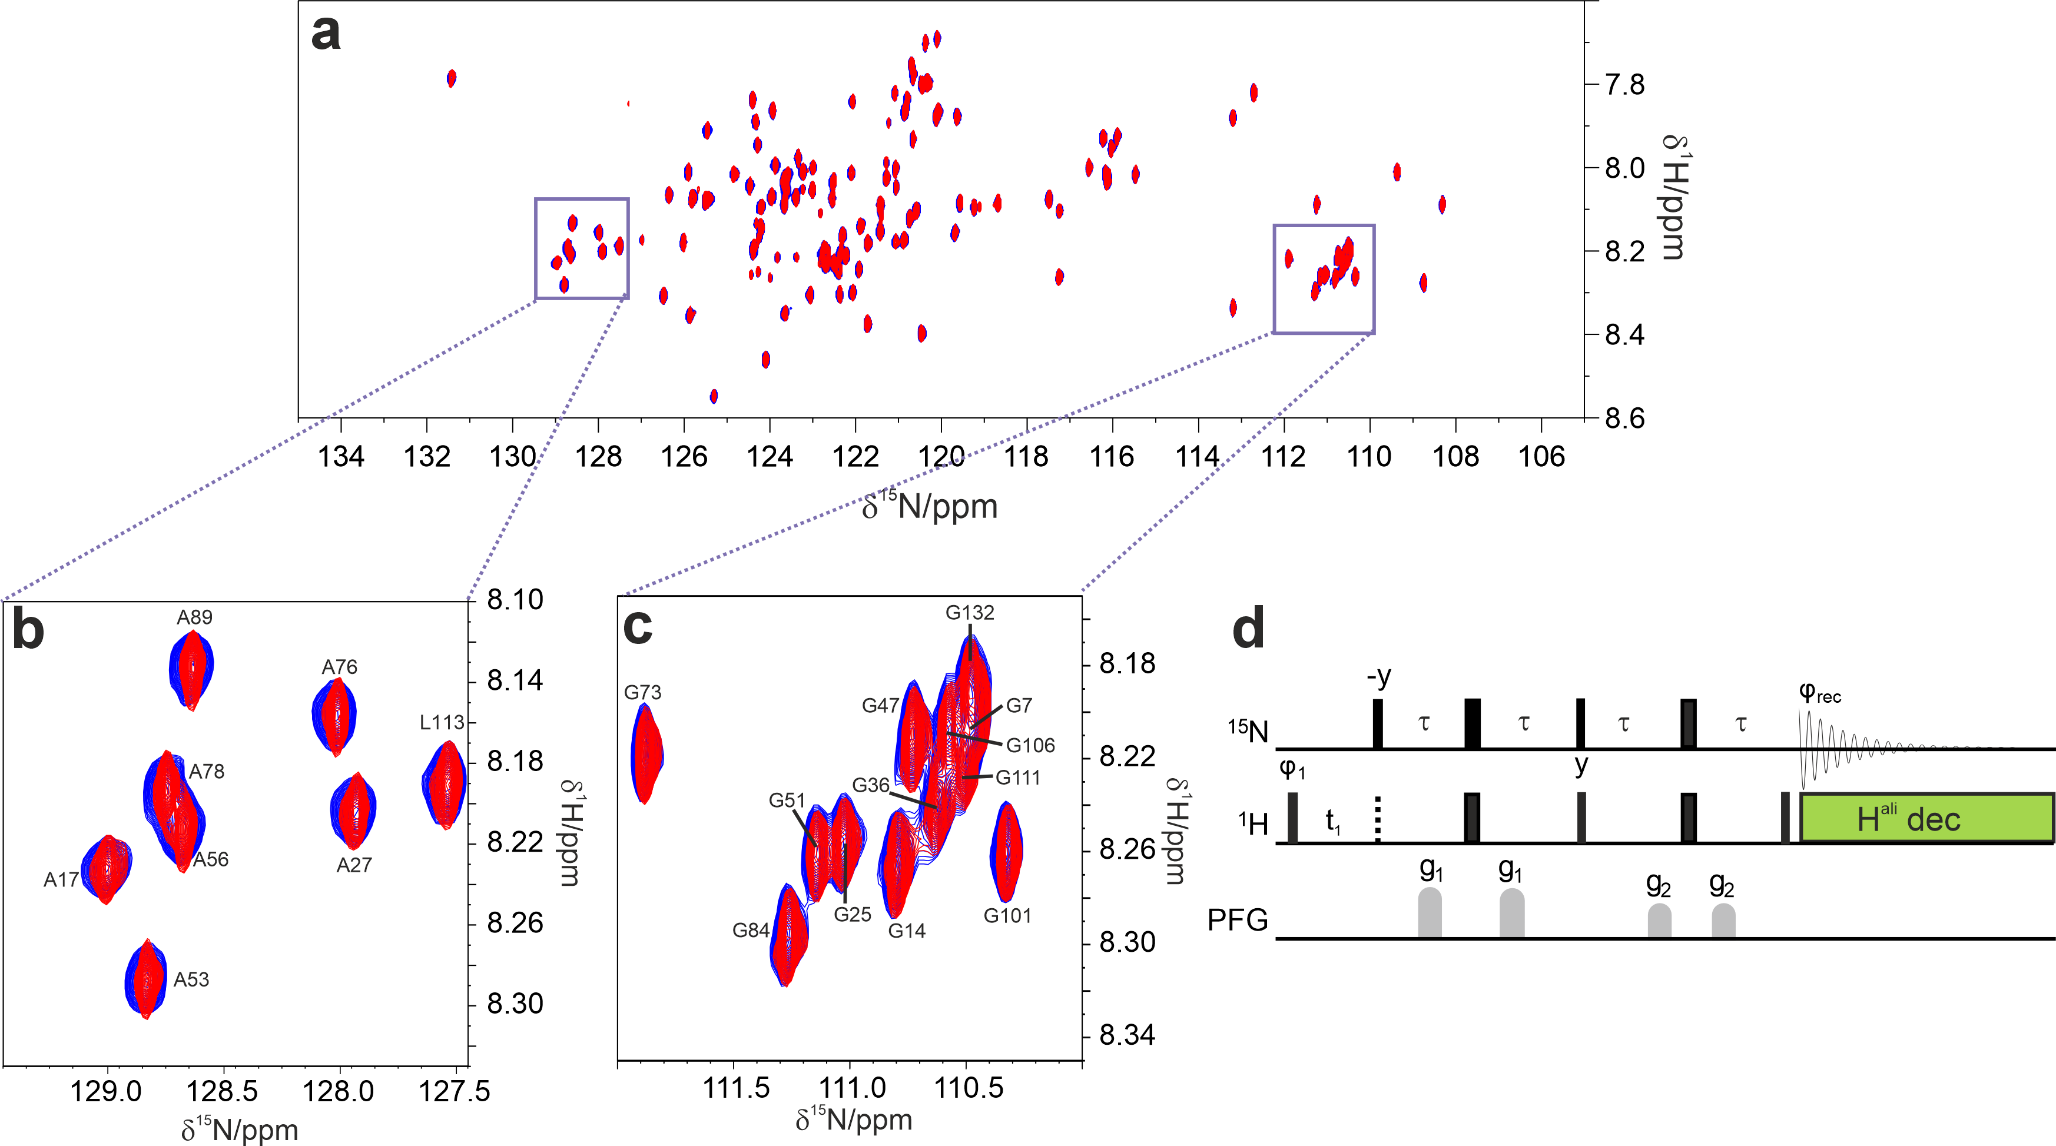
NMR spectra of valine, leucine and methionine-labelled proteins. (A) Top: In-cell NMR spectra on HEK293T cells overexpressing CA II (left) and DJ-1 (right), incubated with 3* (magenta); HEK293T cells overexpressing empty vector, incubated with 3* (black). Bottom: NMR spectra on HEK293T lysate. Lysate of cells overexpressing CA II (~ 50 µM, left) and DJ-1 (right), incubated with 3* (magenta); lysate of cells transfected with empty vector, incubated with 3* (black). (B) Top: In-cell NMR spectra on HEK293T cells overexpressing CA II (left) and DJ-1 (right), incubated with 4* (light blue); HEK293T cells transfected with empty vector, incubated with 4* (black). Bottom: NMR spectra on HEK293T lysate. Lysate of cells overexpressing CA II (~ 25 µM, left) and DJ-1 (right), incubated with 4* (light blue); lysate of cells transfected with empty vector, incubated with 4* (black). (C) Top: In-cell NMR spectra on HEK293T cells overexpressing CA II (left) and DJ-1 (right), incubated with 5* (green); HEK293T cells transfected with empty vector, incubated with 5* (black). Bottom: NMR spectra on HEK293T lysate. Lysate of cells overexpressing CA II (~ 25 µM, left) and DJ-1 (right), incubated with 5* (green); lysate of cells transfected with empty vector, incubated with 5* (black)
Fig. 4
Simultaneous labelling with valine and leucine. Left: In-cell spectra on HEK293T overexpressing DJ-1, incubated with 3* and 4* (magenta); HEK293T cells overexpressing empty vector, incubated with 3* and 4* (black). Right: In-solution spectra on HEK293T lysate overexpressing DJ-1, incubated with 3* and 4* (magenta); lysate of cells overexpressing empty vector, incubated with 3* and 4* (black)
Comments (0)