
Remember me
The quality of the NMR measurements described below is critically dependent on the sample preparation protocol that produces a dense phase by ultracentrifugation (Table 1; Fig. 2). In the major step, the protein is concentrated by centrifugation at 70 000–85 000 g for a time of 2–3 days at maximum. This time is considered appropriate for proteins in the 40–60 kDa range, ensuring that they are quantitatively sedimented. Very likely, many larger proteins can be spun down in a shorter period. Calculation of an appropriate centrifugation time is difficult since important factors are the strength and number of the weak interactions between the molecules that become relevant at these very high concentrations and determine the tendency of protein network formation, but which vary depending on the particular protein investigated.
The protein is either directly spun into the rotor (Fig. 2a), or centrifuged into a rotor after concentration of the protein in a separate centrifugation step from which only the concentrated phase is retained. In both cases, a residual dilute ‘buffer’ phase and the dense phase remain separate and can be clearly distinguished from each other. When using small rotors (e.g., 0.7 mm), a filling tool is required for which the engineering drawings are shown in Figs. S2 and S3. A 0.7 mm rotor can contain up to 600 nL of material, whereas the funnel of the filling tool accommodates 250 µL (Fig. S2 and S3), so loading the funnel with an initial concentration of 1–4 mg/mL protein yields sufficient amounts of protein in the rotor after centrifugation. Table 1 lists the conditions applied to prepare the samples mentioned in this work. The conditions may also be applied to fill rotors with other diameters, using an adapted filling tool.
Fig. 2
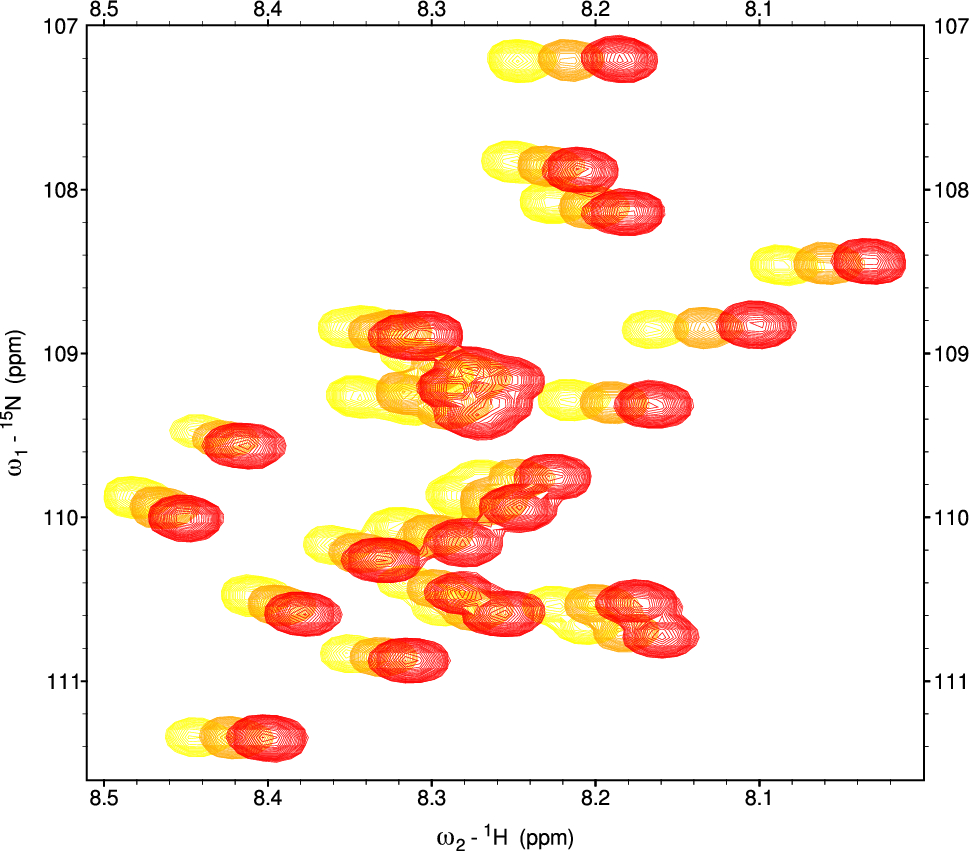
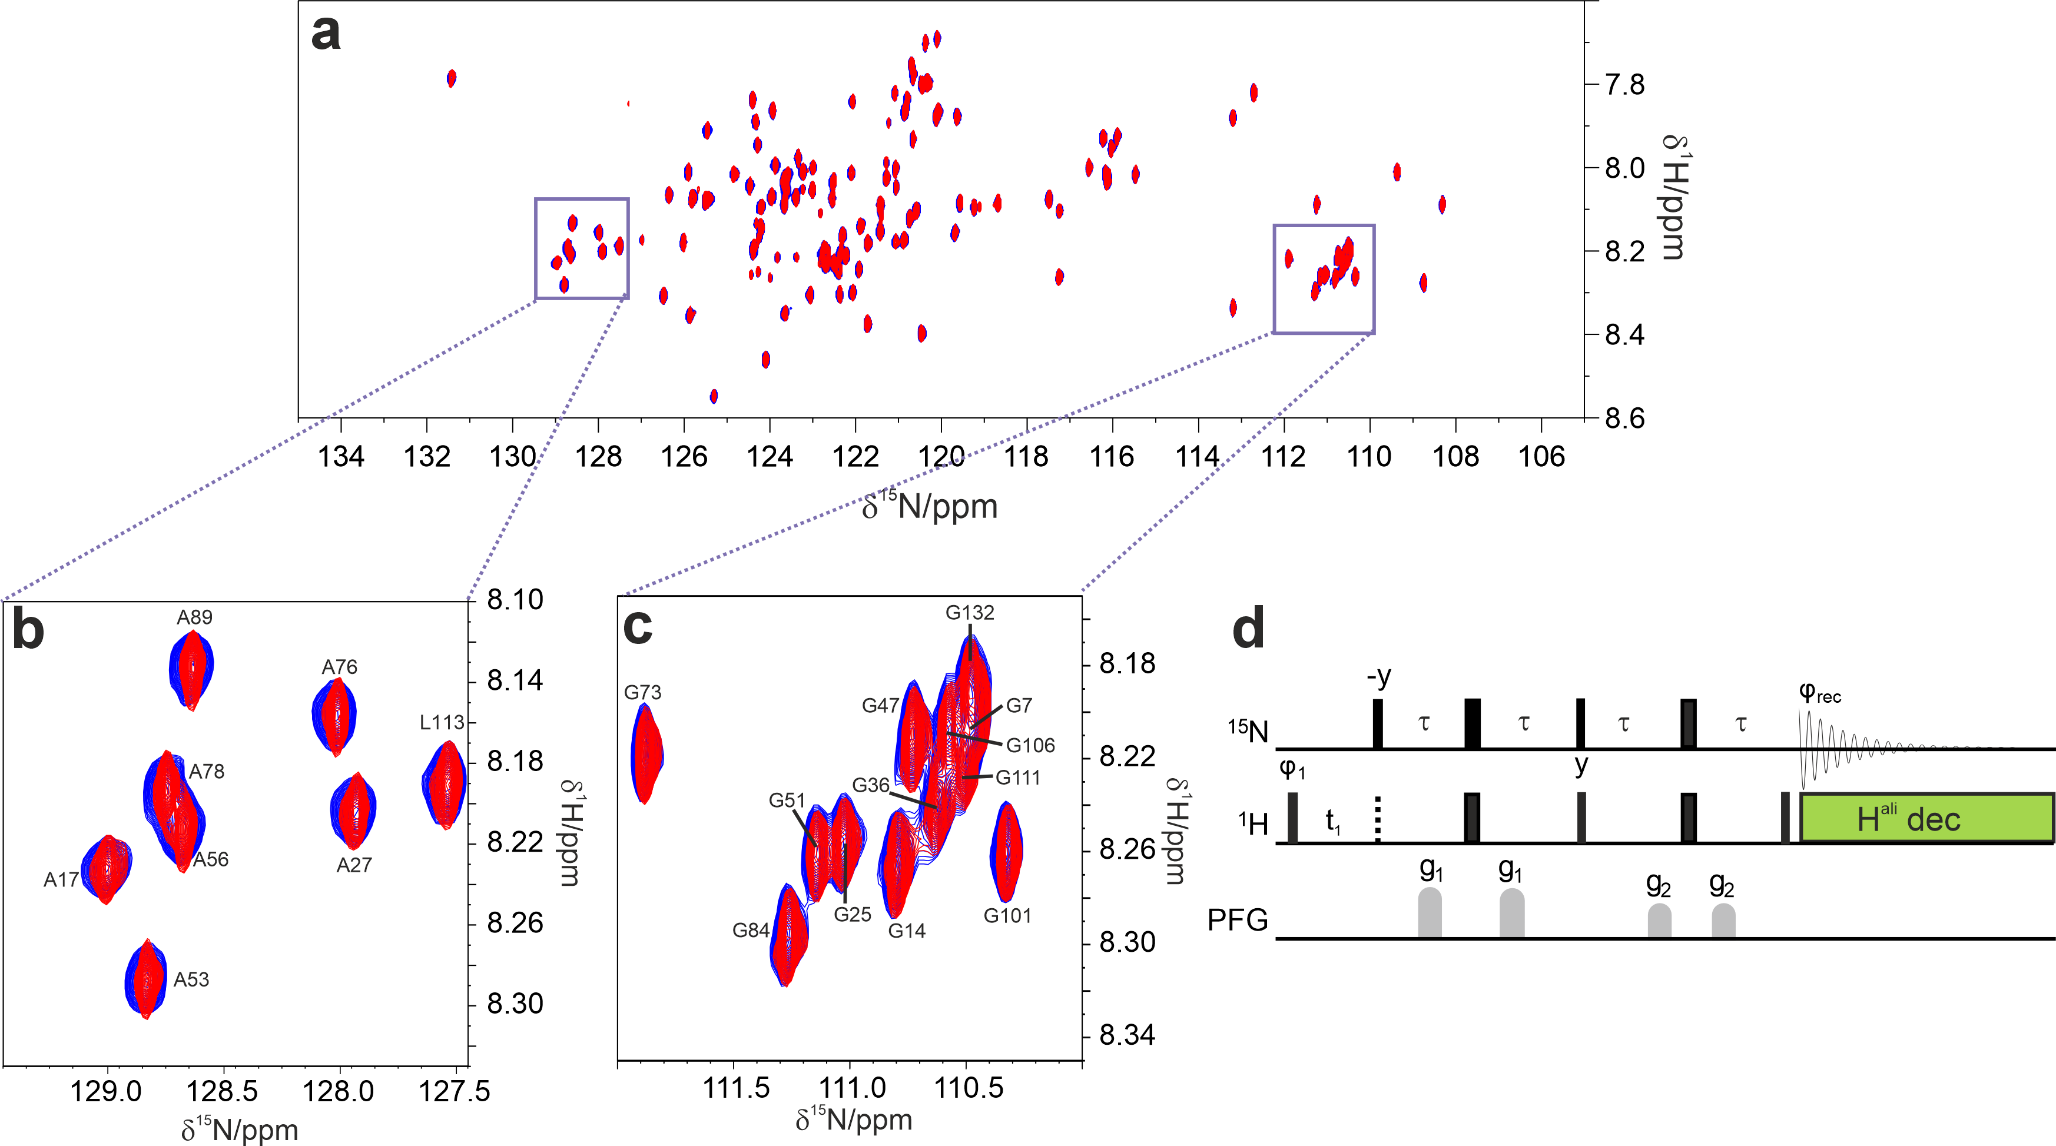
Procedure for the preparation of sedimented samples. (a) Ultracentrifugation (UC) of the sample directly into the rotor using the tool shown in Fig. S2 and S3. The protein cartoon shown is a model of SaETF, with the two bound FAD molecules colored. (b) Development of the sample during measurements. (c) 1H-15 N NMR correlation of 13C,15N-labelled SaETF recorded at 100 kHz MAS, 294 K, and a proton frequency of 900 MHz. (d) Slices from a similar spectrum as in (c) but recorded with 2048 t1 increments for a spectral width of 142 ppm in the nitrogen dimension, taken at the indicated cross peak positions 1 and 2 along F1 (15N)
In case of SaETF (Fig. 2a) the ratio of protein-to-water approached 1:2.5 (w/w) (Fig. S1). At that point, the sample is gel-like, often not amenable to transfer by pipetting and does not redissolve into the supernatant. It strongly resembles a dense phase observed in LLPS (Alberti and Hyman 2021). During NMR experiments under MAS, the protein is centrifuged further to the rotor wall (Fig. 2b) due to the much higher g-force experienced than in the ultracentrifuge. After the measurements, we opened a rotor containing StTS to assess the condition of the sample. A notable amount of gel was apparent on the rotor walls, as shown in Fig. S4. Nevertheless, the spectra obtained from this rotor did not change over a period of months, indicating that this state forms quickly at the start of the measurements through the effects of centrifugation. The fact that the protein gel is located at the rotor walls raises the question whether it is detected with slightly lower or higher sensitivity than sample in the center. In fact, the radial B1 distribution appears very homogeneous for 0.7 mm rotors, with advantages for material at the rotor walls (Fig. S5).
With the outlined procedure, CP-based 1H-15 N correlation spectra with narrow lines are obtained (Fig. 2c). Importantly, no signs of an amorphous state or fibrils are observed, as could occur with desiccation of the sample. To avoid the latter, care must be taken to reduce water evaporation during spinning at the given temperature: rotor caps must either be tight enough, be glued into the rotor or be fitted with sealing plugs. High-quality spectra can then be acquired for at least two weeks, but usually much longer if water loss is prevented.
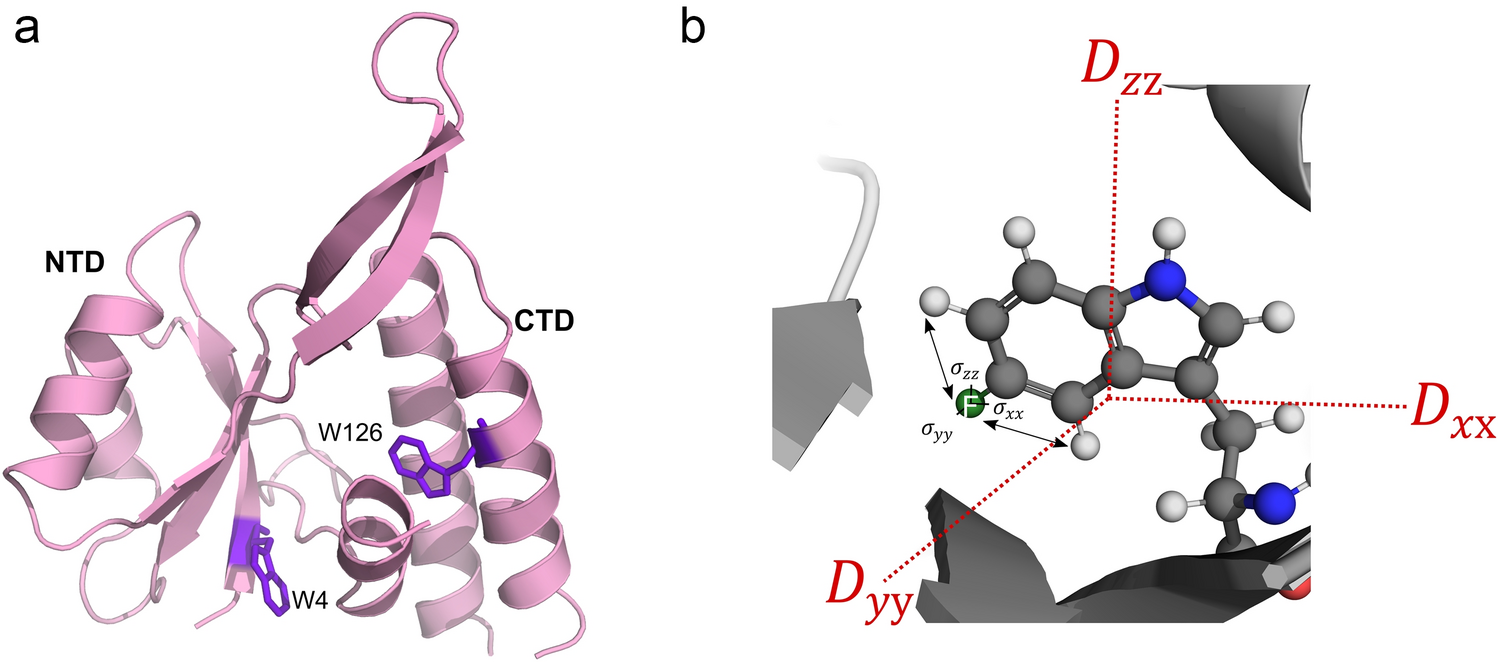
Sulfolobus acidocaldarius ETFMany redox-active enzymes employ conformational changes to regulate electron transfer in accordance with substrate availability and access to partner proteins (Rees and Howard 1999; Huang et al. 2013). Moderately simple examples are electron transfer flavoproteins (ETFs), one of which mediates electron bifurcation in anaerobes, including archaea (Peters et al. 2016; Garcia Costas et al. 2017; Duan et al. 2018; Müller et al. 2018). SaETF has 609 amino acids and a molar mass of 67 kDa. It contains two flavin-adenine-dinucleotide (FAD) molecules, one bound in each of the two domains: one 14 kDa domain, termed the ‘head’, and another 53 kDa ‘base’ domain. In an attempt to understand structural rearrangements associated with catalysis, which is expected to involve an 80° rotation of the head domain (Toogood et al. 2005; Demmer et al. 2017; Murray et al. 2024), we plan to characterize structure and dynamics of this system by MAS NMR in further studies.
The sedimented samples yielded a well-resolved 1H-15 N correlation (Fig. 2c, d) by a CP-based pulse sequence (Paulson et al. 2003; Zhou and Rienstra 2008) at 100 kHz MAS, whose dispersed cross peaks overlay well with those of an INEPT-based 1H-15 N HSQC spectrum (Bodenhausen and Ruben 1980) recorded on a deuterated sample in solution (Fig. 3a). The advantage of the CP-based approach is evident from the overlay (Fig. 3b), in that it visualizes numerous signals that are not evident in the 1H-15 N INEPT HSQC spectrum of the deuterated sample. This is most apparent from slices along F1 taken at 8.95 ppm 1H chemical shift as shown in Fig. S6. Most likely, these signals with chemical shifts characteristic of β-sheet structure are missing in the solution NMR spectrum owing to insufficient exchange of protons into backbone positions in SaETF expressed in 100% D2O-containing medium.
Fig. 3
Comparison of the CP-based 1H-15 N NMR correlation of non-deuterated SaETF shown in Fig. 2c with a corresponding solution NMR spectrum of a sample deuterated in the non-exchangeable sites. Both spectra were recorded at 900 MHz Larmor frequency. (a) 1H-15 N HSQC of a dilute solution of 2H, 15N-labelled SaETF (dark blue) (b) Overlay with the 1H-15 N NMR correlation (orange) shown in Fig. 2c. (c) Spectrum shown in Fig. 2c, for comparison
Overall, the MAS NMR spectrum shows a large number of dispersed cross peaks that permit measurement of the line widths. In a CP-based 1H-15 N correlation recorded with a spectral resolution of 12.6 Hz in t1 (2048 t1 increments for 142 ppm), we observe a width at half-height of 20–30 Hz for nitrogen signals when processed without weighting functions (Fig. 2d, see also arrows in 2D spectrum, Fig. 2c). In the same spectrum, proton linewidths in the range of 150–300 Hz are observed. Minimal water loss occurred during the initial measurement sessions, as indicated by a comparison of 1D 1H spectra (Fig. S1), recorded on the fresh sample and one year later. These spectra revealed that the initial protein-to-water ratio roughly estimated to be approximately 1:2.5 (w/w) (see Fig. S1 and Materials and methods) only changed marginally over this period. Furthermore, the state of the sample remained largely the same, as indicated by a CP correlation recorded after one year (Fig. S7).
There is a striking difference in peak pattern between the CP-based (Fig. 4a) and INEPT (Fig. 4b) 1H-15 N correlations, which indicates a residual overall motion of the protein (Aebischer and Ernst 2024). In a nutshell, at room temperature very rigid systems like β-sheets in protein crystals show signals with long T2 and hence with a narrow line width under MAS that appear in both, CP- and INEPT-based correlations. Mobile moieties like flexible termini do not show up in CP-based but INEPT correlations. There is an intermediate range where no INEPT transfers are observed, but where CP is already efficient. Most signals of folded protein moieties, even in a crystalline environment, fall into this latter category, reflecting some local motion. The quantitative aspects are nicely outlined in Aebischer and Ernst (Aebischer and Ernst 2024). Along these lines, the INEPT spectrum of SaETF shows only a subset of peaks with mostly random-coil chemical shifts, while the CP-based correlation gives the impression of a large protein with the expected dispersion. CP signal intensities were stronger at lower temperatures (see Fig. 4, blue 289 K and red 313 K). The high quality of the two spectra indicates that the protein molecules do not show the isotropic tumbling behavior observed in dilute solution, where transfers mediated by dipolar couplings are largely compromised. On the other hand, if the system were completely rigid, the T2 times of all proton and nitrogen signals would be long enough at fast MAS to show the same cross peak patterns in Fig. 4b than those observed in Fig. 4a. In this case, a complete 1H-15 N correlation would be expected via INEPT transfer. There is obviously considerable residual motion, in line with the observed absence of heterogeneous line broadening.
Fig. 4
Comparison of CP-based (a) and INEPT-based (b) 1H-15 N correlations of SaETF recorded at 289 and 313 K (blue and red, respectively), both under 100 kHz MAS and at 900 MHz proton Larmor frequency
Tryptophan synthaseStTS consists of two α (268 amino acids) and two β (397 amino acids) subunits. They assemble into an αββα heterodimer with a total molecular weight of 144 kDa. While 126 X-ray structures are available in the PDB at the time of writing, knowledge of local mobility and conformational transitions, as well as the protonation states (particularly within the active site) (Caulkins et al. 2016; Holmes et al. 2022), is required to understand the catalytic cycle of the protein. Such factors are accessible by NMR after assigning chemical shifts. In addition to the four-subunit StTS, we also investigated isolated β-subunit dimers (PfTrpB, with a total molecular weight of 85 kDa). To estimate the prospects of obtaining resonance assignments on sedimented samples in each case, we recorded a set of representative 3D data sets for StTS as well as the first scans of a series of different triple-resonance experiments for PfTrpB.
We first sedimented 13C, 15N-labeled StTS into a 0.7 mm rotor as described above and measured a CP-based 1H-15 N correlation of which the NH region of the arginine residues is shown in Fig. 5a and the amide signal region in Fig. 5b. The resonance assignments (BMRB code 51,166 (Klein et al. 2022a) previously obtained from a crystalline sample (Klein et al. 2022b) are indicated by dots. Those assignments match for cross peaks with chemical shifts separate from the bulk signal conglomerate, which are the ones most affected by changes in local environment (δ 1H > 9.7 ppm; δ 15N > 130 ppm). Thus, the sedimented protein very likely retains the same structure as revealed by X-ray crystallography (Niks et al. 2013) and by NMR on a crystalline sample (Klein et al. 2022b).
Fig. 5
2D CP-based 1H-15 N NMR correlation recorded on fully protonated and 13C, 15N-labelled StTS in a 0.7 mm rotor at 100 kHz MAS. The black dots indicate the positions of assigned cross peaks (Klein et al. 2022a) (a) Arginine NεH region of the spectrum. (b) Amide NH region
As in the example before, we note more signals in the spectral region characteristic of β-sheets, between chemical shifts of 9.5 and 10.5 ppm 1H, than there are assignments indicated. The additional signals’ most likely origins are the regions of the TIM barrel (Wu et al. 2007) buried inside the α subunit that were previously unassigned. In order to test the feasibility of acquiring data sets suitable for resonance assignment, we recorded 3D hCONH and hCANH spectra (Fig. S8a, b for three-dimensional view and Fig. S8c, d for 1H-13 C projections) (Barbet-Massin et al. 2014). The 1H-15 N projections of the hCONH and hCANH spectra (Fig. S8e, f) match the 2D 1H-15 N correlation. The two spectra each contain only one set of signals, indicating sample stability over the time of measurement. Altogether, this opens a different, more comprehensive avenue for sequence-specific resonance assignments and collection of structural constraints. As an additional advantage of fully protonated samples investigated at 100 kHz MAS, the CP-based 1H-13 C correlation (Fig. S9) provides access to 1H chemical shifts of the side chains.
The molecular weight of StTS is already large (144 kDa), making ultracentrifugation and MAS effective. To assess the prospects of sedimented samples for future studies, we used the PfTrpB sample comprising β-subunit dimers to compare the relative intensities of the first FID (i.e., their relative HN bulk intensities) of NMR data recorded with more complex pulse sequences that are useful for backbone resonance assignment. First, we used uniformly 13C, 15N-labeled sediment, spun at 100 kHz MAS, with the protonation content tuned according to the iFD protocol (H2O-based medium with deuterated glucose) to assure full protonation at amide sites while introducing a high degree of side chain deuteration (Medeiros-Silva et al. 2016). For comparison, a perdeuterated and back-exchanged sediment of PfTrpB was prepared. Again, a well-resolved spectrum is obtained at 100 kHz MAS, with additional cross peaks observed for the iFD sample in comparison to the spectrum of the perdeuterated sample recorded at 55 kHz MAS (Fig. 6a). We then recorded for both β-subunit samples 1D bulk amide proton signals from hNH, hCANH, hCONH, hCOCANH, hCACONH, and HNcoCANH experiments (Klein et al. 2022b), and compared bulk intensities within the sets (Fig. 6b and c). Relative to the hNH experiment, we obtained more intense signals for the 3D sequences in case of the iFD sample in the 0.7 mm rotor at 100 kHz MAS, which can be ascribed to higher start magnetization from the more abundant proton bath, rather than better transfer efficiencies compared to the triple labelled sample in the 1.3 mm rotor. However, the advantage of the iFD sample decreases for the most complex sequence employed (Fig. 6b and c, HNcoCANH), probably due to less efficient CP transfers at high MAS frequencies. For separate plots with percentages see Fig. S10.
Fig. 6
Comparison of spectra recorded on sedimented PfTrpB (~ 85 kDa) at 700 MHz 1H Larmor frequency. (a) Superposition of 2D 1H-15 N NMR correlations of iFD-labeled PfTrpB in a 0.7 mm rotor (orange) and of 2H, 13C, 15N-labeled PfTrpB in a 1.3 mm rotor (blue), both sedimented under comparable conditions. (b) Ratios of bulk intensities obtained from the first increment of the indicated 2D, 3D or higher-dimensionality experiments recorded at 100 kHz. The colors of the spectra refer to the indicated 2D and 3D NMR experiments indicated to the left. (c) The same ratios for the deuterated sediment in a 1.3 mm rotor spinning at 55 kHz. Sequences and parameters used are similar to Klein et al. (Klein et al. 2022b). For parameters used see SI. Color code as in (c)
A special opportunity for studying protein function is offered by the presence of arginine head group signals in a characteristic region of the 1H-15 N NMR correlation (Fig. 5a). In the case of StTS, R141 of the β-subunits is critically important for activity. It plays an essential role in stabilizing the closed form of the subunit by forming a salt bridge with D305 upon substate binding. Furthermore, it is part of the larger COMM domain (β102-β189) involved in the allosteric regulation of the catalytic activities of the α- and β-subunits (Schneider et al. 1998; Ghosh et al. 2022). The corresponding side chain signals may be resolved in this less crowded area of the spectrum and assigned by mutation.
Phytochrome Cph1 and a path to low-glycerol DNP samplesDNP NMR samples of the sensory module of the cyanobacterial phytochrome Cph1 (Rockwell et al. 2006; Essen et al. 2008; Hughes 2010) were prepared for two purposes: (i) to investigate potential exchange broadening of its chromophore carbon signals in measurements at room temperature that could occur analogously to previously detected amide 15N signal broadening (Hahn et al. 2008) and (ii) to assess the quality of DNP NMR samples prepared with minimal glycerol content. In both cases, the light-sensitive protein was investigated in 1.9 mm rotors. Here, the preparation of a gel-like phase by ultracentrifugation, following earlier work by Ravera et al. (Ravera et al. 2013, 2014), was seen as an opportunity to reduce the amount of glycerol in DNP NMR samples that was added in a small amount after sedimentation.
A 1.0 mM Cph1 sample, with 13C, 15N labelling exclusively in the phycocyanobilin chromophore, was sedimented into a 1.9 mm rotor. The 1D 13C NMR spectrum showed well-resolved signals for methine carbons C5, C10, and C15 (inset of Fig. 7), at the expected chemical shift positions, and similar linewidths for all signals. Exchange broadening due to ring reorientation or other alterations in the double-bond network due to protonation/deprotonation events were not apparent (Fig. 7). In those measurements, the signal-to-noise ratio (S/N) was low necessitating several hours of acquisition, presumably due to low protein concentration. In fact, after centrifugation, the sample remained oily, less gel-like, indicating a more dilute aqueous phase loaded into the rotor from which a gel, containing less protein, is formed upon MAS.
Fig. 7
1D 13C NMR spectrum of the sedimented phytochrome Cph1 solely labeled in its chromophore (PCB, inset), recorded at 261 K and 20 kHz MAS at a field of 18.8 T
A similar sample of Cph1 but with amino-acid selective 13C, 15N labelling of Ile, Arg, Val and Trp was prepared for DNP measurements from a 1.7 mM solution, to which the radical bcTolM dissolved in d8-glycerol was added, so that the final glycerol concentration in the buffer was low (11% d8-glycerol/22% D2O/67% H2O; v/v). This sample showed substantial 20-fold Boltzmann enhancements (Fig. S11), enabling collection of complex 3D hCANcoCA spectra (Chevelkov et al. 2013) with sufficiently good S/N in 4.5 days at a 1H NMR frequency of 800 MHz. Here, the substantial Boltzmann enhancement at 105 K indicates that freeze concentration of polarizing agent was suppressed despite the low glycerol concentration.
Concluding remarksHere, we report parameters, procedures and tools for sedimenting proteins in a molecular weight range between 40 and 140 kDa into MAS rotors in order to record well-resolved 1H-15 N correlations and sets of 3D spectra. By means of the outlined procedure, a dense phase is produced whose NMR spectra do not show noticeable heterogeneous broadening, thus exhibiting a liquid-like appearance apart from the larger line width. Yet, CP provides an efficient magnetization transfer mechanism. In the case of SaETF we showed that the water-to-protein-ratio is 1:2.5 (w/w) and remains stable over time, with very similar spectra obtained after one year. Structural integrity of the sedimented proteins was demonstrated by comparison of the CP-based 1H-15 N correlation spectra recorded on the dense phases with solution 1H-15 N HSQC spectra or CP-based correlations obtained from crystalline samples. Although the much narrower line width in the CP-based 2D-spectra of the crystalline TS sample nurture the expectation of a better signal to noise as compared to the spectra of the sedimented sample, the S/N in spectra of the iFD labeled sample of PfTrpB is sufficient to enable assignment procedures.
Here, dense phases of folded proteins are generated by ultracentrifugation. In LLPS, similar dense phases occur, yet of mostly unstructured proteins, following suitable changes of buffer conditions. Those dense phases form spontaneously after induction of LLPS and tend to develop rapidly towards fibrillar states, often involving short repeats in their amino acid sequence (Alberti and Hyman 2021). In principle, one could expect such tendency to form fibrils to be a problem of our approach. However, the dense phases of well-folded, globular proteins produced by ultracentrifugation did not show signs of fibrils even after weeks, as demonstrated by the set of clean 3D spectra obtained on StTS (Fig. S8) or by the long-term SaETF spectrum shown in Fig. S7, all being consistent with previous observations (Wiegand et al. 2020).
Among the factors influencing sensitivity, lower temperature helps to increase S/N in CP-based experiments. 1H-15 N correlation spectra obtained after sedimentation show overall good resolution in the proton dimension (150–300 Hz at 100 kHz MAS), and excellent resolution in the nitrogen dimension. The nitrogen line widths of 20–30 Hz observed in spectra of SaETF already indicates that the use of TROP-like sequences that exploit both, dipolar and scalar couplings for C-N transfer may be advantageous (Blahut et al. 2022).
The approach presented here contrasts the originally proposed FROSTY technique (Mainz et al. 2009). There, it was proposed that it is beneficial to use buffers containing 20% glycerol with the argument that this could reduce molecular tumbling due to the higher viscosity of the solvent mixture. From our perspective it needs to be considered that glycerol is more dense than pure water, as are glycerol/water mixtures, which may potentially interfere with the formation of a dense phase by centrifugation. The density of an 80% water / 20% glycerol mixture (w/w) is 1.048 at 15 °C. As an example for a dense protein phase we may consider egg white whose density ranges between 1.02 and 1.1. In such a situation it may happen that the sedimentation process is disturbed by glycerol.
The investigation of protein sediments instead of crystalline preparations may be advantageous when additives are required for crystallization that cannot easily be deuterated or carbon-depleted. Furthermore, there is larger freedom in the choice of pH and other buffer conditions than typically required for crystallization. In particular, this may facilitate NMR studies on complexes of drug targets with small molecule inhibitors or activators at appropriate conditions. The slightly larger line width observed in spectra of dense phases than in spectra of crystalline samples will be a case-specific tradeoff vs. the larger experimental freedom. Our approach also has advantages compared to solution NMR in that no deuteration of the protein is required when spinning the sample at 100 kHz MAS and above. A complete set of signals can thus be obtained. It has further value when cells of higher organisms than bacteria or yeast are employed as expression hosts, since complete deuteration cannot be achieved in this case.
It was demonstrated by Wiegand et al. that protein-DNA and protein-RNA complexes remain stable under fast MAS conditions (Wiegand et al. 2020). Considering the special advantage that deuteration can be avoided and that non-exchangeable protons can aid assignment procedures and enrich functional studies, we expect a particularly high impact of the presented approach on the investigation of RNA and their complexes. Those complexes are difficult to crystallize, there is yet no possibility to predict satisfying three-dimensional structures of them, and deuteration of RNA is costly. Additionally, the dispersion of the chemical shifts of nucleic acid aromatic protons and of sugar anomeric protons is high and may aid in assignment procedures. Furthermore, desired sections of the RNA may be selectively 13C, 15N-labelled so that spectra become less crowded.
The possibility of obtaining extended data sets with well-resolved spectra of sedimented proteins has far-reaching consequences regarding the current paradigm of NMR. Soluble proteins of 40–110 kDa in size that were currently not easily tractable by solution NMR are now accessible with the help of MAS NMR methods. Proteins and their complexes in this size range are also not easy to tackle by cryo-electron microscopy at the current state of technology, so that MAS NMR on sedimented samples may play a special role in structural biology. As a bonus, proton signals may be detected and 1H-chemical shifts may help to disperse spectra and to collect structural restraints. The possibility to detect exchangeable protons enables mechanistic studies.
Comments (0)