Synthesis
Bacillus coagulans (Accession No: ATCC®7050™, Catalog No: 0596P Micro biologics, Thermo Fisher Scientific, USA) was used in the synthesis of TiO2 NPs. The nutrient agar plates were freshly cultured with Bacillus coagulans. This culture was incubated at 37 °C for 24 h to obtain fresh strains of Bacillus coagulans that were mixed in 100 mL of nutrient broth in a flask and incubated at 28 °C with 150 rpm for 24 h to obtain a bacterial culture solution. Subsequently, 80 mL bacterial culture solution and 20 mL of 0.0025 M Ti(OH)4 solution (American Elements, 10,884-Weyburn Ave, Los Angeles, CA, USA) were mixed together to acquire a viscous mixture which was heated at 60 °C for 20 min. The white particles appeared at the bottom of the flask, revealing the synthesis of TiO2 NPs that were allowed to cool to room temperature for about 12–48 h [7].
Characterization
Different equipment were employed for the characterization of TiO2 NPs to evaluate the physico-chemical properties, morphology and topology. They were investigated by X-ray diffraction analysis (DP-MAXZ 2400/Diffractometer, Rigaku Corporation, Akishima, Tokyo, Japan), scanning electron microscopy and energy-dispersive X-ray spectroscopy (Nova nanosem 430; Fei company 4022 261 49,391-S column F&G stron prep, Hillsboro, OR, USA), UV–Vis diffuse reflectance spectroscopy (Perkin Elmer, UV/Vis/NIR Spectrometer Lambda 950 Waltham, MA, USA), atomic force microscopy (Quesant Universal SPM, Ambios Technology, Santa Cruz, CA, USA), Fourier transmission infrared spectroscopy (JASCO FT/IR-6600, Ultrech-Amsterdam, AMS, Netherlands) and dynamic light scattering (Zeta sizer-nano Z-S Apparatus, ZEN-36000, Malvern panaLytical, Malvern-UK) [7, 8, 21]. The crystalline size and phase of the TiO2 NPs were evaluated by X-ray diffraction analysis and dynamic light scattering. Scanning electron microscopy and atomic force microscopy were utilized to analyze the surface morphology. Fourier transmission infrared spectroscopy demonstrated the purity of functional groups and compounds. The presence of elements in the composition of these NPs was confirmed via energy-dispersive X-ray spectroscopy. UV–VIS diffuse reflectance spectroscopy showed the particle size through band-gap energy value.
Cytotoxicity evaluation
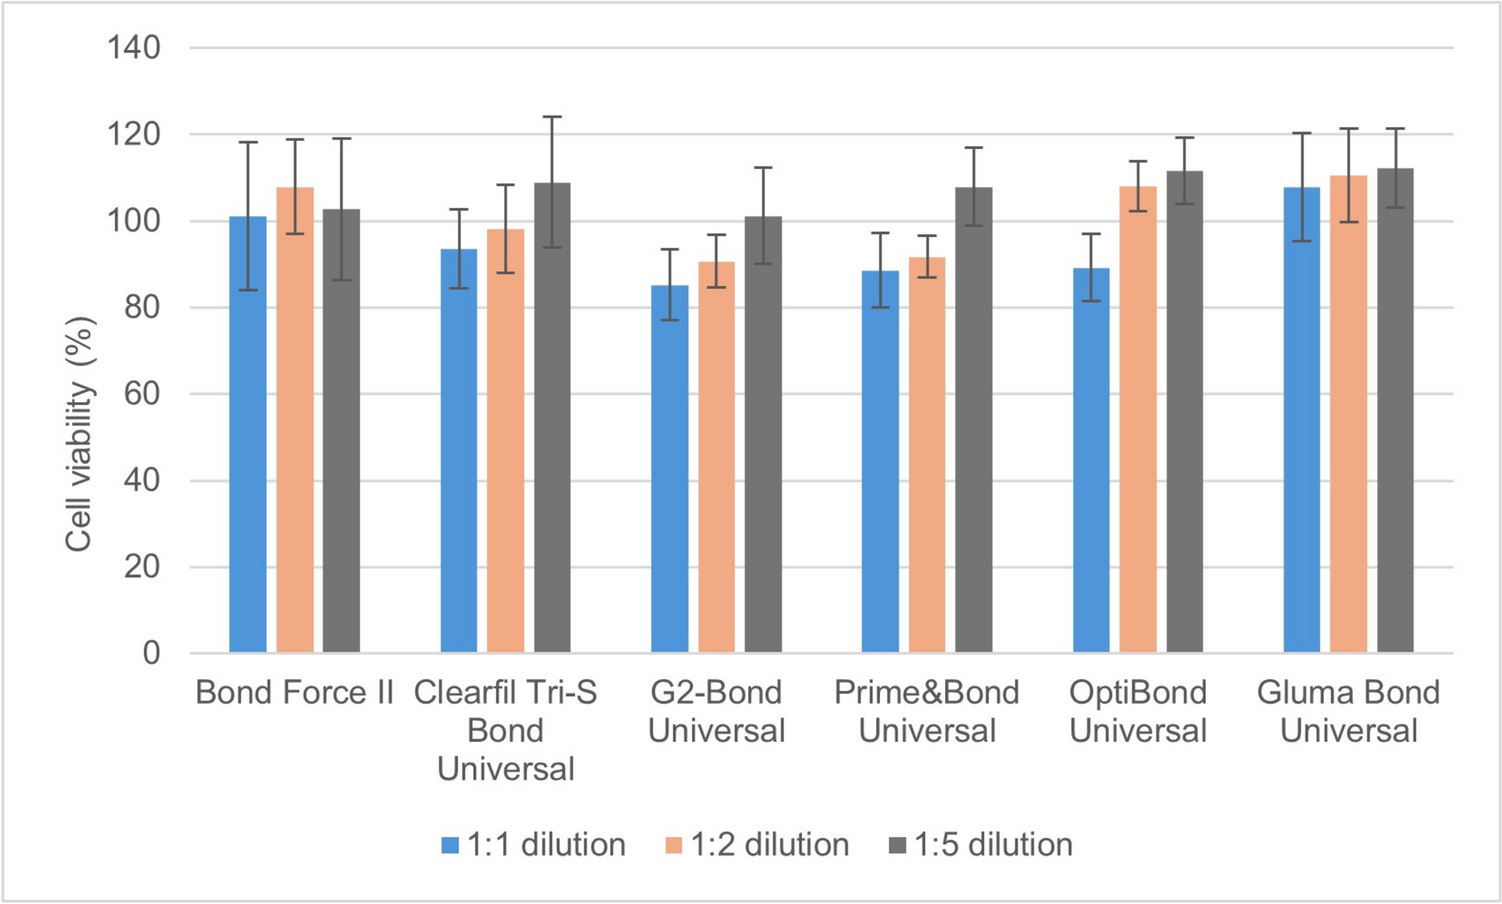
L929 mouse fibroblasts (ATCC; Manassass, V/A, USA) were kept in standard culture conditions to evaluate the cytotoxicity via the MTT assay (Sigma-Aldrich, Saint Louis, MO, USA). These fibroblasts were kept in 95% humidity and 37ºC temperature in 5.0% CO2 where 10% DMEM containing 1.0 × 10⁴ cells was used to make a cell suspension. Then, 100 µL cell suspension was seeded in every well of the standard 96-well plate for at least 24–48 h. Four different concentrations of TiO2 NPs (25–100 µg/mL) were prepared from 1.0 mg/mL stock solution of these TiO2 NPs to evaluate the cytotoxicity by adding an MTT assay into every well which was incubated at 37ºC for 2 h. Fluorescence well plate reader (Thermo Fisher’s, Waltham; MA, USA) was used to measure the fluorescence of every well at 490 nm wavelength after 24, 48 and 72 h [22, 23]. Different concentrations of TiO2 NPs were used as an experimental group and water was utilized as a control group. The cell viability rate of TiO2 NPs was calculated by:
$$}\% \, = \,\frac}\, \times \,00\% }}}}$$
The calculated cell viability greater than 90.0% showed non-cytotoxicity, calculated cell viability between 60.0 and 90.0% revealed mild cytotoxicity, calculated cell viability between 30.0 and 60.0% depicted moderate cytotoxicity and calculated cell viability less than 30.0% confirmed severe cytotoxicity.
Microhardness strength testingSample preparation
The commercial conventional GIC (GC Fuji Universal Gold Label 2) was used in this study whose composition is given in Table 1. A standard metal mold cylinder of about 9.5 × 1 mm was prepared for producing TiO2 GIC cylindrical samples (n = 50) to test the Vickers microhardness. Different concentrations of TiO2 NPs were added to GIC and mixed with liquid GIC to get TiO2 GIC cylinder samples, which were named conventional control group E-1 (0% TiO2 GIC), experimental group E-2 (3% TiO2 GIC), experimental group E-3 (5% TiO2 GIC), experimental group E-4 (7% TiO2 GIC) and experimental group E-5 (10% TiO2 GIC). The percentage distribution of commercial conventional GIC and TiO2 NPs is shown in Table 2. These 9.5 × 1 mm TiO2 GIC cylinders were then embedded in epoxy resin blocks and dried for about 24 h. These samples were then polished with silicone carbide papers of 400, 600 and 1000 grit [13].
Table 1 Composition of conventional GICTable 2 Experimental groups containing conventional GIC and different percentages of TiO2 NPsVickers microhardness testing
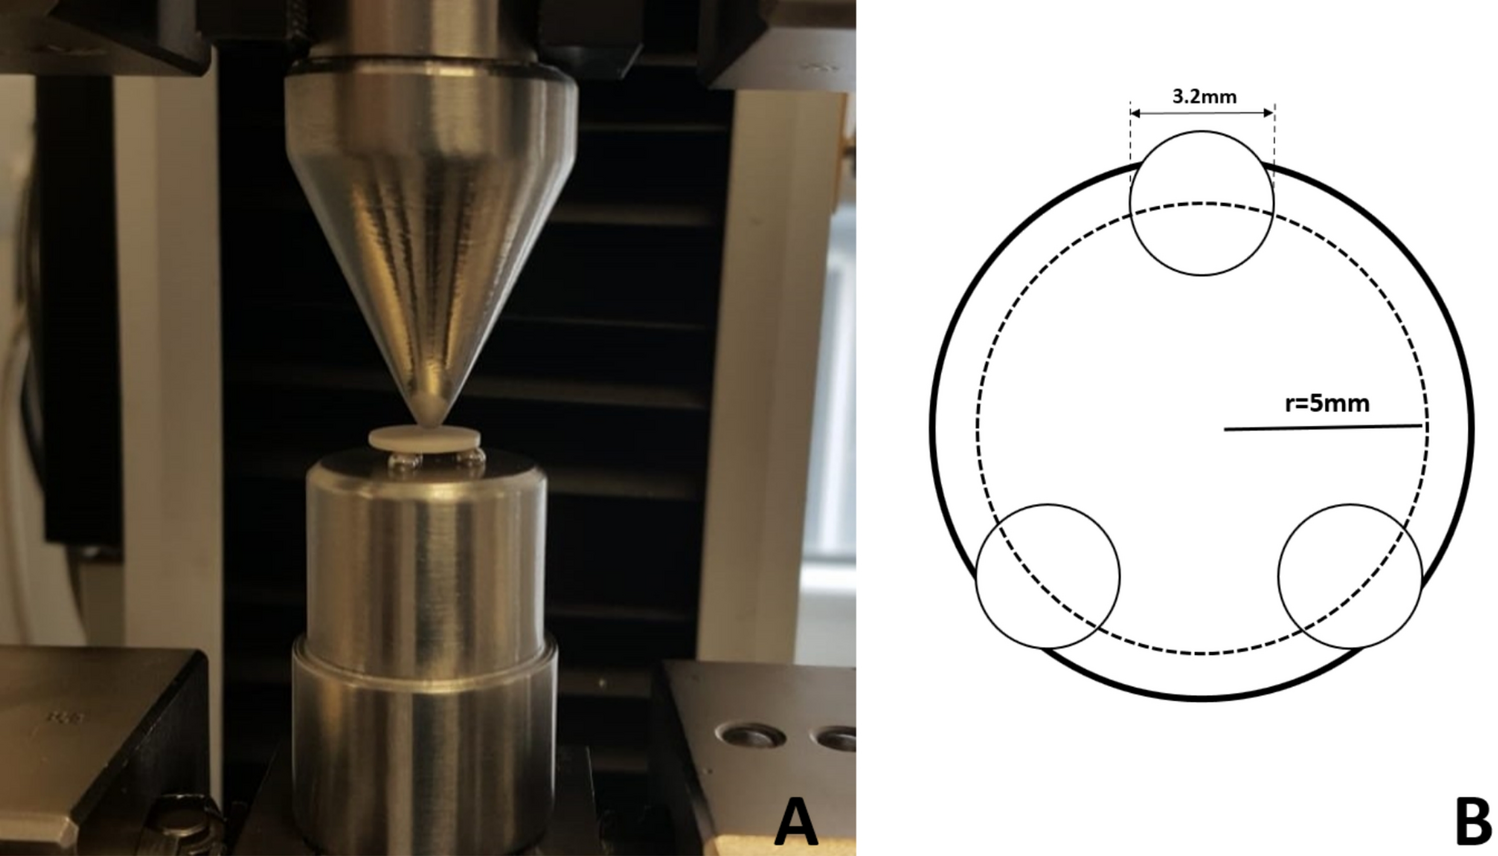
The Vickers microhardness tester (Model: 401 Mud, S/N: 414, Wolpertw group, Atlanta, USA) was utilized as suggested by ISO 9917-1:2007 to obtain accurate measurements of microhardness for all samples of TiO2 GIC prepared cylinders as mentioned above. These TiO2 GIC prepared cylinders were placed one by one under a Vickers microhardness tester and a 3 N force was applied for 15 s to record their microhardness. Three readings were taken on one sample and then the average was estimated [13].
Scanning electron microscope (SEM) analysis
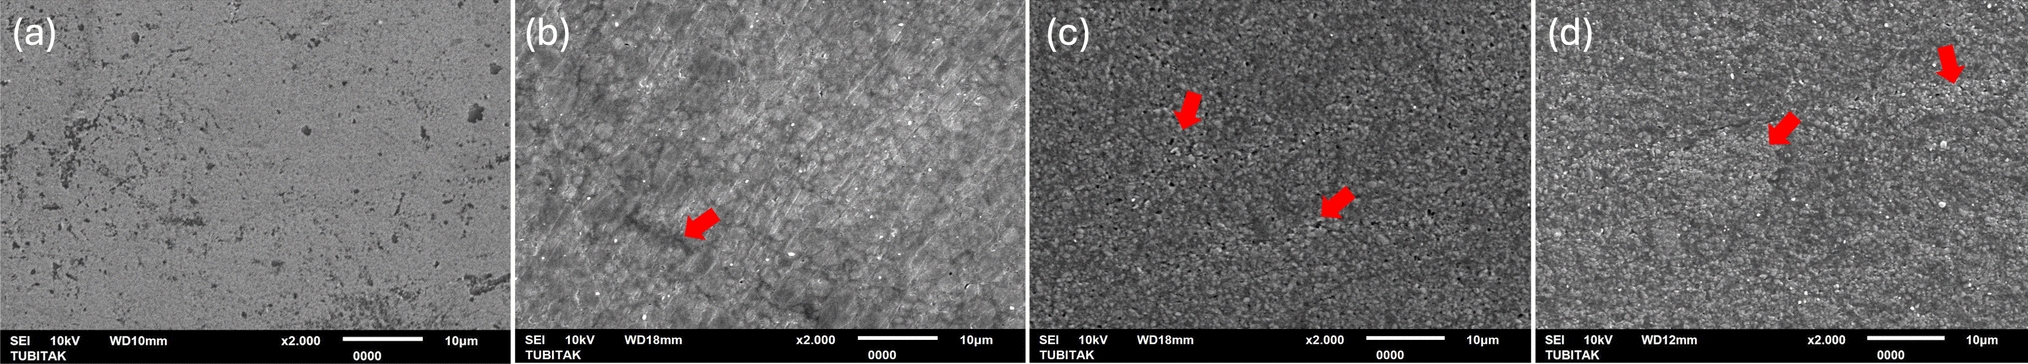
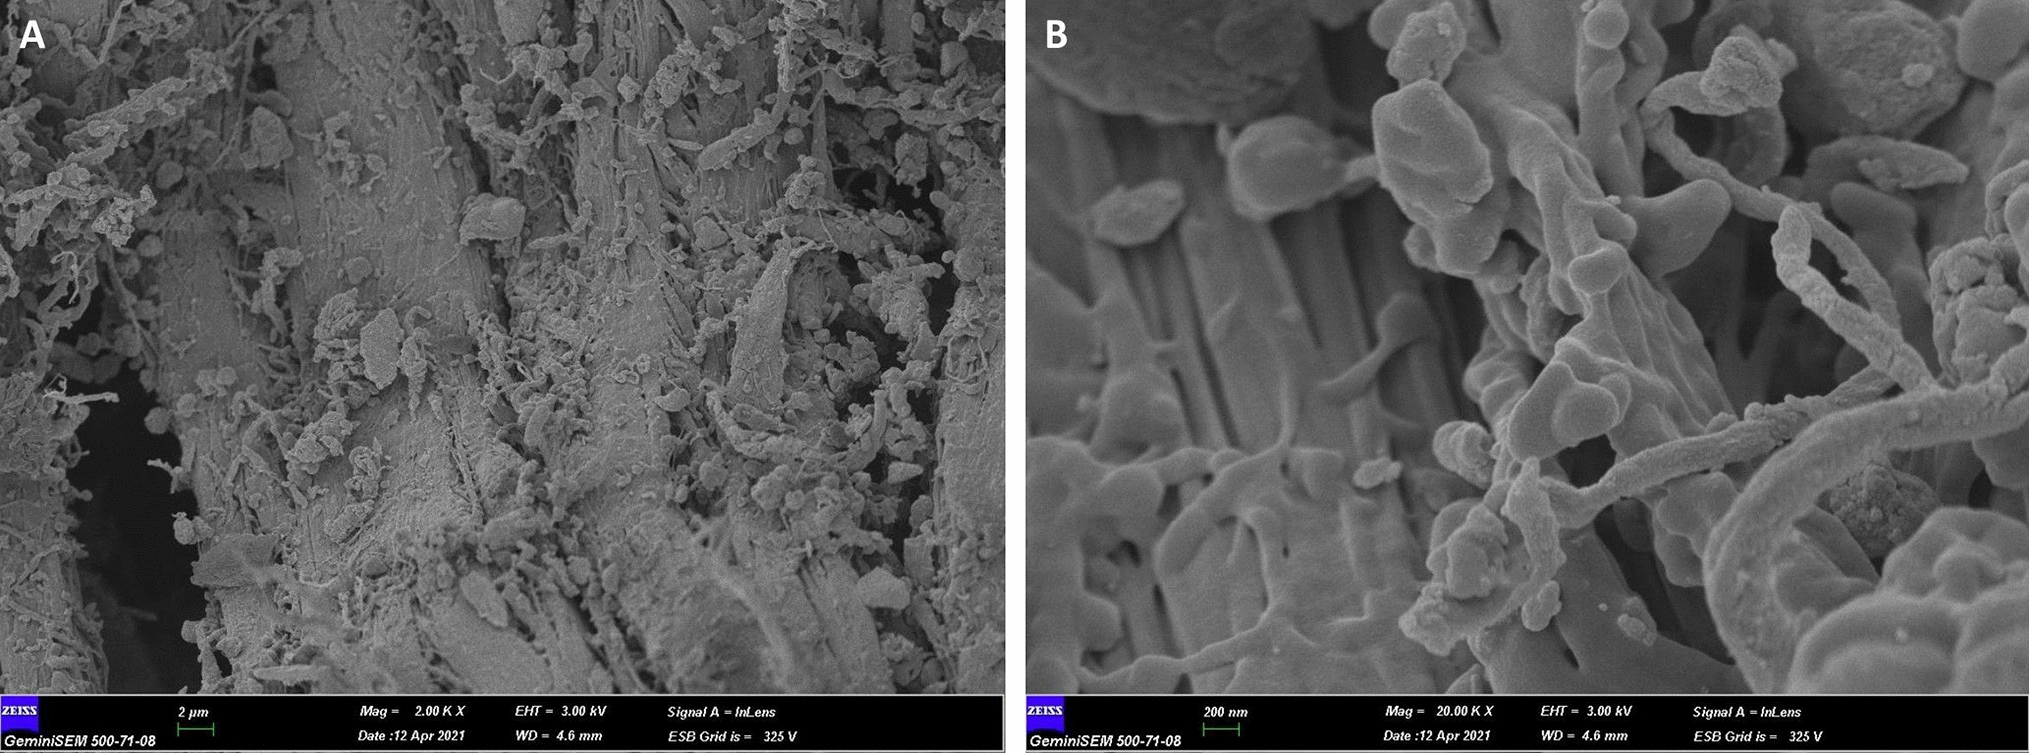
All samples such as conventional control group E-1, E-2, E-3, E-4 and E-5 were removed from epoxy resin blocks after carrying out Vickers microhardness testing, which were then finished, cleaned and sputter coated in a sputter coating machine (Quorum: Technologies; Ltd. Ashford, Ken; England) for at least 30 min. Then, all these samples were observed for cracks in SEM (Nova NanoSEM 430; Fei Company 4022 261 49391-S column F&G stron prep, Hillsboro, OR, USA) at different magnifications [13].
Statistical analysis
Statistical analysis in the current study was done by IBM SPSS v 24.00 (IBM Corporation, Armonk, NY, USA). One-way ANOVA and post hoc Tukey were performed for multiple comparisons where the significance was kept at p value < 0.05.

Comments (0)