
Remember me

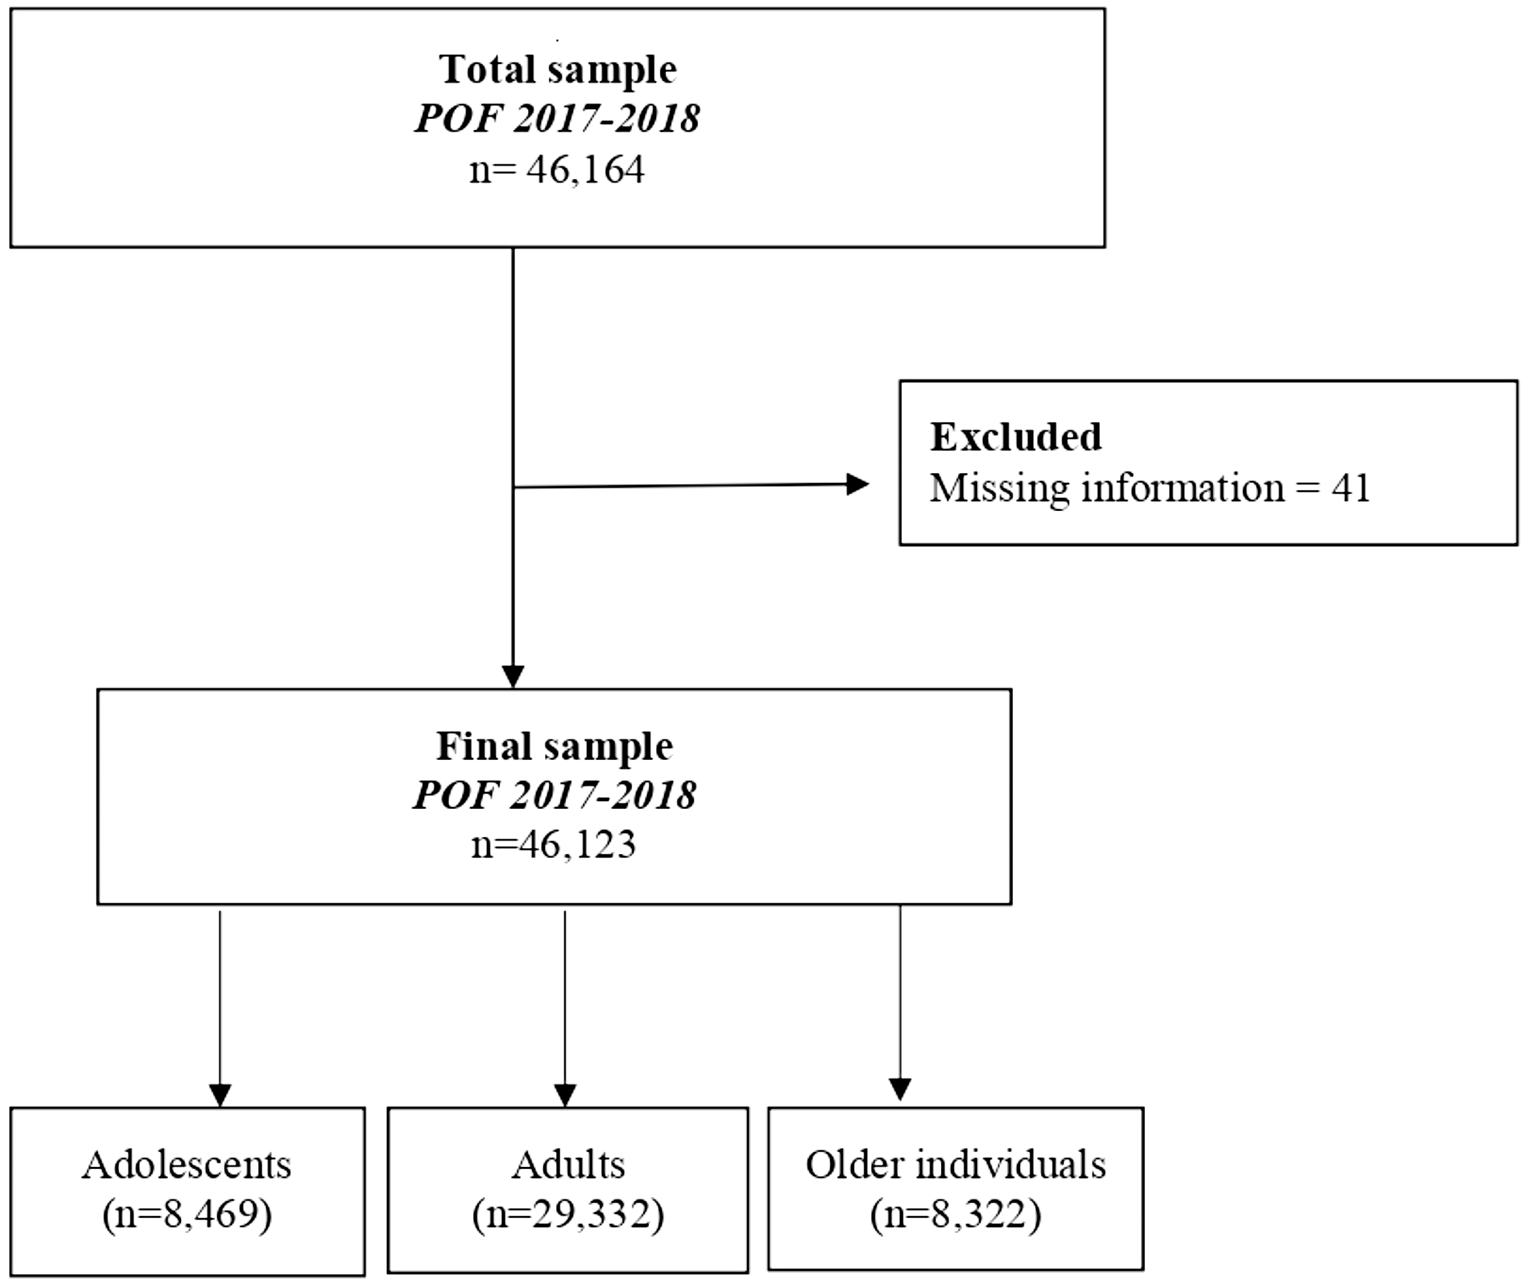

Figure 1 shows the flowchart of studies in the review process. After removal of duplicates, 493 records were identified by the initial literature search. Through review of titles and abstracts, 24 potentially relevant articles were selected for full-text evaluation. Subsequently, 9 eligible randomized controlled studies met the inclusion criteria [10,11,12,13, 21,22,23,24,25].
Fig. 1
PRISMA flow diagram of study selection through the systematic review process. PRISMA, Preferred Reporting Items for Systematic Reviews and Meta-Analysis
The characteristics of the studies included in the systematic review are presented in Table 2. Briefly, studies ranged in size from 28 to 180 participants per study, with mean ages of participants ranging from 22 to 30 years. Location of interventions ranged from Iran (4 studies) [10, 11, 21, 25], USA (2 studies) [12, 23], Austria (1 study) [13], India (1 study) [22], and UK (1 study) [24]. Study durations ranged from 8 weeks (4 studies) [10, 11, 21, 23] to 12 weeks (4 studies) [12, 22, 24, 25], and 24 weeks (1 study) [13]. In terms of body mass index (BMI), participants ranged from normal BMI (18.5-24.9 kg/m2) (1 study) [25], overweight (25.29.9 kg/m2) (5 studies) [11, 13, 21,22,23], and obese (>30 kg/m2) (2 studies) [12, 24]. Abootorabi et al [10] did not report data on BMI. Based on cut-off values for insulin resistance (defined as HOMA-IR ≥2.1) [26] all but one [23] of the included studies had a insulin resistant intervention or control group at baseline.
Table 2 Participant characteristics and intervention details of the 9 included studiesVitamin D interventionsIndividual doses of vitamin D ranged from 3,200 IU (1 study) [24], to 12,000 IU (2 studies) [12, 22], to 20,000 IU (1 study) [13], and to 50,000 IU (5 studies) [10, 11, 21, 23, 25].
Frequency of vitamin D dosage ranged from once per day (2 studies) [12, 24], to once per week (4 studies) [10, 13, 22, 23], to once every 2 weeks (2 studies) [11, 25], to once every 20 days (1 study) [21].
Daily vitamin D dose varied with ranges of 1000-4,999 IU per day (6 studies) [11, 13, 21, 22, 24, 25], 5000-9,999 IU (2 studies) [10, 23], and 10,000-12,000 IU (1 study) [12].
Risk of bias assessmentRisk of bias of RCTs was evaluated with the revised Cochrane risk of bias tool. This tool determined 5 studies had low risk of bias [10,11,12, 21, 24], 3 studies had some concerns of bias [13, 23, 25], and 1 study had a high risk of bias [22] (Fig. 2).
Fig. 2
Risk of bias summary for the included studies
AdherenceRegarding supplement adherence, all but 2 studies [12, 22] provided details on how this was monitored and included: collection of used supplement containers [11, 13, 24, 25]; and adherence phone calls/interviews with research staff [10, 21, 23].
Study summaries and outcomesFasting glucose was the most commonly measured of the specified outcomes (8 studies) [10,11,12,13, 21, 22, 24, 25], followed by HOMA-IR (8 studies) [10,11,12,13, 21, 23,24,25], fasting insulin (6 studies) [
Comments (0)