
Remember me


Patient characteristics and the status of the development of AFO are summarized in Table 1. The median age at transplantation was 48 years (range 17–66 years). The graft sources comprised bone marrow in 60.6%, peripheral blood stem cells (PBSC) in 18.2%, and cord blood in 21.2%, in which grafts were received from related donors in 29.5% and unrelated donors in 70.5%. A myeloablative and reduced-intensity conditioning regimen was used in 54.5% and 45.5% of patients. A total body irradiation (TBI)-based conditioning regimen was provided in 68.2% of patients and a busulfan (BU) regimen in 29.5%.
Table 1 Patient characteristicsIncidence of AFO after allo-HSCTForty-six patients met the diagnostic criteria for AFO with a 2-year cumulative incidence of 35.0% after transplantation (Fig. 1A). The median time to AFO diagnosis after transplantation was 101 days (range 35–716 days). PFTs were analyzed at the following three-time points: pre-transplant (median, 26 days before transplantation (day 26); range day 160–8), three months after transplantation (median, 100 days after transplantation (day 100); range day 55–237), and one year after transplantation (median, 361.5 days after transplantation; range day 231–467). In the AFO group, %VC, pFEV1, and FEV1/FVC significantly decreased at three months after transplantation compared to the pre-transplant (P < 0.01). There was a trend decrease one year after transplantation (Fig. 2A, B, C). The pre-transplant pFEV1 was significantly lower in the AFO group (mean ± SD, 91.9% ± 16.4%) than that in the non-AFO group (mean ± SD, 99.8% ± 15.5%; P < 0.01) (Fig. 2B). Moreover, the pre-transplant FEV1/FVC was also significantly lower in the AFO group (mean ± SD, 79.5% ± 7.8%) than that in the non-AFO group (mean ± SD, 84.8% ± 8.0%; P < 0.01) (Fig. 2C).
Fig. 1
Cumulative incidence of AFO and BOS. A A 2-year cumulative incidence of AFO in all the patients was 35.0%, and the median AFO onset was 101 days (range 35–716 days) after transplantation. B A cumulative incidence of BOS from landmark days in the AFO and the non-AFO groups. In patients with AFO, the post-transplant day of AFO development is defined as the landmark day; in patients without AFO, the landmark day is defined as 101 days after transplantation, the median day of AFO onset in patients with AFO
Fig. 2
Changes in the results of pulmonary function tests (PFTs) in the AFO and the non-AFO groups. A Vital capacity as a percent of predicted (%VC), B predicted forced expiratory volume in one second (pFEV1), C forced expiratory volume in 1 s per forced vital capacity (FEV1/FFC) ratio at the pre-transplant, three months after transplantation, and one year after transplantation in the AFO and the non-AFO groups. Results are shown as means ± SD. A In the AFO group, the mean %VC at the pre-transplant, the three months after transplantation, and the one year after transplantation was 95.7 ± 13.4%, 86.3 ± 16.6%, and 85.2 ± 16.6%, respectively. B In the AFO group, mean pFEV1 at the pre-transplant, the three months after transplantation, and the one year after transplantation was 91.9 ± 16.4%, 79.6 ± 19.1%, and 75.1 ± 21.6%, respectively. C In the AFO group, the mean FEV1/FVC ratio at the pre-transplant, the three months after transplantation, and the one year after transplantation was 79.5 ± 7.8%, 75.2 ± 8.3%, and 72.1 ± 13.7%, respectively. The data were shown in only analyzed patients whose information at all 3 points was available (n = 98). The number of patients at the pre-transplant, the three months after transplantation, and the one year after transplantation was 132, 132, and 98, respectively, and analyses using a linear mixed-effects model were performed to exclude the impact of patients with missing data and did not change the results
Risk factors for developing AFOThis study explored the risk factors for developing AFO (Table 2). Age ≥ 50 years at transplantation (odds ratio [OR], 2.19; 95% confidence interval [CI], 1.06–4.55; P = 0.03), high-risk disease (OR 2.48; 95% CI 1.18–5.21; P = 0.02), PBSC as stem cell source (OR 3.32; 95% CI 1.34–8.27, P < 0.01), pre-transplant FEV1/FVC ratio < 0.8 (OR 4.06; 95% CI 1.85–8.90; P < 0.01) and smoking history before transplantation (OR 2.61; 95% CI 1.23–5.52; P = 0.01) were the risk factors for developing AFO in the univariate analysis. In a multivariate analysis of each risk factor extracted in univariate analysis, PBSC as stem cell source (OR 3.42; 95% CI 1.27–9.25; P = 0.02) and pre-transplant FEV1/FVC ratio < 0.8 (OR 3.26; 95% CI 1.33–7.98; P = 0.01) were significant risk factors for developing AFO.
Table 2 Univariate and multivariate analysis of risk factors for developing AFOAssociation of acute and chronic GVHD with the AFO developmentThe incidence and severity of acute GVHD were not associated with AFO development (Table 3). Chronic GVHD was observed in 37 of 46 patients with AFO. Therefore, the incidence of chronic GVHD was significantly higher in the AFO group than in the non-AFO group (80.4% vs. 47.7%, P < 0.01). In the AFO group, 20 of 46 patients (43.5%) had active chronic GVHD at the time of AFO diagnosis. In contrast, 17 (37.0%) developed chronic GVHD after AFO diagnosis, and the median time to chronic GVHD development after AFO diagnosis was 41 days (range 1–181 days; Fig. 3). The incidence of moderate or severe chronic GVHD in the AFO group was significantly higher than in the non-AFO group (76.1% vs. 27.9%, P < 0.01).
Table 3 Incidence and severity of acute and chronic GVHD with the development of AFOFig. 3
Distribution of time to onset of chronic GVHD in AFO patients. Twenty of 46 patients in the AFO group (43.5%) developed chronic GVHD preceding AFO diagnosis, whereas 17 patients in the AFO group (37.0%) had AFO diagnosis preceding chronic GVHD and the median time to develop chronic GVHD from AFO diagnosis was 41 days (range 1–181 days) in 17 patients
Progression to BOS after the onset of AFOOf the 46 patients diagnosed with AFO, 22 developed BOS with a 5-year cumulative incidence of 49.1% after AFO onset (Fig. 1B), in which eight (17.3% of AFO patients) already met the diagnostic criteria for BOS at the time of AFO diagnosis. None of the non-AFO patients developed BOS. The median time to BOS diagnosis was 229 days after transplantation (range 62–1230 days) and 77 days after AFO diagnosis (range 0–693 days). When we calculated the predictive characteristics of the AFO criteria for the development of BOS, we observed a sensitivity of 100%, a specificity of 78.2%, a positive predictive value of 47.8%, and a negative predictive value of 100%.
Survival and NRM associated with the development of AFOThe 5-year OS in the AFO group was significantly inferior to that in the non-AFO group in semi-landmark analysis (67.6% vs. 79.6%, P = 0.04) (Fig. 4A). The cumulative incidence of relapse at five years in the AFO group and the non-AFO group was comparable (19.6% vs. 21.1%, P = 0.88) (Fig. 4B); the 5-year cumulative incidence of NRM in the AFO group was higher than that in the non-AFO group (24.7% vs. 7.1%, P < 0.01) (Fig. 4C). In the AFO group, 18 patients died of respiratory-related diseases (n = 6, 33.3%), the primary disease after relapse (n = 5, 27.8%), secondary cancers (n = 3, 16.7%), and other causes (n = 4, 22.2%), whereas in the non-AFO group, 18 patients died of the primary disease after relapse (n = 11, 61.1%), secondary cancers (n = 3, 16.7%), respiratory-related diseases (n = 3, 16.7%), and other causes (n = 1, 5.6%).
Fig. 4
Overall survival (OS), relapse, and non-relapse mortality (NRM) in the AFO and the non-AFO groups. A OS from landmark day. In patients with AFO, the post-transplant day of AFO development is defined as the landmark day; in patients without AFO, the landmark day is defined as 101 days after transplantation, the median day of AFO onset in the AFO group. B Cumulative incidence of relapse from landmark day. (C) Cumulative incidence of NRM from landmark day
We then analyzed an NRM risk after transplantation (Table 4). In univariate analysis, AFO development as a time-dependent variable (hazard ratio [HR] 3.95; 95% CI 1.63–9.58; P < 0.01), age ≥ 50 years at transplantation (HR 4.61; 95% CI 1.66–12.79; P < 0.01), and development of chronic GVHD as a time-dependent variable (HR 3.04; 95% CI 1.19–7.78; P = 0.02) were found to have a risk for NRM. In a multivariate analysis, patients who developed AFO after transplantation (HR 2.68; 95% CI 1.04–6.93; P = 0.04) or patients aged ≥ 50 years at transplantation (HR 3.40; 95% CI 1.09–10.58; P = 0.03) were found to have a significant risk for NRM, whereas development of chronic GVHD as a time-dependent variable was not a risk for NRM. Therefore, although there was a strong association between the development of AFO and chronic GVHD (Table 3), AFO development as a time-dependent variable was an independent risk for NRM, suggesting the importance of close monitoring the PFTs after allo-HSCT for early detection of AFO.
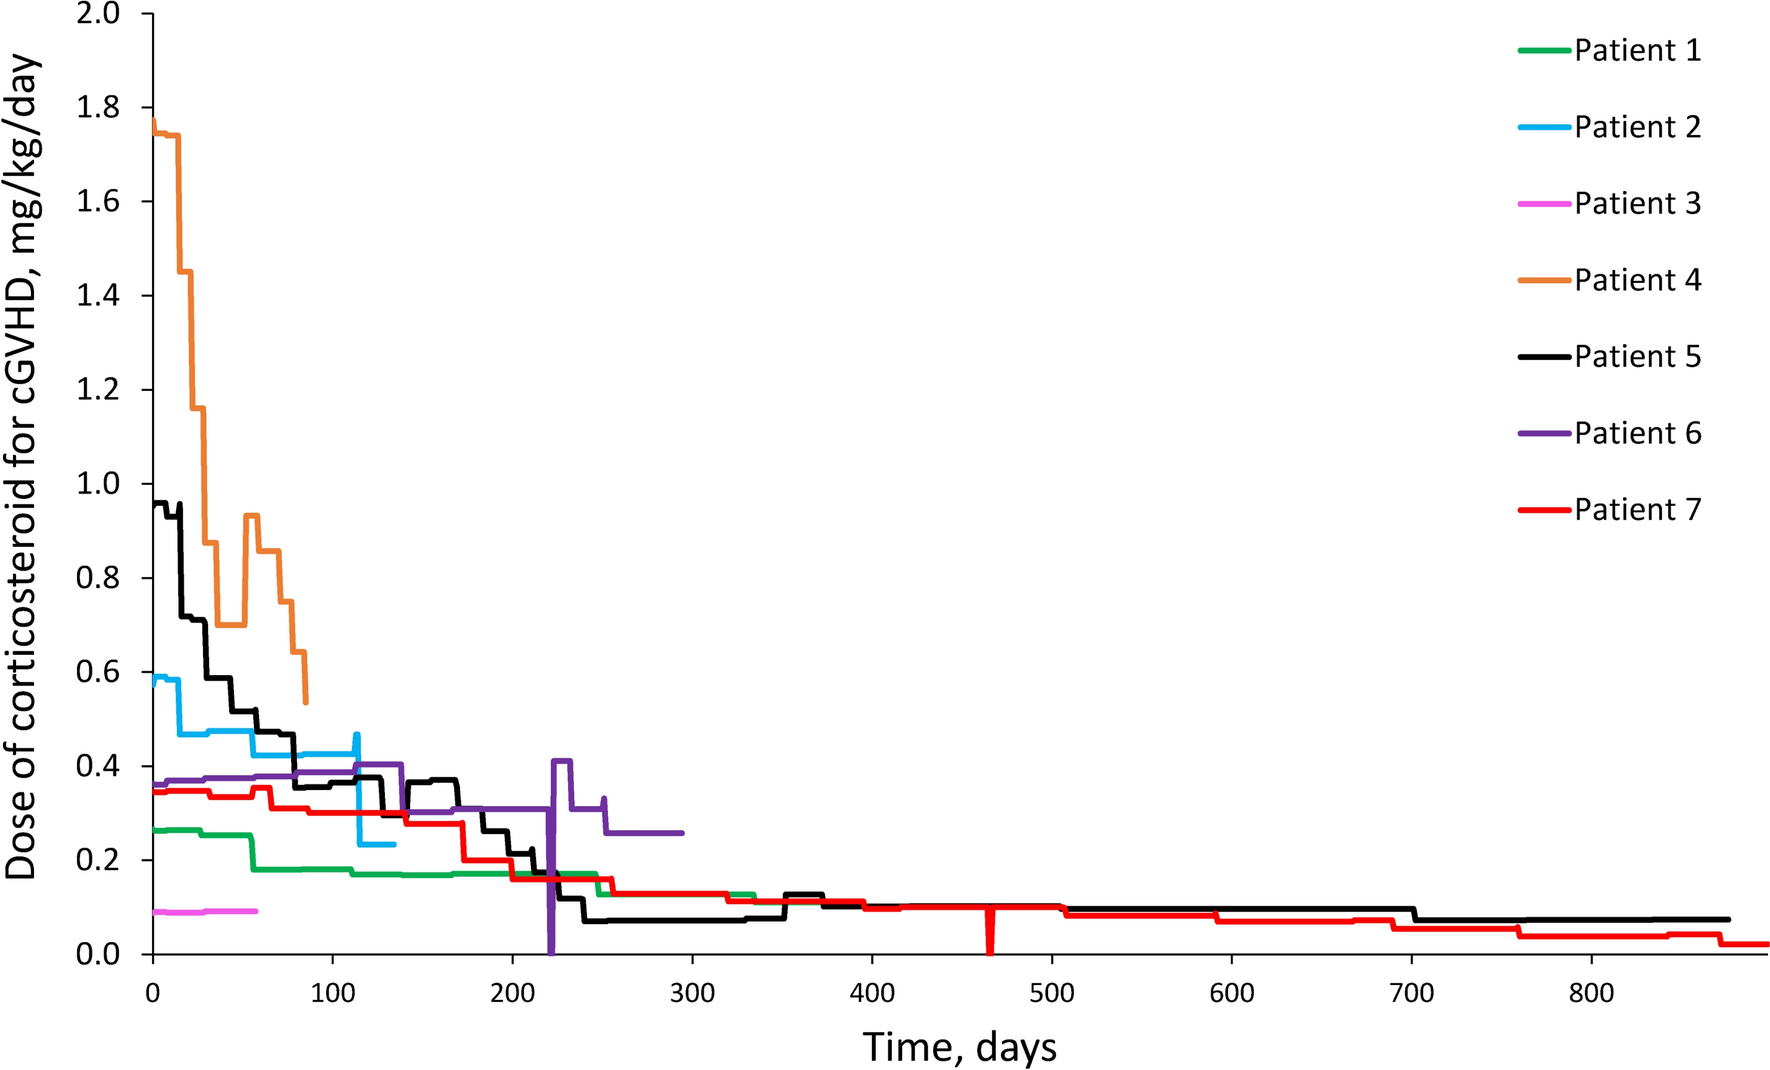
Table 4 Univariate and multivariate analysis of NRMImpact of therapeutic interventions for AFO on the incidence of BOSWe examined the impact of therapeutic interventions for AFO on the incidence of BOS. In our study, AFO patients received systemic or inhaled corticosteroids, with macrolides or montelukast as therapeutic interventions for AFO. Between 2006 and 2011, one in 12 AFO patients (8.3%) received treatment within three months of AFO diagnosis, whereas between 2012 and 2016, nine in 20 AFO patients (45.0%) received treatment. The cumulative incidence of BOS in the AFO group was 67.2% in 2006–2011 and 35.5% in 2012–2016, suggesting early intervention, including inhaled corticosteroids for AFO might prevent the development of BOS.
Comments (0)