
Remember me

Details of the design, methodology, and procedure were specified previously [31, 32]. In brief, we utilized data from the Kailuan study, a large community-based cohort study performed in northern China, with the participants being active and retired employees. From June 2006 to October 2007, the study was initially carried out, 101,510 employees and retirees (81,110 men and 20,400 women) were recruited from the Kailuan General Hospital and its 11 subsidiary hospitals. The subsequent surveys were issued biennially, with a total of eight visits for comprehensive examinations that included standardized questionnaire assessments, anthropometric measurements, clinical examinations, and laboratory tests up to December 31, 2020.
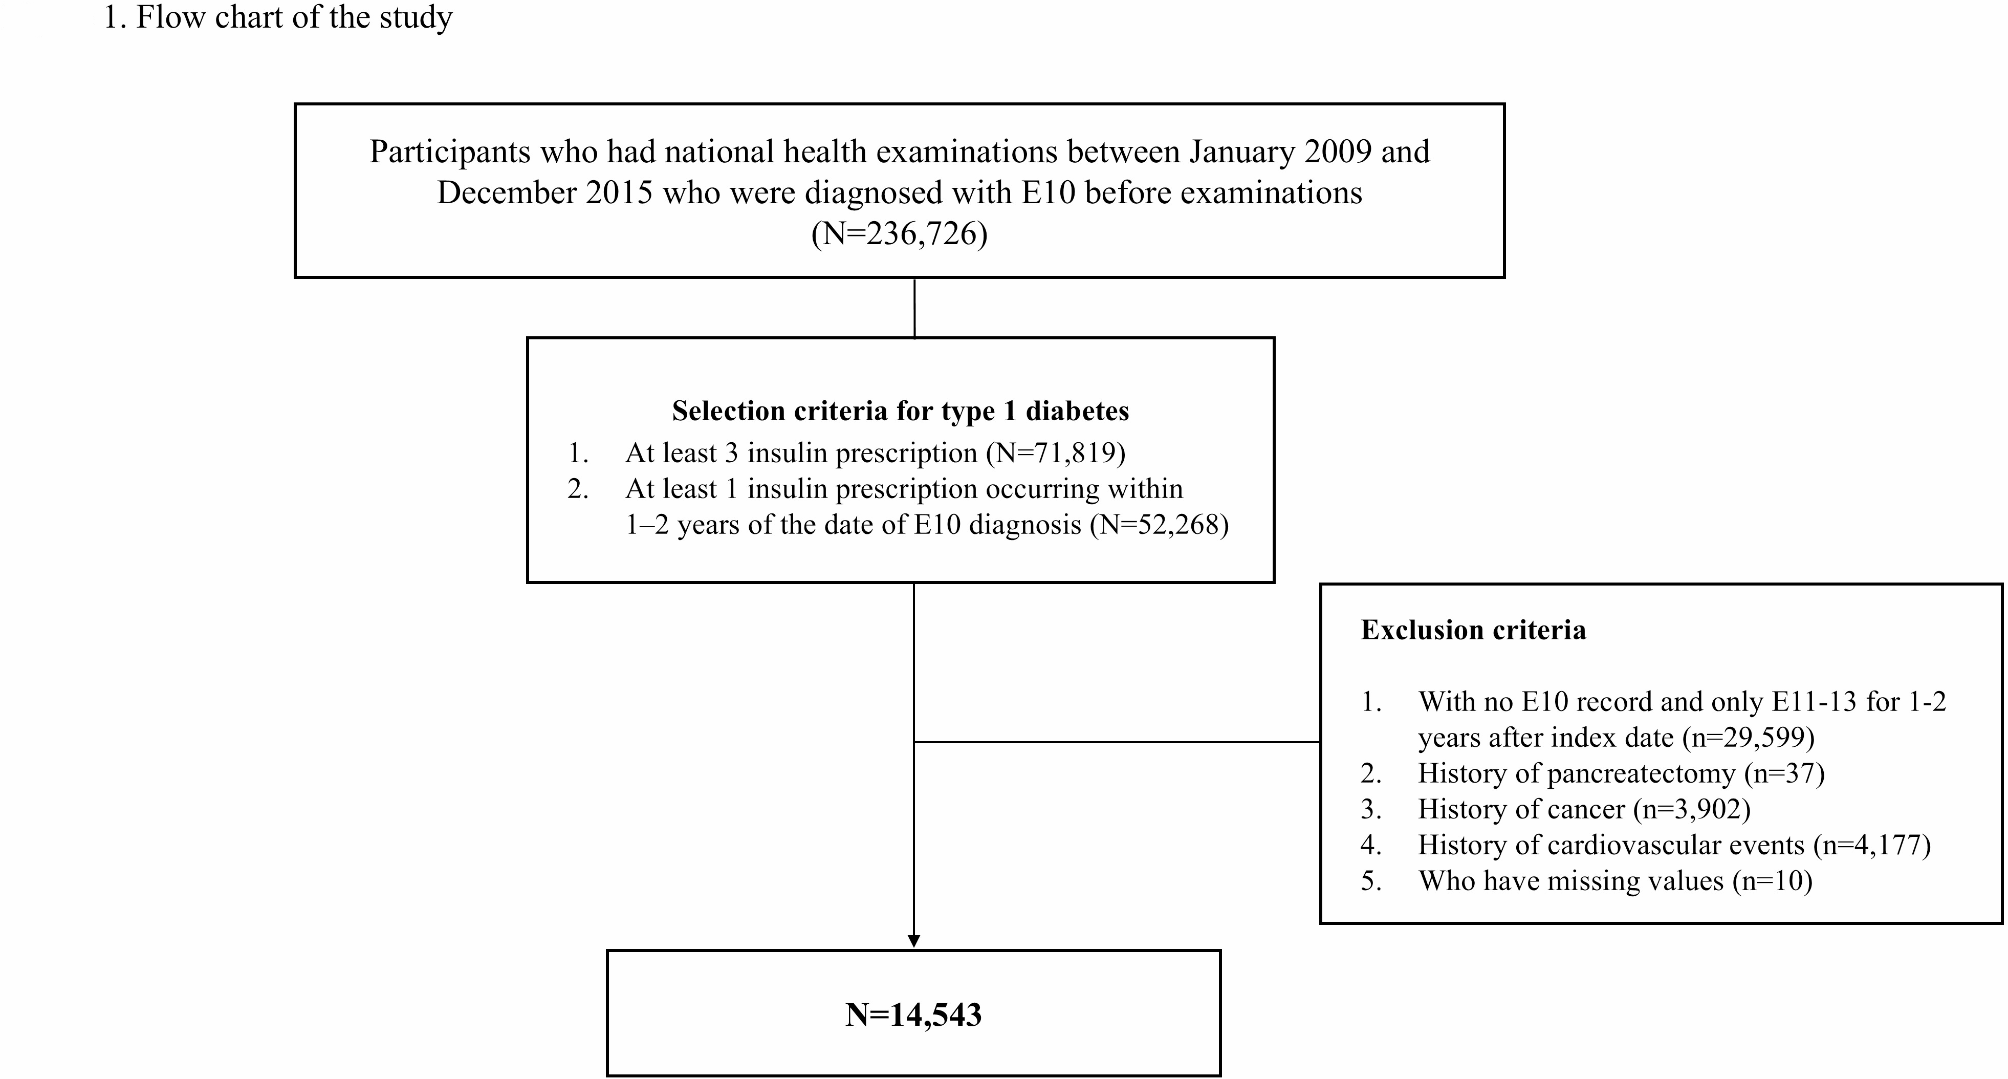
For this study, 45,794 hypertensive participants in the 2006 survey were initially selected. A total of 26,586 individuals who were missing complete repeated measurements of metabolic syndrome parameters were excluded, comprising 23,185 participants without stroke or myocardial infarction. Additionally, participants were excluded if they had a history of stroke or myocardial infarction; ultimately, a longitudinal analysis was conducted on a total of 17,789 individuals to examine variability in metabolic syndrome parameters and incident stroke. The flowchart of participant selection is available in Fig. 1.
Fig. 1
Flow diagram for participants include in the study
The research was performed following the guidelines of the World Medical Association Declaration of Helsinki and received ethical approval from the Ethics Committee of the Kailuan General Hospital. Written consent was procured from all participants or their legal representatives before every survey enrollment.
Data collectionInformation on demographic characteristics (age, gender, and education level), sociodemographic parameters (household income and occupation), lifestyle characteristics (alcohol consumption, smoking status, and physical activity), as well as family history of diseases and medication history (diabetes, stroke, myocardial infarction, and current treatments comprising antihypertensive, lipid-lowering, and antidiabetic drugs) was documented by well-trained physicians or nurses via structured questionnaire interviews. Education level was categorized as elementary school or below, middle school, and high school or above. Household income was categorized as < 1000 or ≥ 1000 per month. Smoking status was divided into never, ever, and current. Alcohol consumption was grouped as never, moderate, and heavy. After the participant sat for 15 min and refrained from smoking or drinking for 30 min, their blood pressure was measured. The measurement was conducted on the right upper arm by trained field workers utilizing a calibrated mercury sphygmomanometer. Three consecutive measuring values of blood pressure were obtained, with 5 min of rest between each measurement. The criteria for diagnosis of hypertension are SBP ≥ 140 mmHg, diastolic blood pressure (DBP) of ≥ 90 mmHg, self-reported specialist‐diagnosis history, or the use of antihypertensive medication [38].
Anthropometric measurements were measured by professionally trained physicians utilizing standardized instruments and protocols. Participants were asked to stand barefoot when measuring height, utilizing a tape rule with 0.1 cm accuracy. Weight was assessed utilizing calibrated platform scales with 0.1 kg accuracy in light clothing.
For venous blood sample detection, individuals fasted for 8–12 h, and blood samples were obtained during the routine examination day and infused into EDTA-vacuum tubes. The plasma was detached from the blood instantly and stored at − 80 °C for 4 h, with a CV of < 2.0% on blind quality control samples. All biochemical indicators were detected on the Hitachi 747 auto-analyzer, with the inter-assay CV being < 10% when using the autoanalyzer. The hexokinase/glucose-6-phosphate dehydrogenase method was utilized to measure FBG levels [33]. Serum TC, TG, low-density lipoprotein cholesterol (LDL-C), and HDL-C concentrations were all gauged using the enzymatic colorimetric method. Serum high-sensitivity C-reactive protein (Hs-CRP) level was gauged by the high-sensitivity particle-enhanced immunonephelometry assay and was log-transformed due to skewed distribution.
Assessment of variability in the metabolic metricsThe variability of each metabolic metric was established as the intra-individual variability in WC, SBP, FBG, HDL-C, and TG values across three measures in 2006, 2008, and 2010. Variability in metabolic metrics was assessed across four indices: coefficient of variation (CV), standard deviation (SD), average real variability (ARV), and variability independent of the mean (VIM). The CV was determined by dividing the standard deviation (SD) by the mean and was calculated accordingly:
$$SD=\sqrt_^_-\overline)}^}},$$
where \(_\) represents the \(^\) point value of each metabolic parameter, \(\overline\) is the mean, and N is the records of the metabolic metric number.
ARV refers to the mean value of the complete discrepancies between successive measurements, where N indicates the records of the metabolic metric number and i ranges from 1 to N-1. As such,
$$ARV=\frac-1}\sum_^\left|_-_\right|,\text,\text\hspace=\hspace3$$
Taking WC to exemplify, the VIM is computed first as the SD divided by the mean to the power of x, where x was derived through nonlinear regression analysis of the entire sample utilizing the PROC NLIN procedure in the SAS package[34]. As such,
$$VIM=\frac*\text(\text)}(\text)}^}, \text\hspace=\hspace\text(\text(\text))^$$
The CV was employed as the initial metric for variability assessment. The variability of each metabolic parameter was categorized based on quartiles, with high variability assigned as the highest quartile(Q4) and the lower three quartiles (Q1-Q3) representing low variability. Individuals were stratified based on the cumulative count of metabolic syndrome parameters exhibiting high variability (WC, SBP, FBG, HDL-C, and TG), with the number ranging from 0 to 5, where 0 indicated the absence of high-variability metabolic syndrome parameters and scores ranging from 1 to 5 represented the presence of varying quantity of high-variability parameters. The participants were categorized into four groups due to the presence of 0, 1, 2, or ≥ 3 high-variability metabolic parameters.
Outcome ascertainmentThe outcome was the first onset of stroke, classified into two main subtypes: hemorrhagic stroke and ischemic stroke, while hemorrhagic stroke encompassed both intracerebral and subarachnoid hemorrhage [35]. Examinations of incident stroke have been previously reported [36, 37]. Briefly, fatal and non-fatal cases were adjudicated from four complementary sources: (1) the Provincial Bureau of Life's Statistics and the Municipal Insurance record; (2) discharge lists from 11 hospitals in the Kailuan Group; (3) death certificates; (4) biennial self-report interviews conducted since 2006 (the cohort baseline). All stroke cases were confirmed based on coding from the ICD-Ninth and Tenth Revision (I60 to I61 for hemorrhagic stroke and I63 for ischemic stroke). The mortality information was obtained through medical records, autopsies, and death certificates, with stroke listed as the primary or contributing cause of death. The sudden onset of focal neurologic symptoms due to vascular disease that lasted over 24 h was utilized to identify nonfatal stroke events and verified by brain computed tomography (CT) and magnetic resonance imaging (MRI). Stroke events were further adjudicated by a panel of three experienced professionals, comprising a cardiologist, a neurologist, and a radiologist, who were unaware of both the study's methodology and the participants' exposure status.
Statistical analysisThe baseline characteristics were assessed, with continuous variables reported as mean ± SD or median (25–75%) based on distribution, and categorical variables as frequencies with percentages. Comparisons between groups were carried out utilizing the one-way ANOVA and the Mann–Whitney U test for normally distributed and skewed data, respectively, whereas categorical variables used the χ2 tests.
The CV was initially employed to evaluate the variability of metabolic syndrome parameters. The robustness of variability was assessed employing SD, ARV, and VIM. Spearman's correlation coefficient was employed to analyze the correlation between variability in WC, SBP, FBG, HDL-C, and TG. The cumulative incidence of total stroke and its subtypes were assessed utilizing Kaplan–Meier curves. Differences between survival curves were evaluated utilizing the log-rank test. Cox proportional hazards regression models were utilized to evaluate hazard ratios (HRs) and 95% confidence intervals (CIs) for the risk of total stroke and its subtypes over the period 2010 to 2020 across the number of high-variability parameters, with 0 high-variability metabolic indicators as the reference group. The Schoenfeld residual analysis was conducted to verify the proportional hazards assumption, and no variables were found to be violated. By dividing the stroke cases per 1000 person-years within the high-variability metabolic syndrome parameter category by the incident cases, stroke incidence rates were calculated. Person-years were determined by duration from the index year to the initial occurrence of the listed outcomes: incident stroke, mortality, or end of follow-up. We constructed three nested models step-by-step. Model 1 was non-adjusted; Model 2 adjusted for age (years) and gender; Model 3 additionally adjusted for education level, occupation, household income, smoking status, alcohol consumption, physical activity, dietary quality, antihypertensive, lipid-lowering, antidiabetic drugs, family history of diabetes, family history of stroke, family history of myocardial infarction, and averaged BMI, Hs-CRP during 2006–2010.
Several sensitivity analyses were conducted. (1) The internal correlation between the variability of metabolic parameters was examined; (2) Additional measurements including SD, ARV, and VIM were employed to determine the parameters variability; (3) Stratified by age (< 45, 45–65, 65–85, ≥ 85), gender (women, men), household income per month (< 1000, ≥ 1000 ¥), education (primary school or below, middle school, high or above), occupation (coalminers, other blue, or white collars), alcohol (never, moderate, heavy), smoking status (never, former, current), dietary quality (favorable, intermediate, unfavorable), physical activity (no, occasional, regular) categories were performed utilizing stratified analysis and interaction testing; (4) A lag analysis, excluding stroke events happening in the initial 2 years, was carried out; (5) Aiming at exploring the confounding effect of medications, participants who used antihypertensive, lipid-lowering, and antidiabetic agents were additionally excluded; (6) Individuals who had cancer or atrial fibrillation during follow-up were excluded; (7) After imputing the missing covariates by chained equations, the results remained consistent with the core results; (8) Our analyses were repeated by a Fine-Gray proportion subdistribution hazards model with death accounting for the competing event; (9) We substituted DBP for SBP to form quartiles of variability in metabolic parameters; (10) The E-value utilized to detect unmeasured confounding bias is also calculated.
Statistical analyses were accomplished with STATA V17 (STATA Corp LLC, College Station, TX) and SAS Version 9.4 (SAS Institute, Cary, NC, USA), with a 2-sided P < 0.05 considered statistically significant.
Comments (0)