
Remember me
Ten healthy male recreational runners volunteered to participate in the present study (age: 22 ± 3 years, height: 181 ± 8 cm, body mass: 79 ± 8 kg) (Peñailillo et al. 2015). Participants were considered “recreational runners” if they ran less than 4 days per week (Kuru 2016; Clermont et al. 2020). Prior to their inclusion in this study, the participants were screened for the following exclusion criteria: smoking, current medication or drug consumption, and presence of apparent cardiovascular, metabolic, neurologic, or musculoskeletal disease. Furthermore, participants were excluded if they practiced regular eccentric-based resistance training within a 6-month period prior to the start date of this study, as well as prolonged (> 20 min) and repeated (more than two times per week) downhill running practice. Participants were also excluded if they were already familiarized with other types of eccentric exercises (e.g., strength training) prior to this study. They were also instructed to avoid (i) aspirin, ibuprofen, or other anti-inflammatory drugs; (ii) the consumption of caffeine and/or alcohol on the day of the experiment; and (iii) any strenuous exercise for the entire duration of the investigation. All procedures were approved by the local ethics committee and this study conformed to the standards set by the Declaration of Helsinki (1965 and further modifications), except for registration in a database.
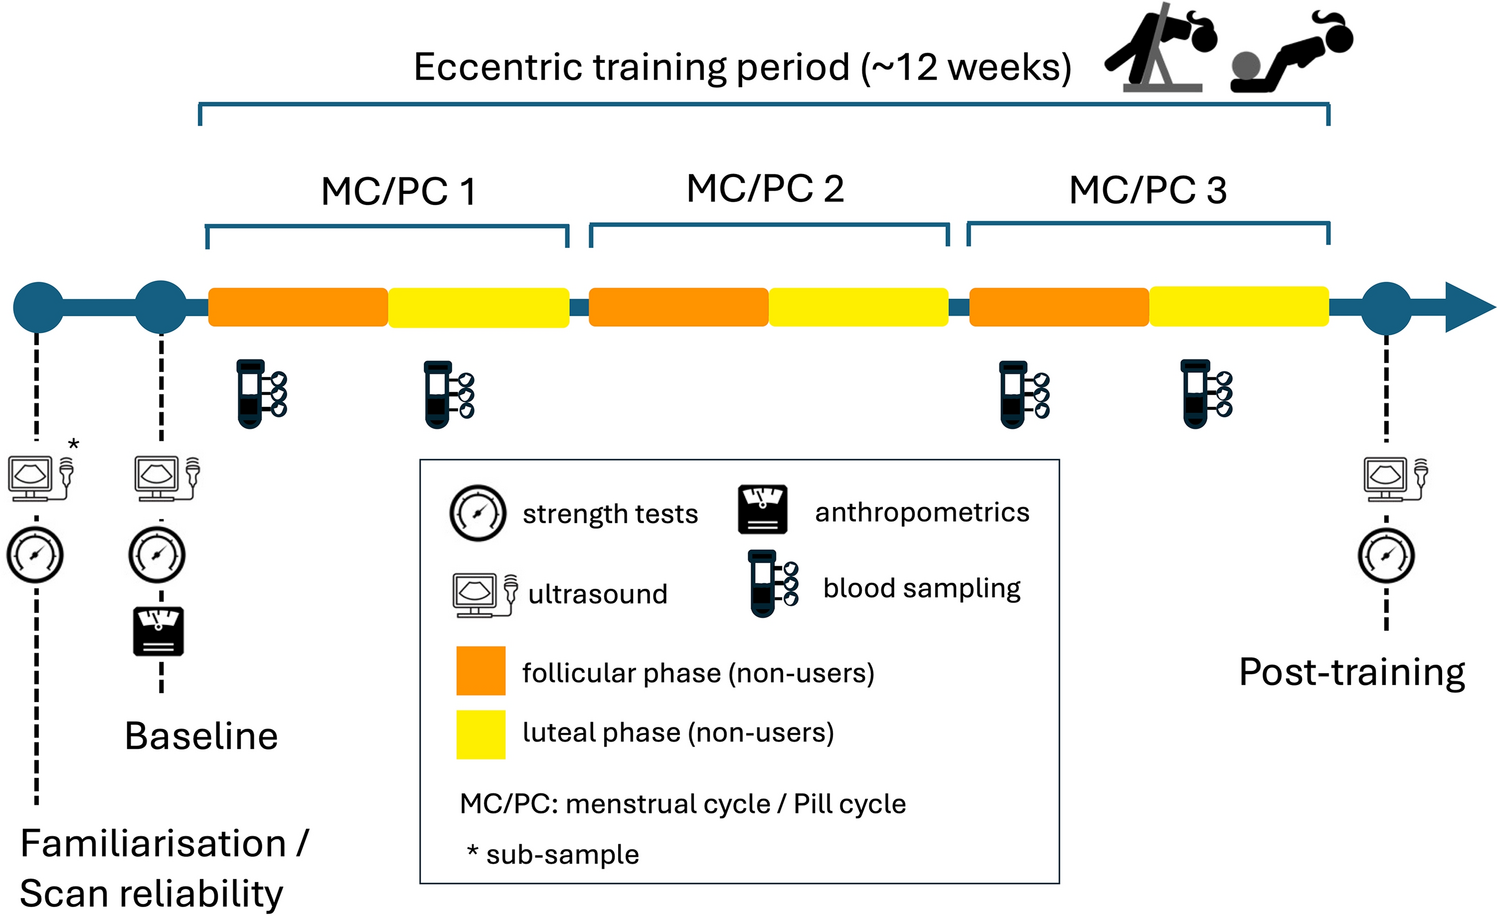
Experimental protocolTo investigate the duration of the downhill-induced muscle damage, the participants were tested at baseline (PRE) and 24 (POST24), 48 (POST48), 72 (POST72) and 96 (POST96) hours after the downhill bout. Participants first came for two familiarization sessions (separated by between 3 and 7 days), and again 1 week after the second familiarisation session for the experimental session. During the first familiarisation session, participants were familiarised with the procedures to identify the maximum voluntary isometric contraction (MVIC) and the RVFD. During the second familiarisation session, participants performed a single 5-min downhill run, replicating the experimental settings on the same treadmill used for the experimental session. Both the baseline assessments and the downhill running session were conducted on the same days. Room temperature and humidity were similar across sessions (21 °C, 45% RH). For each assessment session, the order was fixed as follows: venous blood samples, muscle soreness, muscle swelling, MVIC and RVFD (Chapman et al. 2008).
Maximum voluntary isometric contractionUnilateral right limb knee extensors MVIC was assessed with the participants seated with the hip and knee angles at 90° on a customized seat with a calibrated force transducer (Legcontrol, Mtraining, Ecole Valentin, France). In line with a previous investigation (Varesco et al. 2022), the lever arm of the dynamometer was adjusted to firmly attach the leg 3 cm above the medial malleoli with two non-compliant belts and a belt strapped over the waist was used to minimize extraneous movements of the upper body. Passive resting force was subtracted from the signal so that the baseline was set at 0 N (Varesco et al. 2022). Force signals were collected without analogical filters at a frequency of 2 kHz by PowerLab System (16/30-ML880/P, AD Instruments, Bellavista, Australia). The MVIC assessment was preceded by a standardized warm up consisting of 20 × 2-s knee extensions separated by 10 s each, and the participants were instructed to gradually increase the force up to the maximum volitional force (Coratella et al. 2020). After 5 min, two 4-s MVIC attempts were performed, separated by 5 min of passive rest. At baseline, if the difference between the two MVICs was > 5%, further trials were performed until the difference between two consecutive trials was < 5%. The participants were instructed to “push as hard as possible” and strong standardized encouragements were provided by the operators at each attempt. The maximum value was then retained for further analysis.
Rate of voluntary force developmentThe RVFD was assessed after 10 min of passive rest on the same customized seat and with the participants in the same position as for the MVIC. The participants were requested to “push as fast as possible” during eight impulsive unilateral right limb isometric knee extensions (Varesco et al. 2019). In case of a countermovement (determined by a force drop of 2 N below the baseline right before the impulsive contraction) or pre-tension (determined by a force level ≥ 2 N above the baseline right before the impulsive contraction) the contraction was repeated. The impulsive contractions were also repeated if the force level was < 70% of the MVIC that preceded the series of impulsive contractions (Varesco et al. 2022). All testing protocols were performed with real-time visual feedback. For each impulsive contraction, we computed the first derivative of the force–time curve, and retrieved the peak value as the point of maximal acceleration during the contraction. We then extracted and average value from data 5 ms before to 5 ms after this data point to compute peak RVFD value (Varesco et al. 2019). The onset of the voluntary force development was automatically defined as the point at which force exceeded the average resting baseline by ~ 2 N. The onset was also checked visually by an experienced operator blinded to the condition. The force was measured at 50 and 200 ms and the RVFD was calculated fitting a linear model over the 0–50 ms (RVFD0–50) and 100–200 ms (RVFD100–200) time-windows data points and extracting the slope of the model (Fig. 1). All data were analysed offline using Labchart 8 Software (ADInstruments, Bella Vista, Australia) and then retained for further analysis.
Fig. 1
Representative participant’s typical traces of the rate of voluntary force development (RVFD) at different time intervals from the onset before (PRE) and 24 h after (POST24) the downhill bout
Serum creatine kinaseVenous blood samples (~ 5 mL) were collected by standard venipuncture of the antecubital vein in SST II Advance Vacutainer® and in K2EDTA tubes (Becton, Dickinson & Co., Franklin Lakes, NJ, USA). Then it was immediately centrifuged at 3000 × g (15 min, 4 °C) and serum and plasma was aliquoted and stored at −80 °C until assayed. Serum concentration of muscle creatine kinase isoform (CKM), including skeletal (CK-MM) and cardiac (CK-MB) muscle isoenzymes, was measured by a SimpleStep ELISA® (Abcam, Cambridge, UK). Sensitivity, intra-assay (CVw), and inter-assay (CVb) variations were 270 pg/mL 2.2% and 7.4%, respectively.
Muscle swellingTo evaluate muscle swelling, the right thigh circumference was measured at 50% of the distance between the iliac spine and the patella using a seamstress meter with the participant seated, knee at 90° flexion (with 0° being full extension) and the lower limbs relaxed. To ensure consistency, the site was marked with a semipermanent ink. Three measurements were taken, and the mean was then retained for further analysis.
Muscle sorenessMuscle soreness was investigated as pressure pain threshold using an algometer (Pain Diagnostics and Thermography, New York, USA) on the right vastus medialis at 50% of the distance between the anterior superior iliac spine and the patella. The probe was placed perpendicular to the site and the investigator gradually applied force until the participant reported pain (Fischer 1987). Three measurements were performed, and the mean was then retained for further analysis.
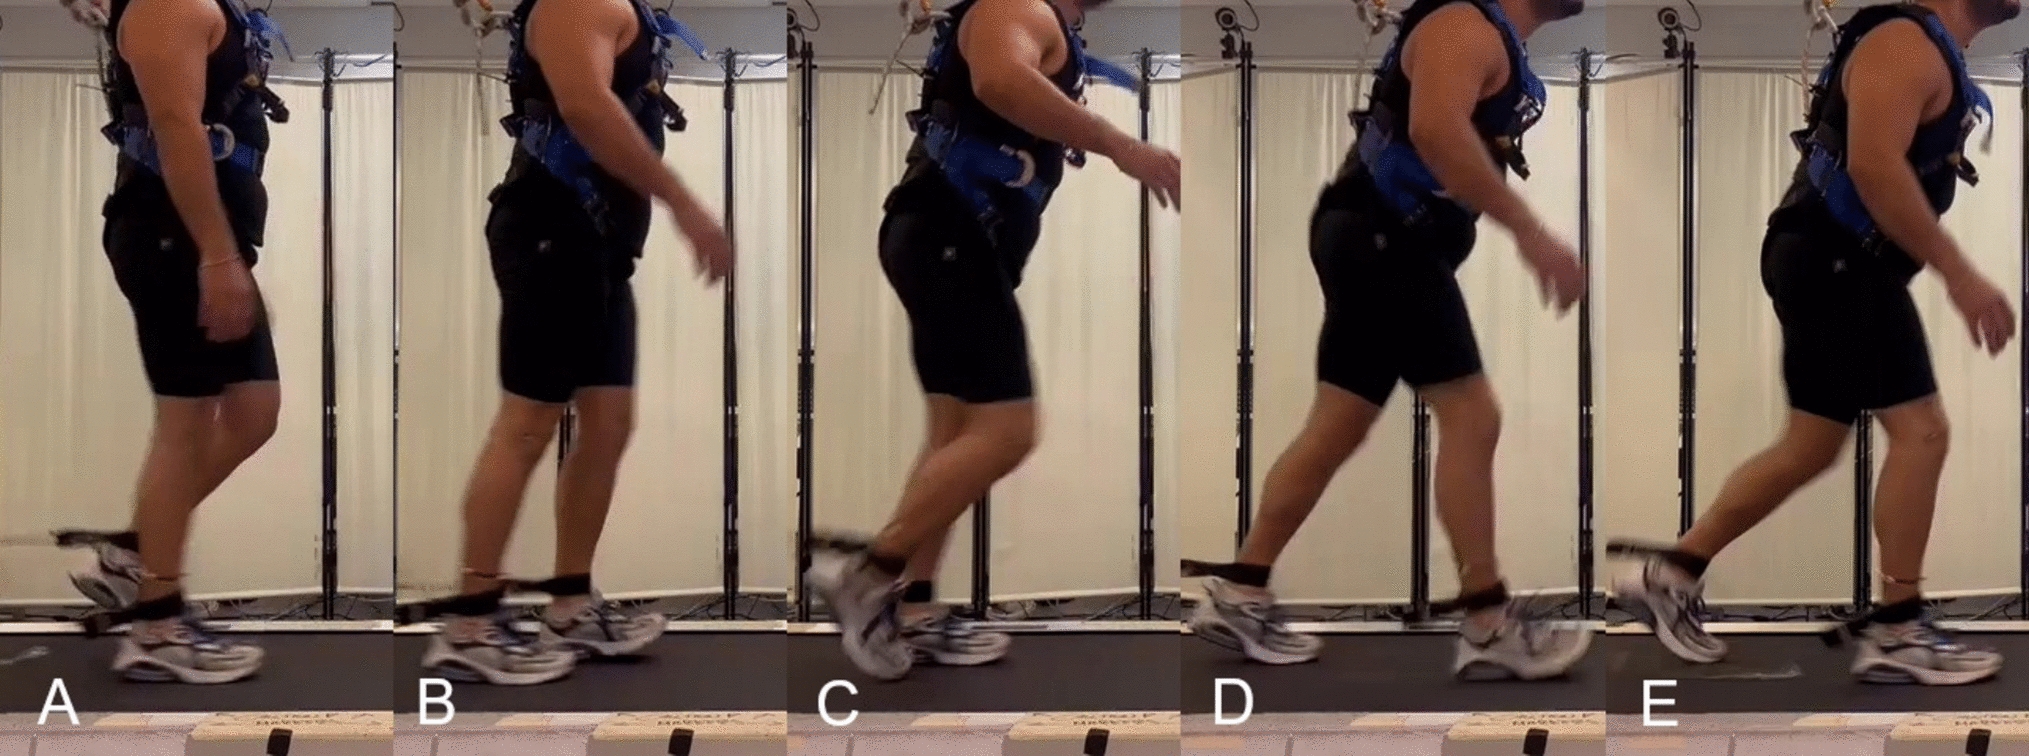
Downhill runningThe participants performed a 30-min downhill run at 10 km h−1and with a slope of −20% (−11.3°) on a motorized treadmill (Medic 2855, Genin Medical, La Roque-d’Anthéron, France) (Varesco et al. 2022). We used treadmill running given the similarity in running biomechanics observed with the downhill overground running (Firminger et al. 2018).
Statistical analysisResults are given as means ± standard deviations. The normality of distribution was verified using the Shapiro–Wilk normality test. To test differences between PRE and POST24/48/72/96, a longitudinal analysis was performed using generalized estimating equations (GEE; i.e., GEE under ‘generalized linear model’ procedure in SPSS v. 28) to take into account the correlated nature of observations within each participant (i.e., within-participant measurements) (Liang and Zeger 1986). If a significant main effect for time was observed, Bonferroni’s test was used for post hoc analysis. As a measure of effect size, Cohen’s d (d) was calculated and interpreted as follows: < 0.19 = trivial, 0.20–0.59 = small, 0.60–1.19 = moderate, 1.20–1.99 = large, > 2.00 = very large (Hopkins et al. 2009). The statistical analyses were conducted using IBM™ SPSS™ Statistics (version 28.0.0; IBM Corp., Somers, New York, NY) with the criterion α level set to 0.05.
Comments (0)