
Remember me
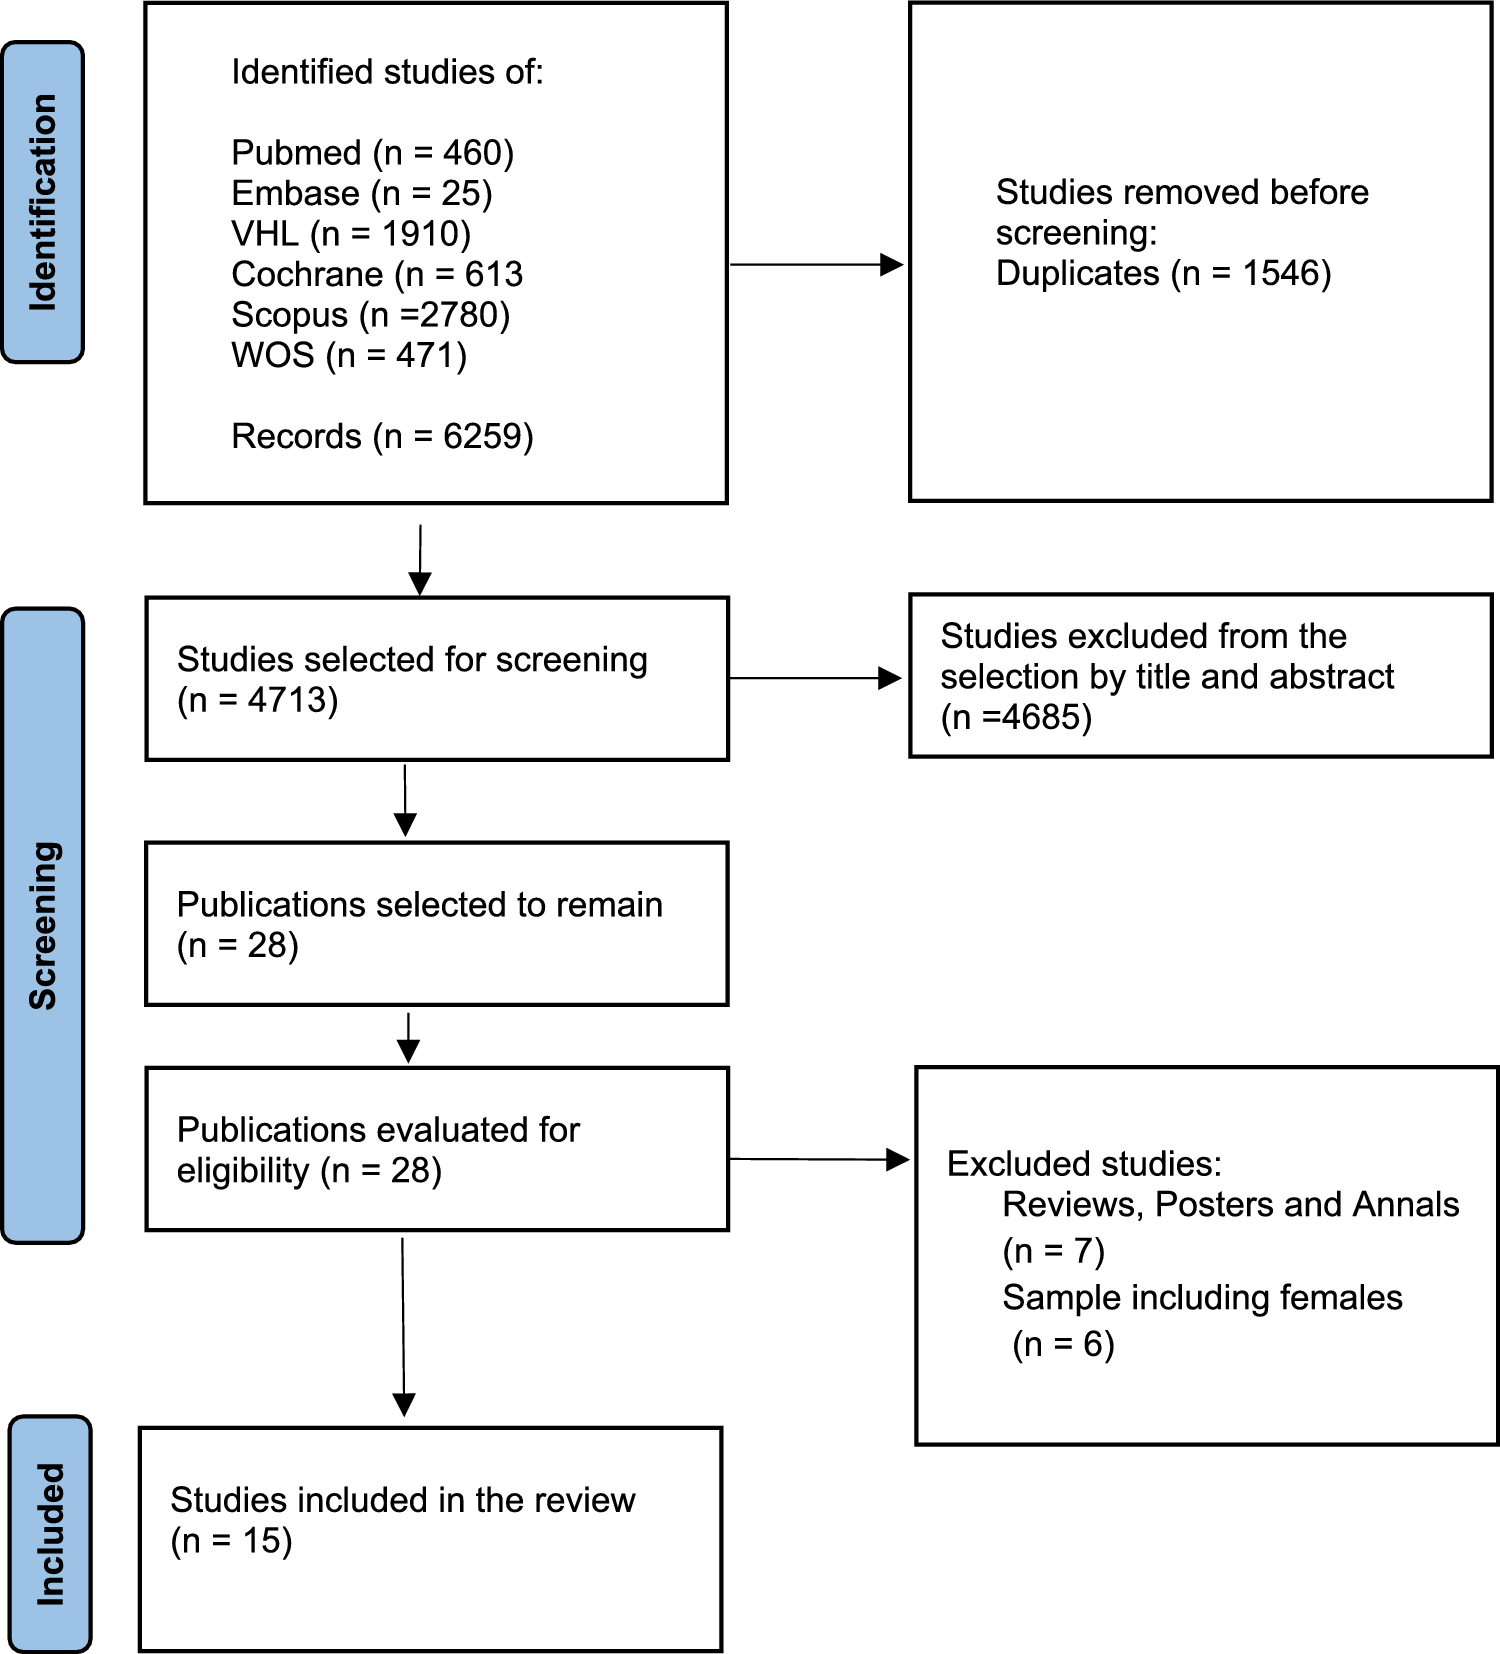
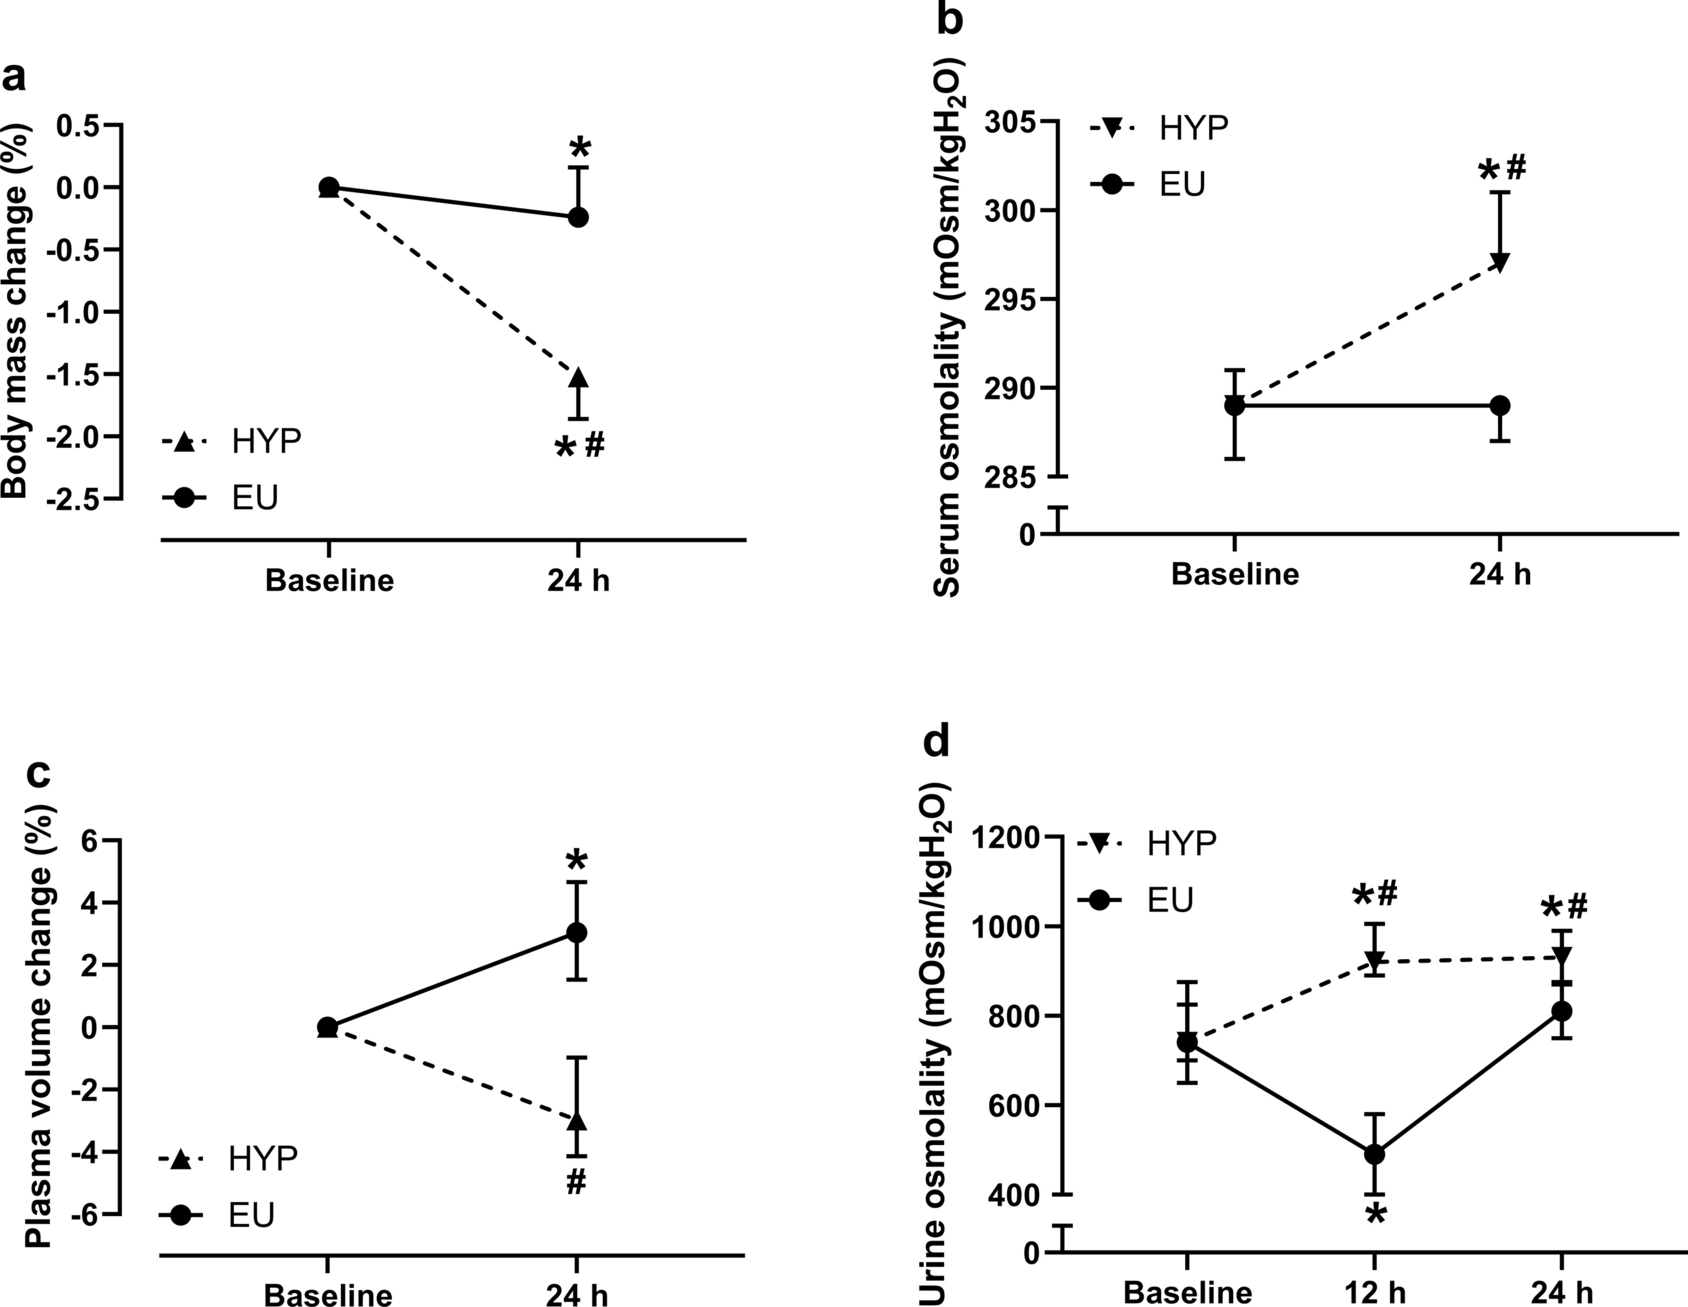
Twenty participants were enlisted for inclusion in the experiments. Five of them dropped out for personal reasons, seven were not able to complete the study for different reasons associated with the complexity of the protocol. Therefore, eight physically active male cyclists (age: 26.6 ± 6.2 years; body mass: 75.6 ± 8.7 kg; stature: 1.81 ± 0.04 m; maximum oxygen uptake, \(}_}}_}}\): 52.8 ± 7.9 ml∙min−1·kg−1; mean ± standard deviation) completed this protocol. None of them had any upper or lower limb disease nor cardiorespiratory pathologies. After being fully informed on the purpose of the investigation, the experimental design, and procedures, all the participants provided their written informed consent. The study was approved by the ethics committee of the University of Milan (#77/20) and was performed in accordance with the principles of the latest version of the Declaration of Helsinki.
Experimental designParticipants reported to the laboratory eight times, with at least 48-h in between. After a first visit for familiarization and anthropometric measurements, on a second occasion participants underwent incremental exercise testing on the cycle ergometer to determine their \(}_}}_}}\) and maximum mechanical aerobic power (\(}_}}\)) (Adami et al. 2013). During visits 3–6, they performed exhausting square-wave workloads to determine the CP. In visits 7–8, the volunteers performed randomly two sinusoidal tests of different exercise intensity domains until exhaustion, as detailed below.
Experimental proceduresAll the experimental sessions were conducted in a climate-controlled laboratory, with constant temperature of 20 ± 1 °C and relative humidity 50 ± 5%. Tests were performed approximately at the same time of the day to minimize any possible bias induced by circadian rhythms. On the day of the tests, participants were asked to abstain from caffeine and any other similar beverages for at least 12 h and to refrain from intense physical exercise for at least 24 h prior to testing. During the tests, participants were verbally encouraged and strongly motivated by operators to attain their best performance. In all tests, exercise cessation was established when the participant failed to maintain the cadence within the 5 rpm of imposed range for more than 5 s.
Familiarization and anthropometric assessment (visit 1)In the first session, the participants were equipped with a face mask and wearable devices to familiarize with the equipment for cardiopulmonary testing. Moreover, saddle height, handlebar angle of inclination, and foot position over pedal were adjusted individually and maintained during all the subsequent tests. Lastly, participant’s body mass and stature were, respectively, measured to the nearest 0.1 kg and 1 cm, by a mechanical scale equipped with a stadiometer (Asimed, Samadell; Barcelona).
Incremental exercise test (visit 2)On the second occasion, the \(}_}}_}}\) and its corresponding \(}_}}\) were determined through a step-wise incremental test (Adami et al. 2013). After 3 min of baseline recordings and 4 min of warm-up cycling at 100 W, work rate was increased by 25 W every 2 min until exhaustion.
Blood lactate concentration [La−] was assessed at baseline, at the end of each work rate, and at minute 1, 3, and 5 of recovery. At the same time of blood sample collection, the rate of perceived exertion (RPE) was asked on a general (RPEGEN; Borg 6–20), respiratory, and muscular (RPEMUSC and RPERESP, respectively; CR-10) standpoints. During all tests, participants were asked to keep the cadence between 90 and 100 rpm, because spontaneously adopted in cyclists to minimize local muscle stress and improve effectiveness of the skeletal-muscle pump in facilitating venous return to the heart (Lucia et al. 2004).
Critical power assessment (visits 3–6)On different days, to determine CP, four exhausting square-wave tasks at different intensities (90–115% \(}_}}\)) were administered (Hill 1993; Mattioni Maturana et al. 2018), so that the time-to-exhaustion was in the range between 2 and 20 min (Morton 2006; Vinetti et al. 2019).
Sinusoidal work rate tests (visits 7–8)After CP assessment, volunteers randomly performed two exhausting sinusoidal tasks at different work rates. The protocols involved 3 min of baseline recordings, followed by a warm-up of 3 min at 50 W and 3 min at CP, after which the sinusoidal exercise began in its downward midpoint crossing toward the nadir. The warm-up at CP was chosen to standardize the starting point of both protocols.
The mechanical power, as a function of time (t), fluctuated in a sinusoidal fashion according to:
$$f\left(t\right)=}+}\cdot }\left(\fract\right)$$
where, T is the period of the sinusoid, MP, the sinusoid midpoint, is the value around which the sinusoidal function oscillates, and AMP is the amplitude between MP and either the nadir or the zenith of the sinusoid.
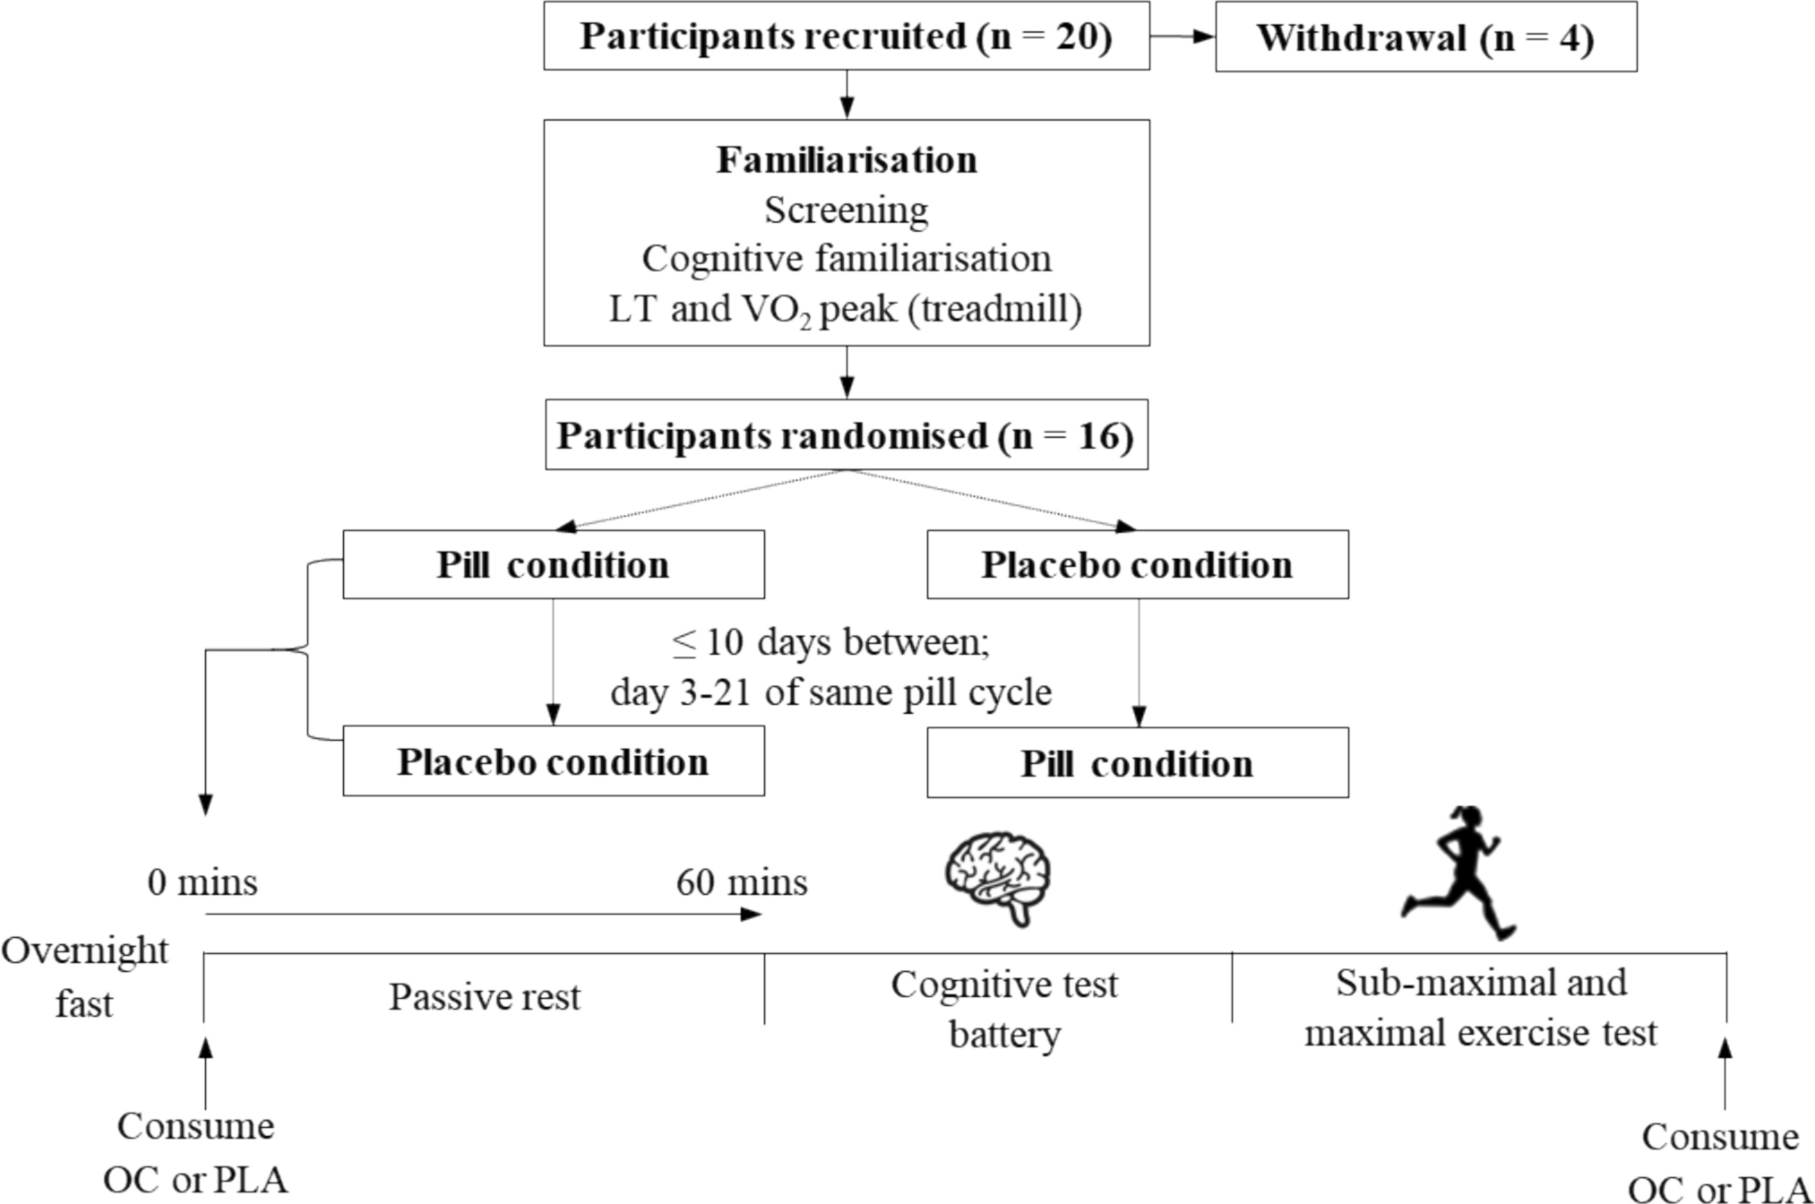
Based on previous study trials, the sinusoidal protocols had the MP for power set at or 50 W below the CP (CPex and CP-50ex, respectively). In both protocols, AMP and T were 50 W and 4 min, respectively (Fig. 1), so that the overall power change between nadir and zenith was 100 W. The investigated AMP was selected as absolute power, to make the energy balance assessment possible. The 4-min T was chosen because it is long enough to accommodate the primary component and at the same time long enough to reveal any impacts of a slower component (Haouzi et al. 1993).
Fig. 1
Illustration of the two original sinusoidal work rates: CPex (red line) and CP-50ex (blue line). CP critical power, MP midpoint, T period (color figure online)
[La−] and RPE values (RPEGEN, RPEMUSC and RPERESP, respectively) were determined at baseline, at the end of CP warm-up, at the end of each cycle (corresponding to downward MP crossing), and at minute 1, 3, and 5 of recovery.
MeasurementsTests were performed on an electro-mechanically braked cycle ergometer (mod. 839E, Monark, Sweden). During the experiments, the work rate and cadence were continuously recorded. Expiratory ventilation (\(}_\)), \(}_}}_}\), pulmonary carbon dioxide output (\(}_}}_}\)), respiratory rate (\(_\)), tidal volume (\(_\)), alveolar carbon dioxide pressure (\(_}}_}\)), and respiratory exchange ratio were measured on a breath-by-breath basis by a metabolic unit consisting of a turbine flowmeter, a zirconium oxygen sensor, and an infrared CO2 meter (Quark b2, Cosmed, Rome, Italy). According to manufacturer’s instructions, the turbine and gas analyzers were calibrated before each test by means of a 3-l syringe (mod. 5530, Hans-Rudolph, Shawnee, KS, USA) and a certified gas mixture of known concentration (16% O2, 5% CO2, balance N2), respectively. \(}_}}_}\) and \(}_}}_}\) were computed using the Auchincloss algorithm (Auchincloss et al. 1966). Heart rate (\(_\)) was continuously acquired (S810, Polar Electro Oy, Kempele, Finland). Lastly, 20 μl arterialized blood samples were taken from the ear lobe and analyzed by an enzymatic-amperometric system (Labtrend, Bio Sensor Technology GmbH, Berlin, Germany) to determine [La−].
Data analysisAll the experimental data were analyzed offline. The respiratory and gas exchange responses were edited of spurious breaths that resulted from swallowing, coughing, sighing or premature ending of breath, by deleting values outside three standard deviation (SD) from the local mean (Lamarra et al. 1987).
From the incremental step-wise test, \(}_}}_}}\) was identified from the plateau in the relationship between \(}_}}_}\), selected by averaging the last 30 s of each workload, and mechanical power (\(\dot\)). Two subjects did not exhibit a \(}}}_}}_}\) plateau, therefore, the highest value of \(}_}}_}\) was considered as \(}_}}_}}\). The \(}_}}\) was determined as the mechanical load corresponding to the intersection between the \(}_}}_}\) plateau and the linear relationship between \(}_}}_}\) and \(\dot\). The lactate accumulation point was estimated by Dmax-modified method (Bishop et al. 1998) as being correlated with maximal lactate steady state (MLSS) indicator (Van Schuylenbergh et al. 2004).
To provide an accurate measure of CP, tests shorter than 2 min were not considered in the analysis (Mattioni Maturana et al. 2018). The hyperbolic power–duration relationship was transformed into a linear formulation (Hill 1993), where the y-intercept of the regression line of \(\dot\) vs. the inverse of exhaustion time was retained as CP.
The first 2 min of sinusoidal exercise were excluded from analysis to avoid any distortion in the physiological response induced by the transition of the workload intensity from CP (during the 3 min warm-up phase) to MP (sinusoidal phase). The cardiorespiratory and metabolic response was fitted by the sinewave function that minimized the least squared errors through a custom-built software (Matlab 2019b, MathWorks Inc., Natick, USA). AMP, MP, tDs of all measured variables were calculated for each sinusoid. The average values of these three parameters from all the completed cycles were also determined. Moreover, the net amount of oxygen taken up within a cycle, reflecting the amount of energy derived from aerobic sources only during a sinusoid (\(_},}}_}\)), was computed as the time integral of the \(}_}}_}\) variation during the cycle itself. This latter was obtained by subtracting the \(}_}}_}\) at the nadir of the cycle from the overall \(}_}}_}\) of each breath.
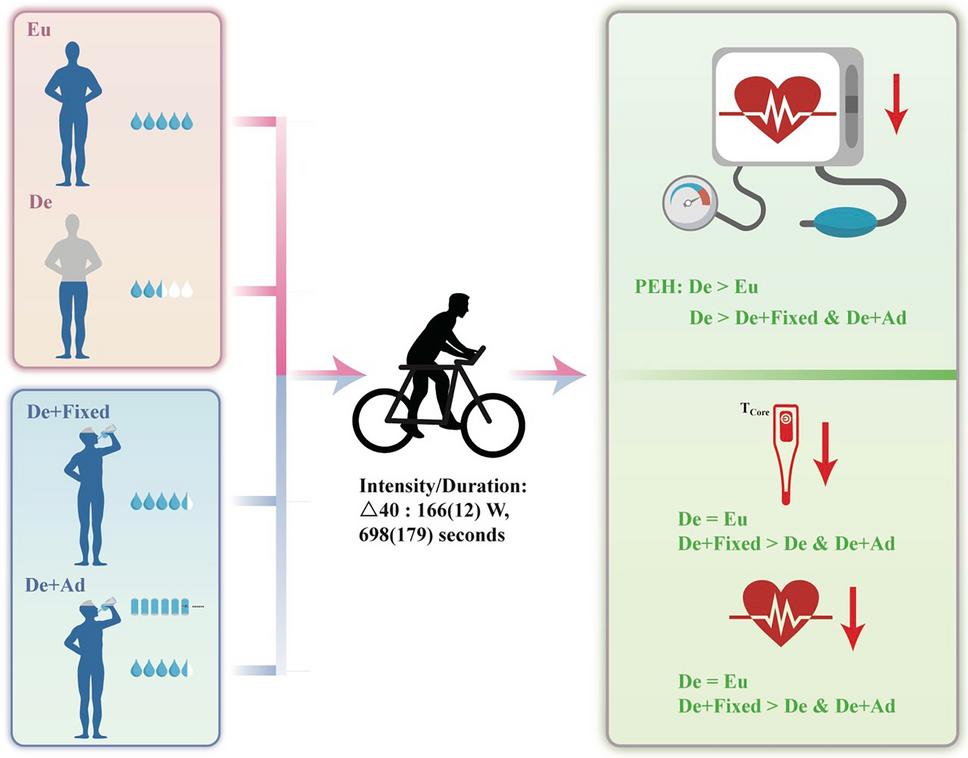
tD was determined as the time shift between the mechanical load and the physiological response. Two different tDs were determined according to the following hallmarks: i) tD up: upward MP crossing and ii) tD down: downward MP crossing (Fukuoka et al. 1997) (Fig. 2). All these parameters were determined on a cycle-by-cycle basis for all the cardiorespiratory and metabolic variables. In addition, the average value of the investigated variables was also computed over all cycles.
Fig. 2
Raw signals of a representative subject during two cycles of a sinusoidal protocol. Grey line: work rate; blue line: pulmonary oxygen uptake, \(}_}}_}\).tD up, delay at upward midpoint (MP) crossing; tD down, delay at downward MP crossing (color figure online)
Statistical analysisDescriptive statistics were used to characterize the study sample. The Shapiro–Wilk test was applied to check the normal distribution. A two-way analysis of variance for repeated measures (two-way ANOVA RM) assessed the presence of differences in AMP, MP, and tDs between the two work rates and among sinusoidal cycles. In the statistical analysis, the minimum number of cycles completed by all subjects, minus one, and the last completed cycle were included. For all pair-wise multiple comparisons, the Bonferroni’s correction test was applied. A paired Student’s t test determined the differences between average and all-cycle values and between the two sinusoidal protocols of cardiorespiratory and metabolic variables. Paired Student’s t test also established the differences between the number of cycles completed during the two sinusoidal exercises and the difference between tD up and tD down. The Hedge’s g effect size with CI95% was also calculated and interpreted as follows: 0.00–0.19: trivial; 0.20–0.59: small; 0.60–1.19: moderate; 1.20–1.99: large; ≥ 2.00: very large (Hopkins et al. 2009). All statistical analyses were performed using a statistical software (IBM SPSS Statistics v. 26, Armonk, NY, USA). The significance level was set at α < 0.05. Unless, otherwise stated, results are presented as mean ± standard error (SE).
Comments (0)