
Remember me
Recruitment was conducted by distributing flyers locally, word of mouth, and social media posts. Inclusion criteria were that participants had to be: (1) 18–55 years old, (2) running at least 15 miles/week, with at least one 90 min run every two weeks, (3) free of cardiovascular disease, diabetes, pulmonary disease (except controlled asthma), inflammatory bowel disease, swallowing problems, major dental problems, allergies to ingredients in the food bar, Celiac disease, and injuries that interfered with prolonged (i.e., 60–90 min) running.
This study complied with the Declaration of Helsinki. Runners participated voluntarily and signed an informed consent document approved by Old Dominion University’s Institutional Review Board (reference # 22–178) after being briefed on the study’s purpose, procedures, requirements, and potential risks. The study enrolled 20 participants (18 male and 2 females). Of these, 15 males completed all three visits and were included in the analyses. The characteristics of the participants included are shown in Table 1.
Table 1 Characteristics of the participants (n = 15)A formal sample size calculation was not carried out prior to beginning the study. The target sample size of at least 15 participants was based on a prior crossover experiment showing differences in glycemic responses with altering chewing duration (Ranawana et al. 2014).
Study designThis study used a 3-visit, randomised, unblinded, crossover design with 2 experimental conditions. In one condition, participants chewed a bar in 40 cycles (40CHEW), at a rate of 1 chew per second. The other condition involved chewing the bar in 20 cycles (20CHEW), at a rate of 1 chew per second. A vanilla chip chewy granola bar (Cascadian Farm Organic, Skagit Valley, WA, USA) was used due to its low fat and protein content. The bar supplied (per 35 g) 140 kcal, 3 g of fat, 26 g of carbohydrate, 2 g of protein, and 1 g of fiber. The bar was fed at specified intervals before and during running (detailed later).
Sex-specific randomisation lists, utilizing block sizes of two and four, were created (using https://www.sealedenvelope.com) by an individual not responsible for data collection. Participants were randomised to 40CHEW or 20CHEW first, then completed the alternative treatment during the next visit. Eight participants received 20CHEW first, while seven received 40CHEW first.
Testing protocolTesting occurred at the Human Performance Laboratory at Old Dominion University. The laboratory was temperature-controlled for all visits (20–24 ºC), and participants were instructed to avoid vigorous physical training for 24 h prior to each visit. Caffeine was prohibited for 12 h before arrival. Participants were asked to not ingest any caloric-containing foods or beverages in the 4 h prior to visit 1 (baseline testing), while they reported to the laboratory fasted for at least 8 h on the two experimental test days (visits 2 and 3).
At visit 1, participants completed a questionnaire on demographics, running history, and GI symptom history. Next, height was measured with a stadiometer, while a Bod Pod (COSMED USA, Concord, CA, USA) was used to measure body mass and composition. Participants then performed a VO2max test on a TrackMaster TMX425CP treadmill (Newton, KS, USA). A metabolic cart (TrueOne 2400, Parvo Medics, Salt Lake City, UT, USA) quantified volumes of oxygen consumption and carbon dioxide production (based on 30 s averages of data). The metabolic cart’s gas and flow sensors were calibrated with standard reference gas and a 3 L syringe. Participants wore a Hans Rudolph (Shawnee, KS, USA) facemask connected to a 2-way non-rebreathing valve, which was connected via a hose to the metabolic cart. A chest-strap monitor (Polar H10, Kempele, Finland) was used to monitor heart rate (HR). The treadmill protocol followed Wilson and Ingraham (2015). Briefly, testing began with a 3 min walk at a 5.0 km/h and 0% grade, followed by 1 min stages at 1% grade, with increasing velocity of 0.64 km/h for each stage until the participant reached their self-reported 5 km race speed. Thereafter, the grade increased by 1.5% each minute until volitional fatigue.
Determination of VO2max versus VO2peak was based on evaluating respiratory exchange ratio (RER) and HR relative to an aged-predicted maximum (208—0.7 × age) (Wagner et al. 2020). If a participant achieved an RER ≥ 1.05 and an observed HR of ≥ 90% of the age-predicted maximum, they were deemed to have achieved their VO2max. The mean ± SD percentage of age-predicted maximum HR was 98.8 ± 6.7% and the maximum RER was 1.09 ± 0.07. Even though all participants achieved ≥ 90% of their aged-predicted maximum HR, and all but two participants achieved a maximal RER ≥ 1.05, the term VO2peak is used in the remainder of the paper given that VO2max verification testing was not performed.
Next, participants rested for 15 min, which was followed by a 10 min familiarization run at 60% VO2peak. This run, and the subsequent experimental trials, were carried out on a T170 DE SPORT MED treadmill (Cosmed, Rome, Italy). An equation from Mayhew (1977) was used to find a treadmill speed equal to 60% of each participant’s VO2peak.
Speed (mph) = (relative VO2 at 60% of VO2peak / 5.34) + 0.82.
During the familiarization run, VO2 was analyzed from 5 to 10 min to confirm that the speed approximated 60% VO2peak. Minor speed adjustments were made if the participant’s measured VO2 was high or low (e.g., 1 mL/kg/min) relative to what was calculated. Ultimately, the measured VO2 during the final min of the familiarization was 34.0 ± 3.1 mL/kg/min, or 60.8 ± 3.1% of VO2peak.
Afterwards, participants were familiarized with a time-to-exhaustion (TTE) test of running at 90% VO2peak for 10 min, followed by running at 100% VO2peak until they decided to quit by grabbing the handrails of the treadmill and stepping off the belt. Speeds were derived using the equation from Mayhew (1977) described previously. Within 5 min of completing the familiarization TTE test, participants practiced ingesting two 9 g portions of the bar using 20 and 40 chew cycles, respectively. A 3 portion was offered for additional practice if the participant desired it.
Participants filled out a food log for the 2 days before visit 2 and were asked to, as best they could replicate the same intake before visit 3. Upon arriving for visit 2, participants put on an HR monitor and had baseline measurements taken. Capillary blood glucose was assessed using a FreeStyle Lite monitor (Abbott Diabetes Care Inc., Alameda, CA, USA). Participants rated nine GI symptoms (nausea, belching, regurgitation/reflux, stomach fullness, bloating, side stitching, abdominal cramps, gas, urge to defecate) using a 0–10 questionnaire (Wilson 2017). The Feeling Scale (FS) was used to assess affect (from -5 ‘very bad’ to + 5 ‘very good’) (Hardy and Rejeski 1989).
After baseline assessments, participants ingested 45 g (supplying ~ 33 g of carbohydrate) of a bar 30 min prior to the 60 min run. The bar was served in 5 9 g portions (6.7 g of carbohydrate per portion), and the chewing protocol was either 40CHEW or 20CHEW. The 9 g portion size was selected based on examining reference data on typical bite sizes (Ketel et al. 2019) and through investigator pilot testing. Each subsequent 9 g portion was served with minimal time (< 5 s) from when the prior portion was finished. A metronome (MR-500, Matrix, Korea), along with an investigator counting, was used to cue participants to chew once per second. Participants were offered water ad libitum after finishing each series of bar servings.
Thirty minutes after the first bar serving, participants started the 60 min run at 60% VO2peak. This intensity approximates that of many ultra-running races (Schena et al. 2014), the type of event during which solid food is most likely to be consumed. Participants ingested ~ 20 g of carbohydrate (27 g of bar) at 5, 25, and 45 min of the 60 min run, following the same chewing protocol. The bar was served in 9 g portions (6.7 g of carbohydrate) while the participant walked at 3.5 mph. Again, water was offered after feedings, and the amount was recorded with a scale (i500 balance, My Weigh, Phoenix, AZ). Participants drank the same amount of water during the next experimental trial. Median (25th-75th percentile) water intakes were 103 (68–192), 52 (44–87), 57 (42–79), and 61 (41–103) mL at the baseline, 5 min, 25 min, and 45 min feedings, respectively.
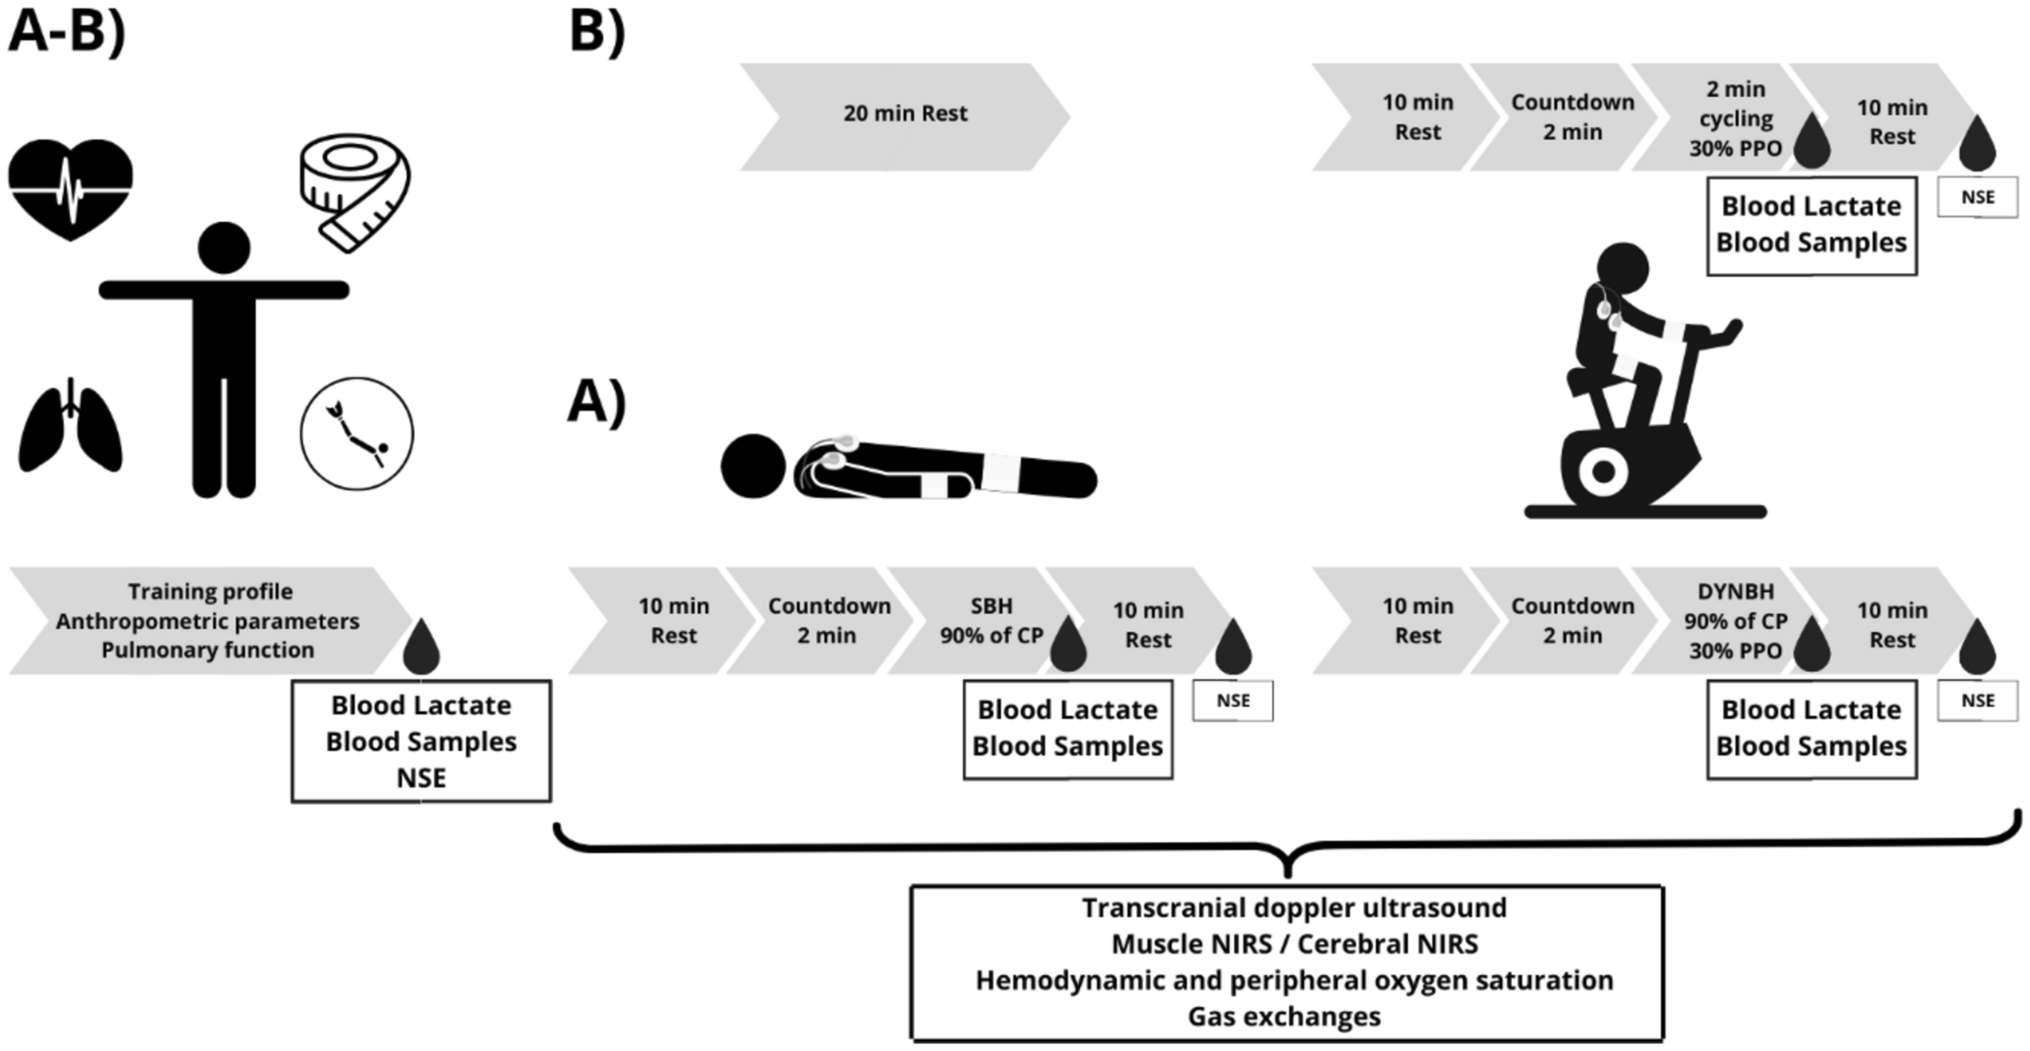
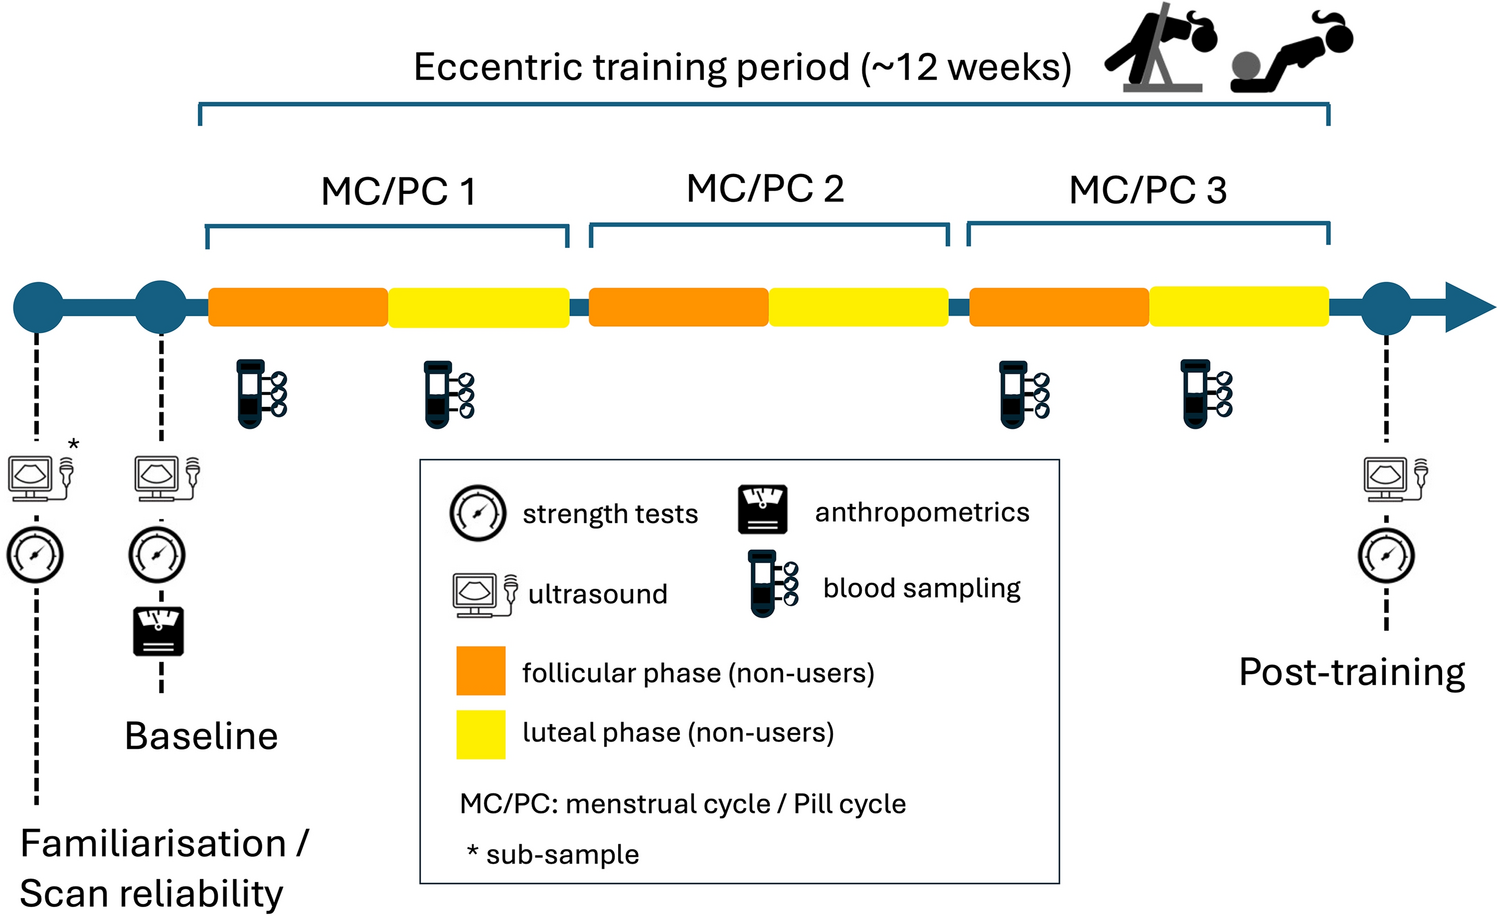
The same measurements taken at baseline, along with rating of perceived exertion (RPE; Borg, 1970), were assessed during the 60 min run at various timepoints (see Fig. 1).
Fig. 1
Overview of the study protocol and measurements
Respiratory gases were monitored for 2, 3 min periods, starting at 30 min and 57 min. Carbohydrate and fat oxidation rates were calculated using equations (Jeukendrup and Wallis 2005) based on the last minute of each collection.
Fat oxidation: (1.695 × VO2)–(1.701 × VCO2).
Carbohydrate oxidation: (4.21 × VCO2)–(2.962 × VO2).
After the 60 min run, the treadmill was stopped so that blood glucose could be collected and instructions for the TTE test could be reviewed with participants. The treadmill’s distance and time displays were covered so that participants were blinded to performance.
Visit 3 followed the same protocol as visit 2, except participants completed the opposite chewing protocol from visit 2. Note, time spent walking during the 60 min runs varied slightly between the two visits. Participants spent approximately one more minute walking during the 40CHEW condition than the 20CHEW condition.
Statistical analysisGiven that multiple GI symptoms were assessed across multiple timepoints, sum scores were calculated by adding together individual scores from each timepoint to create total and upper GI (nausea, belching, regurgitation/reflux, fullness) symptom variables.
Inspection of histograms and Shapiro–Wilk tests were used to evaluate if the data were normally distributed. The FS, RPE, blood glucose, HR, and substrate use were compared between trials using 2-way ANOVAs with condition (20CHEW vs. 40CHEW) and time (FS, GI: baseline, + 15, + 35, + 55 min; blood glucose: baseline, + 33, post-run; HR: baseline, + 9, + 19, + 29, + 39, + 49, + 59 min; carbohydrate and fat use: + 33, + 60 min) as within-subjects factors. Greenhouse–Geisser p-values are reported in cases where the assumption of sphericity was violated. In the case of time effects with no interaction effect, pairwise comparisons with a Bonferroni correction were applied. In the case of interaction effects, between-condition effects at each timepoint were explored using paired t-tests with Bonferroni adjustments for multiple comparisons. TTE performance was compared using a paired t-test. GI symptom variables were non-normally distributed; thus, the Wilcoxon signed-rank test was used. Change scores from baseline to + 55 min were calculated and used to reduce the number of statistical tests and risks of multiplicity.
SPSS Statistics 29 (IBM, Armonk, NY, USA) was used for the analyses. Unless otherwise indicated, normally distributed summary continuous data are reported as mean ± SD, and skewed data are reported as median (25th–75th percentile). Hedges’ g was calculated as an indicator of effect size, with the average of variances used in the denominator. Effects of 0.2, 0.5, and 0.8 were deemed small, moderate, and large, respectively. The alpha level was set at 0.05.
Comments (0)