
Remember me


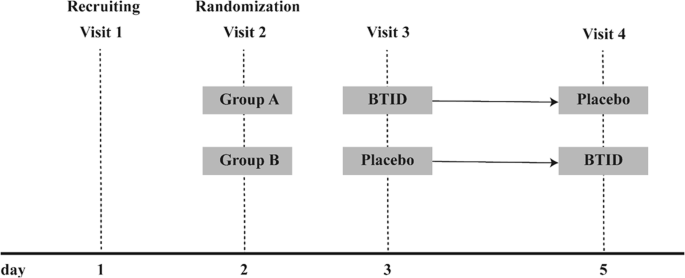
The total number of articles retrieved through the initial electronic search were 7491. After removing duplicates and screening abstracts, 74 articles remained to be read in full. Based on selection criteria, a total of 14 articles representing eleven different trials were included in this review (Fig. 1).
Fig. 1
PRISMA flow diagram of study selection.
Table 2 presents the characteristics of the included studies. We included eight RCTs [28,29,30,31,32,33,34,35,36,37], one non-RCT [38, 39], and two studies with a single-arm pre-post design [40, 41]. All included studies specified inclusion of individuals with BMI ≥ 25 kg/m2. Definition for T2D varied based on criteria such as elevated glycemic control (using different HbA1c thresholds) or a clinical diagnosis. Inclusion criteria regarding T2D medication varied, with some studies excluding individuals using insulin or other T2D medication, while others did not specify T2D medication requirements. The total number of participants following a KD was 689, with the mean age ranging from 38.3 ± 26 [40] to 64.8 ± 7.7 [33] years. Only studies conducted in the US provided race/ethnicity data, and the majority of these studies predominantly consisted of Caucasian or White participants. The mean body mass index (BMI) of participants ranged from 32.2 ± 6.3 [37] to 40.4 ± 8.8 [39] kg/m2, and the mean baseline A1c ranged from 6.3 ± 1.1 [29] to 8.9 ± 0.4% [40]. As shown in Table 3, the duration of included studies ranged from 90 days [40] to 2 years [36, 38], with the retention rate of KD group ranging from 43.8% [28] to 100% [40]. All studies recommended a self-prepared KD with no restrictions on food choices and included physical activity as part of the intervention, along with additional components such as nutrition counseling [30, 32,33,34, 37,38,39,40], monitoring [30, 38,39,40], feedback [30, 41], and group education [28, 31, 35, 36]. Of the nine studies that had a control group, five compared the KD intervention to the typical diabetes lifestyle education recommended by T2D management guidelines [30, 31, 33, 34, 39]. Three studies compared the KD to other dietary patterns that had different energy and macronutrient goals [28, 29, 35, 36], and one study compared the combination of KD education and mindfulness training to the KD education only [37].
Table 2 Participant characteristics across included studies.Table 3 Intervention characteristics across included studies.Table 4 presents changes in weight loss and diabetes-related outcomes across included studies. All studies found significant weight loss (3.4 [31] to 12.7 kg [34]) within KD groups. Six of them showed that the KD groups lost significantly more weight than the control groups [28, 30, 32, 34, 38, 39], while two studies found no differences in weight loss between KD and control groups after 1 year to 2 years [31, 36]. Out of eight studies that measured levels of A1c, seven reported a significant decrease in A1C levels (0.3 [29] to 3.3% [40]) in KD groups [28, 29, 33, 36, 38, 40, 41], with five demonstrating greater A1c reduction in the KD groups [28, 30, 32, 34, 38] and three reporting no difference [29, 31, 36]. All but two studies measured diabetes-related health outcomes including fasting blood glucose, fasting insulin, insulin resistance, and/or others. Among these studies, five reported significant improvements in at least one diabetes-related health outcome within the KD group [29, 30, 35, 36, 38, 39, 41]. Changes in diabetes medication across included studies were also presented in Table 4.
Table 4 Changes in weight loss and diabetes-related outcomes across included studies.Diet and physical activity measuresAs shown in Table 3, dietary adherence measures used in the studies included self-reports (n = 9) [28,29,30,31,32,33,34,35,36,37, 41] and biomarkers such as ketone levels (n = 10) [28,29,30,31,32,33,34,35,36,37,38,39,40,41] and 24-hour urinary-urea/creatinine ratio (n = 1) [36]. Formats of self-reported dietary adherence included take-home food records (n = 5) [28,29,30,31, 41], electronic food logs (n = 2) [33, 36], 24-hour dietary recall (n = 2) [32, 33, 37], and self-rated diet adherence on a Likert Scale (n = 1) [31]. Studies measured ketone levels for the purpose of indicating diet adherence at follow-ups (n = 9) and encouraging participants to better adhere to KD as a behavior change strategy (n = 5). However, studies varied on measurement target and timef
Comments (0)