
Remember me


In our previous study [3], we demonstrated that adult mice subjected to a 5-month T2DM paradigm (as described above in the Methods) exhibited deficits in spatial memory. In support of the previous finding, in Supplementary Fig. 1 we show that this paradigm leads to deficits in the nest-building test (Supplementary Fig. 1A), which measures general health and stress levels [10] and in the exploratory behavior in the open and closed arms in the elevated plus maze (Supplementary Fig. 1B). Although we did not observe significant differences in the elevated plus maze test, it is noteworthy that 5 out of the 8 mice tested spent more time in the open arm than in the closed arm, which is generally considered indicative of a low anxiety state [11].This would not be surprising when considering that reduced anxiety may precede depression, and that some individuals with chronic T2DM develop depression [1, 2]. Additionally, we confirm that the cognitive changes accompanying T2DM have a biochemical correlate in the brain, evidenced by elevated levels of mTORC1 phosphorylated at Serine 2448 (Supplementary Fig. 1C). While phosphorylation of mTOR at Serine 2448 plays a central role in regulating cell growth, protein synthesis, and metabolism in response to insulin and other growth factors, it also triggers the phosphorylation of serine residues on insulin receptor substrate (IRS) proteins, ultimately resulting in a reduction in insulin signaling (insulin resistance) [12,13,14]. These findings, in conjunction with those from our most recent publication, lead us to the conclusion that, even in a genetically typical background (C57BL/6), chronic measures leading to peripheral insulin resistance give rise to both biochemical and functional impairments within the mouse brain.
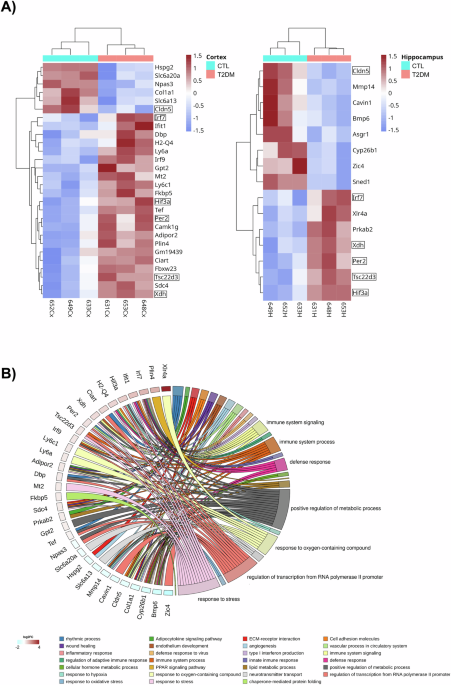
To gain mechanistic insights on how T2DM might be leading to brain function changes, we carried out a transcriptomic analysis of cortical and hippocampal samples from the control and the T2DM mice used for the behavioral and biochemical studies. Total RNA from the cortex and hippocampus of 3 control and 3 T2DM mice was extracted and after poly(A)+ selection RNA sequencing was carried out using the Illumina methodology as described previously [3]. Typically, three biological replicates per group are considered sufficient to yield reliable results and facilitate effective statistical analyses. Figure 1A shows that T2DM resulted in significant changes in the expression of 28 genes in the cerebral cortex (6 downregulated and 22 upregulated) and 15 in the hippocampus (7 upregulated and 8 downregulated). 6 of these genes were common for both structures: Hif-3α, IrfF7, Per2, Xdh, Tsc22d3 are upregulated, and Cldn5 is downregulated (marked in Fig. 1A, see also Supplementary Tables 1 and 2). An overrepresentation analysis (ORA) using the ClusterProfiler R package (see Materials and Methods) was conducted to determine whether known biological functions or processes are over-represented in these differentially expressed genes (DEGs). The gene ontology (GO) plot in Fig. 1B offers insights into the pathways that could be most influenced by the up and downregulation of these genes: inflammation and immunity (e.g., Irf7, Irf9, Ifit1, GM19439, Ly6C), cellular rhythmicity (e.g., Ciart, Per2, Dbp, Tef), metabolism (AMPK, Tsc22d3, AdipoR2, Mt2, Fkbp5, AsgR1, Cyp26b), maintenance of the blood-brain barrier/vascular integrity (e.g., Cldn5, Cav1, MMP14, Sdc4), oxidative metabolism/response to hypoxia (e.g., Gpt2, Xdh, Hif-3α, Tsc22d3, Mt2), regulation of gene expression (Xlr4a), cell-cell interaction/morphogenesis (Xlr4a, Hspg2, Sdc4, Zic4, Bmp6, Sned1, Col1a), and neurotransmission/synaptic plasticity (e.g., Xlr4a, CamK1, Slc6a13). The functional association of these DEGs is also shown in a dot plot visualization representing the log10(pvalue) for each enriched pathway (Supplementary Fig. 2).
Fig. 1: Gene Expression Changes in the Cerebral Cortex and Hippocampus of Mice with Chronic Type 2 Diabetes Prior to Cognitive Deficits.
A Gene Expression Differences in the Cerebral Cortex and Hippocampus of Control and Chronic Type 2 Diabetes Mellitus (T2DM) Mice. Hierarchical cluster analysis with q-value < 0.05 of Differential Gene Expression (DEGs) of the Cortex (left panel) and Hippocampus (right panel) of Type 2 Diabetes Mellitus (T2DM) and control (CTL) WT mice. Each row represents a single gene and each column represents a condition sample. Each subcolumn represents an individual sample (3 mice per condition). Gene intensities are log2 transformed and displayed as colors ranging from blue to garnet representing the changing process from downregulation to upregulation as shown in the key. Common differentially expressed genes are marked in boxes. B Predicted Functional Connections Between Misregulated Genes in the Cortex and Hippocampus of Chronic Type 2 Diabetes Mellitus (T2DM) Mice. GOChord plot showcases the connection between chosen pathways and the genes linked to Type 2 Diabetes Mellitus (T2DM). Genes are depicted in a spectrum of blue-to-garnet colors, representing their log2-Fold-Change values. This visualization offers insight into the relationships between pathways and genes, enhancing our understanding of their potential roles in T2DM.
We then proceeded to validate the changes of the 6 common genes in cortex and hippocampus at the mRNA and protein level. RT-qPCR of cortex and hippocampal RNA from 5 T2DM and control mice confirmed these gene expression changes for all except for Per2, which was significant in RNA from the cerebral cortex but not from hippocampus (Fig. 2A). Furthermore, given that there is not always a correlation between mRNA and protein levels (i.e., translation efficiency, protein degradation, protein stability, feedback loops and compensatory mechanisms), we next analyzed the protein levels of 4 of the transcripts for which we had appropiate antibodies: CLDN5, IRF7, PER2, and HIF-3α. Figure 2B shows that T2DM induces protein-level changes in both CLDN5 and IRF7 in the hippocampus, mirroring the alterations observed at the mRNA level. Furthermore, Fig. 2C shows that T2DM significantly decreases CLDN5 at the protein level in the cerebral cortex -also consistent with the transcriptomic findings-, while IRF7 is higher than in non-T2DM but it does not reach statistical significance. In any event, and consistent with the increase in IRF7, we observed a significant reduction of IκBα in the hippocampus and, though not significant, a clear decrease compared to controls was also noted in the cerebral cortex of T2DM (Fig. 2D). IκBα senses an inflammatory environment by undergoing phosphorylation followed by degradation, releasing NF-κB from its cytoplasmic location to translocate into the nucleus to initiate the transcription of genes involved in various processes of the immune and inflammatory response [15]. Therefore, the activation of NF-κB in the brain appears to be another inflammatory consequence in our T2DM mice. Western blot analysis of HIF-3α and PER2 did not reveal significant differences between control and T2DM mice in either brain structure (see Supplementary Fig. 3).
Fig. 2: Validation of Transcriptional Changes in the Cerebral Cortex and Hippocampus of Mice with Chronic Type 2 Diabetes.
A RT-qPCR analysis of RNA levels of Hif-3α, Irf7, Per2, Xdh, Tsc22d3 and Cldn5 in the hippocampus and cortex of mice with T2DM. Upper row: Hippocampal RNA levels of CTL (n = 5) and T2DM (n = 5), one-tailed unpaired t-test: Hif-3α, *P = 0,0399; Irf7, **P = 0,0012; Per2, not significant; Xdh, *P = 0,0471; Tsc22d3; *P = 0,0484; Cldn5, *P = 0,0480. Lower row: Cortex RNA levels of CTL (n = 5) and T2DM (n = 5), one-tailed unpaired t-test: Hif-3α, *P = 0,0216; Irf7, **P = 0,0018; Per2, *P = 0,0108; Xdh, *P = 0,0170; Tsc22d3, *P = 0,0183; Cldn5, *P = 0,0208. B Immunoblotting of hippocampal extracts from T2DM and control mice with antibodies against CLDN5 (left, CTL n = 13, T2DM n = 15, unpaired t test, ****P < 0.0001, data normalized to the CTL group) and IRF7 (right, CTL n = 7, T2DM n = 11, unpaired t test, *P = 0.0385, data normalized to the CTL group). Note that all samples from T2DM mice exhibited reduced CLDN5 levels whereas not all -same- samples had high levels of IRF7. C Immunoblotting of cortex extracts from T2DM and control mice with antibodies against CLDN5 (left, CTL n = 11, T2DM n = 17 unpaired t test, *P = 0.032, data normalized to the CTL group) and IRF7 (right, CTL n = 13 T2DM n = 17, unpaired t test, not significant, data normalized to the CTL group). Note that all samples from T2DM mice exhibited reduced CLDN5 levels whereas not all -same- samples had high levels of IRF7. D Immunoblotting of hippocampal and cortical extracts from T2DM and control mice with an antibody against IkBα (hippocampus left panelf, CTL n = 10, T2DM n = 10, unpaired t test, *P = 0.0111, data normalized to the CTL group) and (cortex right panel, CTL n = 13, T2DM n = 16, unpaired t test, not significant (P = 0.069), data normalized to the CTL group). Note that like for IRF7 the changes in the cortex of mice with T2DM are clear compared to the control mice but without reaching significance.
Comments (0)