


Remember me
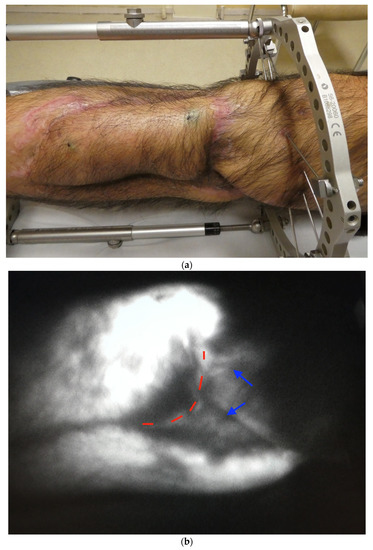

Figure 1. Illustrative example for the Formetric report.
Figure 2. Participant flow chart.
Table 1. Baseline participant demographics.
Table 1. Baseline participant demographics.
VariableFibromyalgia Group (n = 67)Control Group (n = 67)Age (years)46.4 ± 946.5 ± 9.1Weight (kg)75 ± 980 ± 10Gender (%)Male1212Female5555Body mass index mean (SD), Kg/m2 GraduationPrimary school5 (7.5%)2 (3%)Secondary school10 (14.9%)8 (11.9%)Advanced technical colleague certificate10 (14.9%)15 (22.4%)University diploma32 (47.8%)30 (44.8%)Others10 (14.9%)12 (17.9%)Marital status (%)Single5 (7.5%)4 (6%)Married55 (82.1%)57 (85%)Separated, divorced, or widowed7 (10.4%)6 (9%)Pain duration1–5 y20 (29.9%)Asymptomatic>5 y47 (70.1%)AsymptomaticTable 2. Means, standard deviation (SD), 95% confidence interval (CI) and statistical significance of the postural measurements between participants with FMS and controls.
Table 2. Means, standard deviation (SD), 95% confidence interval (CI) and statistical significance of the postural measurements between participants with FMS and controls.
3D Formetric Measurement Mean±SDSEMCohen’s d95% CIp-ValueKyphotic angle ICT-ITL (max) (deg.)FMS74.14.750.586.8[14.3–19.04]<0.001Control57.48.411.02Lordotic angle ITL-ILS (max) (deg.)FMS45.15.710.694.3[1.9–4.9]<0.001Control41.52.460.30Sagittal imbalance (mm)FMS9.532.770.332.3[4.1–5.7]<0.001Control4.51.890.23Coronal imbalance (mm)FMS8.043.190.392.4[3.6–5.6]<0.001Control3.221.370.16vertebral rotation (rms) (deg.)FMS9.51.860.221.8[3.5–4.7]<0.001Control5.31.750.21Table 3. Variables in the equation for logistic regression and odds ratio calculation.
Table 3. Variables in the equation for logistic regression and odds ratio calculation.
Variables in the Equation BS.E.WalddfSig.Exp(B)95% CI for EXP(B)LowerUpperSagittal imbalance (mm)0.4370.2363.40910.0051.5470.9732.459vertebral rotation (rms) (degrees)2.0690.8515.91410.0157.9191.49441.970Kyphotic ICT−ITL (max) (degrees)0.5690.2754.27310.0391.7661.0303.029Coronal imbalance (mm)−0.1880.3130.36010.5490.8290.4491.530Lordotic angle (degrees)0.4720.3262.10510.1471.6040.8473.035Constant−52.30921.7825.76710.0160.000Table 4. Multiple linear regression for the fibromyalgia impact questionnaire score versus postural variables and their associated risk factors.
Table 4. Multiple linear regression for the fibromyalgia impact questionnaire score versus postural variables and their associated risk factors.
ModelUnstandardized CoefficientsStandardized CoefficientstSig.95.0% Confidence Interval for BBStd. ErrorBetaLower BoundUpper Bound1Constant−2.0430.214 −9.562<0.001−2.466−1.620Kyphotic ICT−ITL (max) (deg.)0.0210.0030.4598.462<0.0010.0160.026sagittal imbalance (mm)0.0240.0090.1662.7390.0050.0070.042vertebral rotation (deg.)0.0780.0110.4307.197<0.0010.0570.099Lordotic angle (deg.)0.0100.0040.0922.2060.0290.0010.019Coronal imbalance (mm)−0.0070.010−0.046−0.6880.493−0.0260.013
Comments (0)