
Remember me
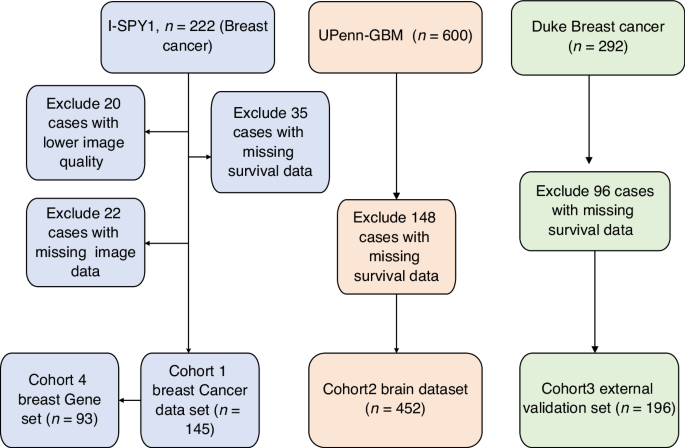


Between March 2018 and July 2021, a total of 151 patients were enrolled at 35 German sites. Of these, 146 (96.7%) received at least one dose of study medication and were included in the analysis. Overall, 143 2nd-line treatment failure events were observed. Three patients were censored due to loss to follow-up or study termination (CONSORT diagram: supplementary Fig. 1). Median treatment duration of 2nd-line treatment was 3.71 months (95% CI 2.50–4.11 months), with 28.3% of the patients still on treatment after six months. Median OS of 2nd-line therapy was 7.72 months (95% CI 6.11–9.00 months), with 60.5% (95% CI 51.8–68.2%) of the patients alive at six months. Median TTF1 at study inclusion had been 6.5 months. For the analysis, patients were stratified into the TTF1 high (n = 50, 1st-line treatment duration ≥7 months), TTF1 middle (n = 50, 4–7 months) and TTF1 low (n = 49, ≤4 months) cohorts, which were comparable in terms of the other baseline characteristics (Table 1).
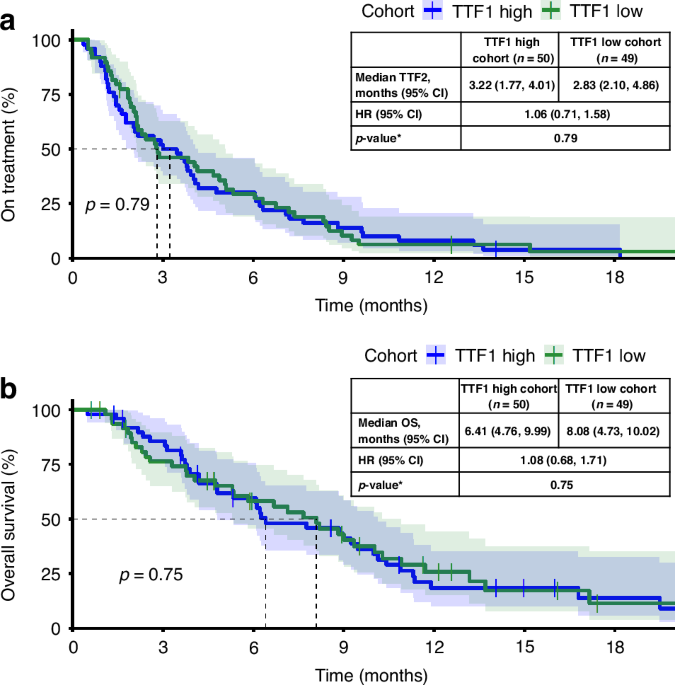
Table 1 Patient baseline characteristics.Impact of TTF1 on time to treatment failure of 2nd-line therapyAnalysis of TTF2 revealed no statistically significant differences between the TTF1 high and TTF1 low cohort by log-rank test (p = 0.790). The median TTF2 was 3.22 months (95% CI 1.77–4.01) in the TTF1 high and 2.83 months (95% CI 2.10–4.86) in the TTF1 low cohorts, respectively (Fig. 1a, supplementary Table 1). The probability (95% CI) for patients to continue treatment after six months was 30.0% (95% CI 18.1–42.9) and 29.3% (95% CI 17.3–42.5), respectively. The main reasons to discontinue 2nd-line treatment were progressive disease (51.1% vs. 57.4% in the TTF1 high vs. TTF1 low cohort, respectively), followed by death (8.9% vs. 6.4%), ‘unrelated medical condition or complication’ (6.7% vs. 8.5%) and ‘investigator’s decision’ (11.1% vs. 4.3%).
Fig. 1: Kaplan–Meier analyses.
a TTF2 (primary endpoint) and b OS for TTF1 high vs TTF1 low cohorts.
Overall survivalAt study closure, we observed 114 events, and 32 patients were censored because they were still alive (10 in the TTF1 high and 15 in the TTF1 low cohorts. The median OS for the entire population was 7.75 months (95% CI 6.11–9.17). In the two TTF1 cohorts, median OS was 6.41 months (95% CI 4.76–9.99 months) for TTF1 high and 8.08 months (95% CI 4.73–10.02 months) for TTF1 low (Fig. 1b, supplementary Table 2). The survival probability for patients after six months was 59.7% (95% CI 44.2–72.1) in TTF1 high and 58.2% (95% CI 42.5–71.0) in TTF1 low. While median OS was numerically shorter (about 1.5 months) in TTF1 high as compared to TTF1, this difference was statistically not significant (log-rank test; p = 0.746) and the survival probability after six months was similar.
Growth modulation indexThe ‘growth modulation index’ (GMI), calculated as the ratio of TTP2/TTP1, was analysed for 77 patients with a documented tumour progression on both the 1st-line and 2nd line treatment. Patients who died without documented progression were not considered. Mean (±SD) GMI was 1.02 ± 1.14 overall (n = 77), 0.44 ± 0.31 for the TTF1 high cohort (n = 23) and 1.75 ± 1.60 for TTF1 low cohort (n = 25). A Mann–Whitney U test showed a statistically significant difference between the two cohorts (p < 0.001).
Correlations of baseline parameters with TTF2 and OSFurther analysis examined the association of various baseline parameters with TTF2 and OS using log-rank tests (Fig. 2, supplementary Table 3). Several parameters were found to be significantly correlated with treatment outcome: elevated CA 19-9 levels (<100 vs. ≥100μ/ml: TTF2 5.95 vs. 2.86 months, p = 0.005; OS 9.26 vs. 7.13 months, p = 0.037), ECOG PS (0 vs ≥1: TTF2 4.76 vs. 2.43 months, p = 0.029; OS 10.28 vs. 6.08 months, p < 0.001), leucocyte counts (normal vs. outside normal: TTF2 4.07 vs. 2.14 months, p < 0.001; OS 8.84 vs. 4.40 months, p < 0.001), neutrophil counts (normal vs. outside normal: TTF2 3.45 vs. 4.01 vs. 2.07 months, p < 0.001; OS 8.61 vs. 8.18 vs. 3.61 months, p < 0.001), presence of liver metastases at progression from 1st-line treatment (yes vs. no: TTF2 2.79 vs. 4.40 months, p = 0.047; OS 6.67 vs. 10.12 months, p = 0.042), and CRP levels (≤10 vs. >10 mg/l: TTF2 5.22 vs. 2.63 months, p = 0.003; OS 9.33 vs. 4.40 months, p < 0.001). Albumin levels were significantly associated with OS (normal vs. outside normal: OS 8.97 vs 6.08 months, p = 0.030) with a trend for TTF2 (normal vs. outside normal: TTF2 4.07 vs. 2.43 months, p = 0.182). In contrast, BMI (<22 vs. ≥22 kg/m2: TTF2 3.22 vs. 3.81 months, p = 0.414; OS 6.24 vs. 8.61 months, p = 0.381), sex (female vs. male: TTF2 3.84 vs. 2.99 months, p = 0.595; OS 7.98 vs. 7.56 months, p = 0.400), age (18–64 vs. 65–74 vs. ≥75 years: TTF2 2.84 vs. 4.86 vs. 2.30 months, p = 0.100; OS 8.18 vs. 6.67 vs. 8.08 months, p = 0.916), and LDH (normal vs. outside normal: TTF2 3.93 vs. 2.86 months, p = 0.207; OS 8.61 vs. 6.67 months, p = 0.059) showed no significant correlation with either TTF2 or OS.
Fig. 2
Forest plot of median TTF2 and OS for different subgroups.
Additional multivariate modelling included the parameters significantly associated with TTF2 and OS (Table 2) in the univariate analysis. CRP levels and neutrophil or leucocyte count where associated with both TTF2 and OS with p-values of 0.02 or less. ECOG PS remained significantly associated with OS but not with TTF2, whereas elevated CA 19-9 levels at baseline lost their discriminatory power for TTF2 as well as for OS.
Table 2 Uni- and multivariate modelling of TTF2 and OS.Correlation of CA 19-9 response with TTF and OSLongitudinal CA 19-9 measurements were performed routinely. Out of 146 patients, 114 (78.1%) had elevated CA 19-9 baseline values. Among these, 52 (46.0%) patients experienced a moderate CA 19-9 response of ≥25% and 32 (28.1%) patients experienced a pronounced response of ≥50% at any time point during 2nd-line treatment (Table 3). A decrease of ≥25% or ≥50% in CA 19-9 levels at any time was significantly associated with longer TTF2 and increased OS (log-rank p < 0.001). However, given that patients with longer treatment duration have a higher chance of achieving a CA 19-9 response, additional analyses were performed at specific time points for subsequent TTF2 (supplementary Table 4) and OS (Table 4). Of those with elevated CA 19-9 baseline values still alive at the respective time-point, ten (9.1%) patients achieved a ≥25% decrease of CA 19-9 after one month, 35 (35.7%) after two months, and 47 (52.2%) after three months. Three patients (2.7%) achieved a ≥50% decrease of CA 19-9 after one month, 15 (15.3%) after two months, and 27 (30.0%) after three months. Starting with a survival time of at least three months, a CA 19-9 response of ≥25% was highly significantly associated with increased OS (7.91 [CI 95% 5.84–10.70] vs. 3.11 [CI 95% 2.29–5.18] p < 0.001), with similar results after four and five months. A CA 19-9 response of ≥50% was significantly associated with both longer TTF2 (4.06 [CI 95% 1.76–6.63] vs. 2.09 [CI 95% 1.37–2.45] p = 0.001) and increased OS (8.30 [CI 95% 6.23–13.79] vs. 4.72 [CI 95% 3.11–5.84] p < 0.001). These associations remain significant after four and five months.
Table 3 TTF2 and OS for CA 19-9 response at any point in time during 2nd-line treatment.Table 4 Subsequent OS after CA 19-9 response (≥25%, ≥50%) within defined time-points after signature of ICF.
Comments (0)