
Remember me


The review includes all original randomized controlled trials (RCTs) conducted in any country within the past five years, written in English, and involving intramuscular administration of SARS-CoV-2 vaccines.
Exclusion criteriaAll studies that underwent any type of review, literature scans, conference papers, studies that are not RCTs, books, and book chapters are excluded.
Framework of the studyThe Population, Intervention, Comparator, and Outcome (PICO) framework tool was used to formulate RCT research questions and guide systematic reviews. The PICO criteria were used to select the studies to be included in the review, which involved screening studies based on predefined eligibility criteria related to PICO. The PICO for each synthesis was determined at the protocol stage regarding the specific question each synthesis aims to answer, how the synthesis will be structured and the specification of planned comparisons. The PICO criteria for each synthesis and definition are the following:
Population (P)All individuals who were polymerase chain reaction (PCR) confirmed SARS-CoV-2 negative and free from chronic or unknown diseases.
Intervention (I)Novel SARS-CoV-2 vaccines.
Comparator (C)All individuals who were PCR-confirmed SARS-CoV-2 negative, free from chronic or unknown diseases, and received a placebo.
OutcomeEfficacy of novel SARS-CoV-2 vaccines.
The planned analysis methods were forest plot (subgroup analysis and cumulative meta-regression), heterogeneity test, meta-regression (sensitivity test), and publication bias. Either fixed-effect or random-effect models were the proposed statistical models for result synthesis.
Information sourceScopus, PubMed, Medline, Web of Science, Cochrane Library, and the search engine Google Scholar were information sources. The last date to search for all literature is May 1, 2024.
Search strategyA comprehensive search strategy was implemented to identify relevant studies from electronic databases and Google Scholar. A combination of controlled vocabulary (e.g., MeSH terms) and free-text terms related to the population, intervention, comparator, and outcomes were employed. The full search strategy for all of the databases was: (((((((“SARS-CoV-2 vaccine efficacy” [Title]) OR (efficacy [Title])) AND (SARS-CoV-2[Title]))) OR (“Sever Acute Respiratory Syndrome-2” [Title])))) OR (COVID-19))))) OR (Coronavirus [Title])))))) AND (Vaccine [Title]))))))). Filters were applied to abstracts, RCTs, and published articles, and in the last five years, limits were applied to vaccines, human vaccines, immunotherapeutics, and the English language.
Selection processThe initial screening of search results involved evaluating titles and abstracts to find relevant studies. Eligible studies for full-text assessment were identified using predefined inclusion and exclusion criteria. The screened studies were organized and managed using an Excel spreadsheet, and pertinent data was extracted from the included research. Quality assurance tests were used to ensure consistency and correctness in the screening and selection process. The methods used to decide whether a study met the inclusion criteria of the review were merging search results from different sources using reference management software, removing duplicate records of the same report, examining titles and abstracts to remove irrelevant reports, retrieving the full text of potentially relevant reports, linking together multiple reports of the same study.
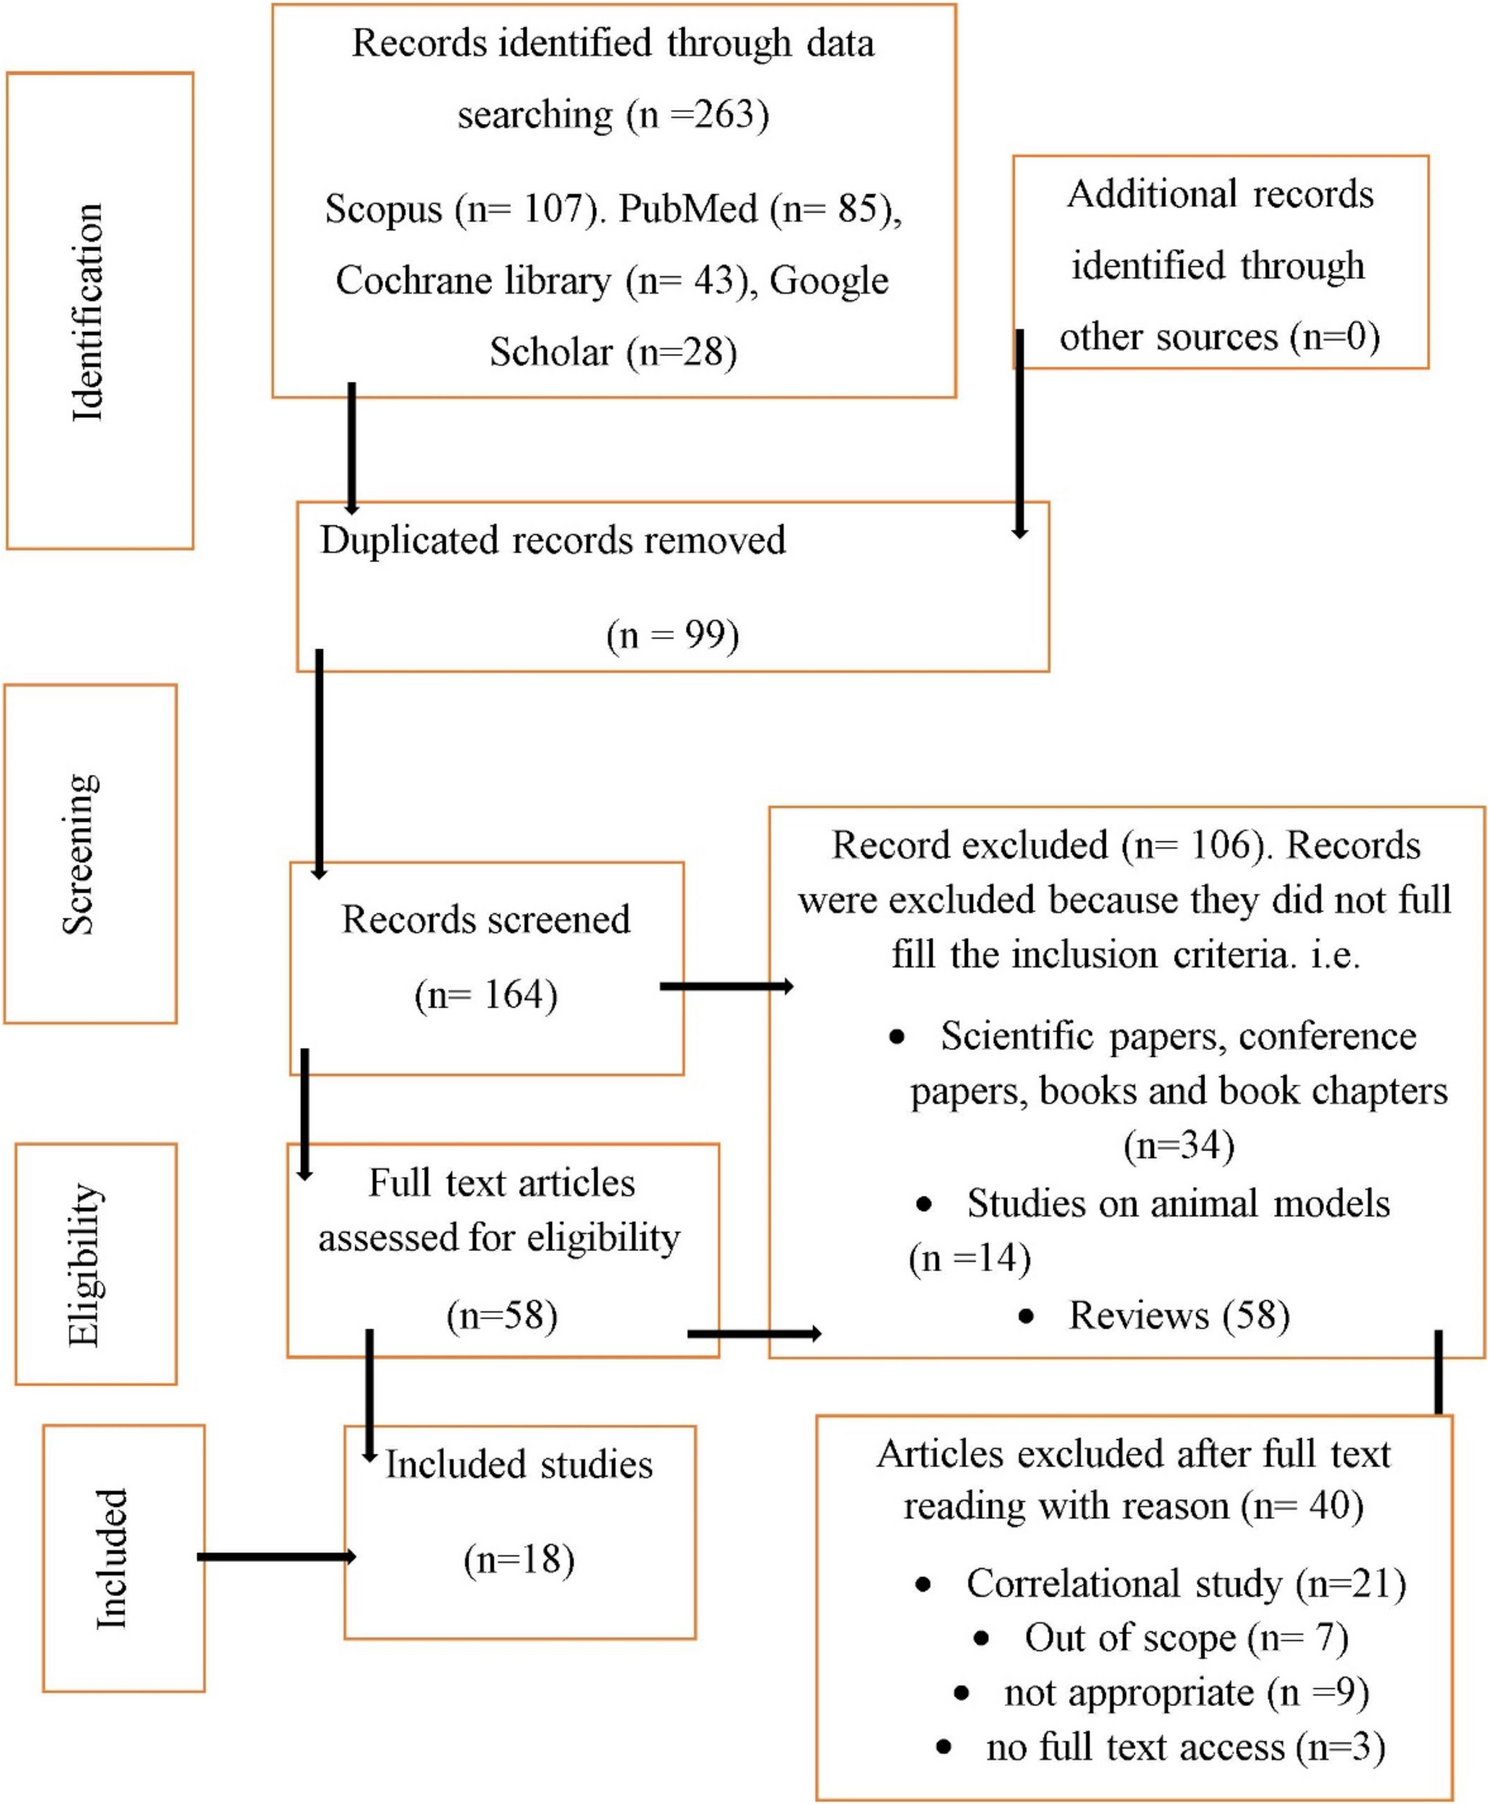
Four independent reviewers screened and retrieved all titles and abstracts to remove extraneous reports. Each reviewer used the predefined inclusion and exclusion criteria to determine whether the study should be further evaluated. Full-text assessments were conducted on studies that were identified as possibly eligible during the title and abstract screening processes. To determine final eligibility, the reviewers independently reviewed the full-text reports against the inclusion and exclusion criteria. Disagreements over eligibility for inclusion were settled through discussion. When there was a debate about interpretation, one reviewer arbitrated. There was no disagreement on the arbitration judgment. There was no implementation of automated searching and screening. EndNote 20.1, an automated reference management application, was used for organizing. The PRISMA 2020 guideline (https://www.prisma-statement.org/prisma-2020-flow-diagram) was strictly followed starting from evidence identification to inclusion (Fig. 1).
Fig. 1 Data collection process
A standardized Excel spreadsheet was used to record all essential information from each included study. The data items extracted were study characteristics (author, study location, publication year, study design, total sample size, sample size for each group per study, total infected and non-infected participants per study in each group), participant demographics (sex, age, location, the total number of participants and per sex), intervention details (total number of the treatment group and placebo group, treatment to placebo ratio, dose and dosage interval, mean/median follow-up period), outcome measures (vaccine efficacy, confidence intervals (CIs)), effect sizes (pooled odds ratio, mean, and median follow-up), and measures of variability (standard deviation, standardized mean difference, standard error, pooled standard deviation and error). The accuracy of the extracted data was verified by cross-checking against the sources, like study publications and supplementary materials. Quality checks were performed to ensure the avoidance of data entry errors or discrepancies. The extracted data were organized in a structured Excel spreadsheet to facilitate analysis. The data were labeled appropriately and consistently to avoid confusion during subsequent synthesis. Four reviewers performed data collection and extracted data from each report independently. There was no discrepancy during data collection and extraction. Reviewers worked independently during the data collection process to minimize bias and errors. Each reviewer extracted data from the reports based on predefined criteria without consulting other reviewers initially. Reviewers run to confirm an incomplete or unclear report by referring to supplementary materials, study protocols, or trial registries for additional information and consulting secondary sources or previous related publications for supplementary data. No data screening and extraction software platforms were used.
Data itemsSpecific data items were extracted from each included study to facilitate qualitative and quantitative synthesis and statistical analysis. The comprehensive list of data items extracted for this work includes study identification (author(s) name(s), publication year, study country, study title, journal or source, DOI or PMID), study design and methodology (study design, sample size, randomization method, blinding, allocation concealment, follow-up duration), participant characteristics (age, gender, residence) intervention details (intervention description, dosage, duration, mode of administration), comparator details (comparator description, dosage), duration), outcome measures, time points of outcome assessment, outcome measurement tools/methods), effect sizes (mean/median, odds ratio (OR)), measures of variability (standard deviation (SD), standard error (SE), confidence intervals (CI), P-values mean difference, standardized mean difference (SMD)), study results (overall vaccine efficacy), treatment effects and estimates), funding source and conflicts of interest, risk of bias assessments and, additional information (study location) and any other relevant study-specific details. The data were sought for the primary outcome of novel SARS-CoV-2 vaccine efficacy in preventing SARS-CoV-2 infection. The SARS-CoV-2 vaccine efficacy is all about a measure of how much the risk of getting disease is lowered in a clinical trial [20]. All results at reported time points and analyses were sought for meta-analysis. Methods for All results at the reported time points and analyses were sought for meta-analysis. Methods for deciding which results to collect for meta-analysis are predefined in inclusion criteria, framework of the study, relevance, consistency across studies, and consultation with experts. In addition to outcomes, various other variables were sought for data collection to contextualize, assess study quality, and explore sources of heterogeneity. Missing or unclear information was handled through imputation, sensitivity analysis, and publication bias. Missing or unclear information about the following variables was considered and handled along with definitions (Supplementary file 1). Sensitivity analyses were conducted to assess the impact of missing data on study outcomes and conclusions. There was no missing or unclear information due to publication bias.
Study risk of bias assessmentThe risk of bias assessment was undergone in and between studies to ensure the reliability and validity of the review. It was implemented by selecting a tool that can assess the risk of bias, defining bias domains, evaluating each study independently, recording justifications, resolving discrepancies, and summarizing findings (aggregating the risk of bias assessments for all included studies and presenting the results in a structured format such as a risk of bias table).
The Cochrane risk of bias (RoB-2) tool was used to assess the risk of bias in the included studies. Four independent reviewers assessed each study to ensure objectivity and reduce the risk of bias in the assessment process. After their independent assessments, they compared their evaluations. Discrepancies between them were resolved through discussion. No automation tools were used to manage the risk of bias assessment. The final risk of bias judgment was recorded for each study and categorized as ‘low risk’, ‘high risk’, or ‘unclear risk’ depending on the tool and criteria used.
Effect measuresEffect measures were calculated to quantify the magnitude and direction of the intervention across multiple studies. They were used to synthesize findings and estimate an overall treatment effect. The effect measures like mean difference, standardized mean difference, standard error, standard deviation, relative risk (RR), pooled standard deviation, pooled standard error, overall efficacy in percent, and CI were computed. Moreover, considerations for effect measures (interpretability, study heterogeneity, study design (RR for RCTs), reporting, subgroup analyses, and sensitivity and subgroup analyses) were sought.
Synthesis methodsThe whole process passed to decide which studies were eligible for synthesis is described in the eligibility section. Handling of missing summary statistics, data conversions for meta-analysis, data screening, and quality control, addressing outliers and skewed data, sensitivity analyses, and documentation and transparency were the data synthesis methods employed to ensure the data used for presentation and synthesis are accurate, consistent, standardized, and compatible across studies. Tabulation and visualization methods were employed to effectively summarize and communicate the results of individual studies and syntheses in meta-analysis, which made interpretation and decision-making easier. Forest plots, funnel plots, Galbraith plots, and subgroup analyses were used to visually display the results of individual studies and synthesis.
The methods used for synthesizing results in meta-analysis, along with rationales for their choice:
Random-Effects Model AssumptionAssumes that included studies estimate different treatment effects due to both random error and true heterogeneity.
RationaleRandom-effect models are suitable when significant heterogeneity is expected among studies, allowing for estimation of both within-study and between-study variability.
MethodIncorporates an estimate of between-study variance in addition to within-study variance, resulting in wider confidence intervals.
AdvantagesIt accounts for heterogeneity and provides a more conservative estimate of uncertainty.
Identification of statistical heterogeneity was performed by Cochran’s Q Test, I2 Statistic, and visual inspection of whether the CIs for each effect overlapped (forest plots, funnel plots, and Galbraith plots) (https://training.cochrane.org/handbook/current/chapter-10#section-10-10-4-1). Stata software package version 17.4 was applied for conducting the meta-analysis because of familiarity with the software and its compatibility with data formats and analysis requirements. The methods used for exploring heterogeneity were the forest plot (subgroup analysis, cumulative meta-analysis), heterogeneity test (Galbraith plot, sensitivity analyses), meta-regression, publication bias assessment, and quality assessment. Sensitivity analyses were conducted to assess the robustness of the synthesized results.
Reporting bias assessmentThe risk of bias due to missing results in a synthesis arising from reporting biases (publication bias or selective outcome reporting) was assessed to ensure the validity and reliability of meta-analytic results. Methods like funnel plot asymmetry, publication bias tests, and sensitivity analyses (exclusion of small studies, trim-and-fill method, and file drawer analysis) were employed to assess reporting bias.
Certainty assessment (certainty of evidence or confidence in the estimates)The certainty of the evidence for the outcome synthesized was assessed by applying GRADE (Grading of Recommendations Assessment, Development, and Evaluation). The GRADE was employed to evaluate evidence on study limitations, inconsistency, indirectness, imprecision, and publication bias in the included studies and to draw conclusions. It rates assessments with high, moderate, low, or very low certainty, provides a systematic approach for rating the overall confidence in the evidence, and helps to provide recommendations [21] (www.gradeworkinggroup.org).
Comments (0)