
Remember me
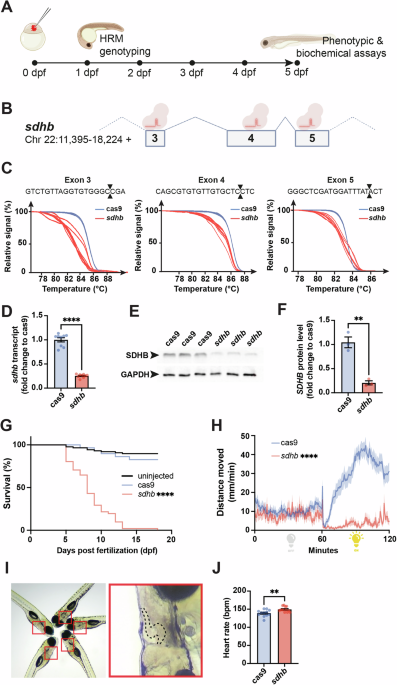
To efficiently invalidate SDHB expression and function in zebrafish embryos, we took advantage of a recently proven F0-knockout mutagenesis approach using CRISPR/Cas9 to generate SDHB loss-of-function zebrafish larvae (so-called CRISPants25). This approach enables the assessment of phenotypic and biochemical assays in a mutant genetic background of interest within days following microinjection (Fig. 1A). We designed and microinjected one-cell-stage embryos with a CRISPR cocktail targeting the SDHB gene at the exons 3, 4, and 5 levels (Fig. 1B). The potency of each guide RNA (gRNA) was assessed by High-Resolution Melting (HRM) analysis (Fig. 1C). The reduction in sdhb expression was evaluated at 5 dpf at both the transcriptomic and protein levels using RT-qPCR and western blot, respectively (Fig. 1D–F). Notably, the control groups consisted of embryos microinjected with mRNA encoding the Cas9 endonuclease, but without any gRNAs; these are referred to as “Cas9” in our figures. To validate the relevance of our sdhb-CRISPant model, we confirmed several phenotypes previously described in a stable SDHB-mutant zebrafish strain23. Particularly, we showed that sdhb-CRISPant larvae do not survive past 13 dpf ( < 50% survival rate reached at 8 dpf, Fig. 1G) and depict a significantly reduced motor activity, especially during light periods, during which Cas9 controls show increased swimming movements (Fig. 1H). Finally, we also confirmed that the sdhb-CRISPant larvae exhibit a significantly increased heart rate compared to Cas9 controls (Fig. 1I, J). Altogether, these results confirm the potency of the F0-CRISPant approach to rapidly and efficiently disrupt sdhb protein levels and function in vivo.
Fig. 1: F0-injected sdhb-CRISPant zebrafish larvae display SDHB-associated phenotypes.
A Timeline representation of our CRISPant approach starting with the microinjection of a gene-specific (i.e., sdhb) CRISPR/Cas9 mix in single-cell embryos, followed by High-Resolution Melting (HRM) genotyping from 1-day post-fertilization (dpf). Phenotypic and biochemical readouts can be acquired only few days following injection. B The genetic landscape of the zebrafish sdhb gene encompassing targeted exons 3, 4 and 5. C The mutagenic power of the injected CRISPR/Cas9 mix is validated by HRM comparing Cas9-injected embryos as controls in which only mRNA encoding CAS9 was microinjected (no gene-specific guide RNAs). D, E, F The level of sdhb expression is reduced in sdhb CRISPants both at the transcriptomic and protein levels as assessed by qRT-PCR (D) and western blot (E, F). (G) Survival of sdhb CRISPants (n = 51) is compared to Cas9-injected controls (n = 29) and uninjected larvae (n = 87) over 18 days. H The distance swam, binned per 30 s, is recorded for sdhb CRISPants (n = 32) and Cas9-injected controls (n = 32) during 60 min dark and 60 min light periods. I, J Representative setup and results of heart rate quantification in 5 dpf larvae (sdhb CRISPants, n = 13; Cas9-injected, n = 12). I Left: larvae mounted laterally in 3% methylcellulose for simultaneous video acquisition (~5 larvae per trial). Red boxes indicate individual larvae analyzed. Right: magnified view of one larva with the heart region outlined (dashed line), corresponding to the area used for automatic beat detection by DanioScope™ software. No anesthetic was used during acquisition. J Heart rate was quantified and compared using an unpaired t-test with two-tailed p-value calculation: ** p-value < 0.01; **** p-value < 0.0001. Icons in (A) and (B) are created in BioRender. Samarut, E. (2025) https://BioRender.com/xk8wiuf.
sdhb-CRISPant zebrafish larvae showed elevated secretion of free catecholamines and MMNWith this new SDHB-CRISPant genetic model in our hands, we sought to measure the levels of free catecholamines (e.g., dopamine, norepinephrine and epinephrine) and free MN (e.g., 3-methoxytyramine or 3-MT, normetanephrine (NM) and MN) in larvae lysates and their bathing medium compared to Cas9-controls (Fig. 2A, B). This approach is physiologically relevant, as zebrafish larvae excrete catecholamines and other metabolites into the surrounding medium via the pronephric kidney and cloaca at this stage26,27. We found that the levels of NM and MN were three times higher in sdhb-CRISPants (NM: 3.69, p < 0.0001, MN: 3.35, p < 0.0001) compared to control larvae. Interestingly, 3-MT displayed similar levels between both groups. Dopamine (DA) levels were also elevated in sdhb larvae compared to Cas9 (2.9, p < 0.0001). However, norepinephrine (NE) and epinephrine (E) were lower in sdhb mutants compared to Cas9 control larvae (0.81, p = 0.017; 0.51, p < 0.0001) (Fig. 2C). When we checked the level of these hormones in the fish bathing medium, we also observed that the level of NM, MN, and to a lower extent 3-MT were significantly increased (NM: 4.32, p < 0.0001; MN: 9.4, p < 0.0001 3-MT: 1.5, p = 0.0076) compared to the bathing medium of Cas9-controls (Fig. 2D). There was no statistical difference for DA and NE in the bathing medium of sdhb-CRISPants compared to controls. Of note, the levels of epinephrine were at or below the lower detection limit in most samples for the former and in some samples for the latter (n.d in Fig. 2D). Altogether, our data show that sdhb-CRISPant larvae display hormonal hypersecretion, which is relevant to sdhb-associated PPGLs.
Fig. 2: Catecholamine and metanephrine levels are affected in PPGL CRISPant zebrafish models.
A Individual embryos are microinjected at the one-cell stage and larvae are pooled at 4 dpf overnight. Catecholamines and metanephrines levels were assessed on day 5 from whole larvae lysates and bathing medium. B Metabolic path of catecholamines and metanephrine synthesis. Enzymes are italicized (DBH: Dopamine beta-hydroxylase, PNMT: Phenylethanolamine N-Methyltransferase, COMT: Catechol-O-methyltransferase). C,D Catecholamines and metanephrines levels in sdhb CRISPants (n ≥ 6 pools of 10 larvae) compared to Cas9-injected controls (n ≥ 6 pools of 10 larvae) (whole larvae, (C) and bathing medium (D)). E,F Catecholamines and metanephrines levels in nf1 CRISPants (whole larvae, (E) and bathing medium (F). Of note, the levels of NE were below the detection limit in Cas9-control samples, and a subjective basal value was used to calculate the NE fold-change increase in nf1-CRISPant larvae. Unpaired t-test with two-tailed p-value calculation: * p-value < 0.05; ** p-value < 0.01; *** p-value < 0.001; **** p-value < 0.0001. Icons are created in BioRender. Samarut, E. (2025) https://BioRender.com/xk8wiuf.
Catecholamine and MN levels are reliable biochemical readouts of different genetic PPGLsWe first wanted to validate the specificity of this hormonal hypersecretion by showing that it cannot be attributed to a nonspecific general physiological distress (i.e., premature death or weakened physiology). To do so, we showed that catecholamine and MN levels are not increased in an independent genetic model. We used the scn1lab-mutant genetic model, an ortholog of the human SCN1A gene, whose loss of function is associated with epileptic encephalopathy and is characterized by premature death and general physiological distress in zebrafish28. In these mutants (scn1lab-/-), we noted no increase in the levels of free catecholamines and MN, either in larval lysates or in the ambient bath. Instead, the levels of these hormones were significantly reduced in the mutants compared to their siblings (Fig. S1A). More importantly, this confirms that the hormonal hypersecretion observed in our sdhb-CRISPant model is specific and cannot be attributed to general physiological distress.
We also wanted to validate the specificity of these significant changes by showing that they cannot be attributed to a nonspecific general metabolic distress caused by the disturbance of the Krebs cycle, as is the case for mutations in PPGL cluster 120. To do so, we generated F0-CRISPRant zebrafish targeting another PPGL canonical gene (NF1). This gene belongs to a different genetic cluster (cluster 2) associated with PPGL pathogenesis, which does not affect the integrity of the Krebs cycle but rather kinase signaling8. The zebrafish’s genome encompasses two paralogous genes (nf1a and nf1b) orthologous to the human NF1 gene. Thus, we designed and validated six specific gRNAs (three against each paralog) targeting these genes in zebrafish (Fig. S1B). Notably, we found a significant increase in the level of all free catecholamines (DA: 1.95, p = 0.0245; NE:1.47, p < 0.0001; E: 1.54, p < 0.0001) and all free MN (3-MT: 2.94, p < 0.0001; NM 3.86, p < 0.0001; MN 4.4, p < 0.0001) in nf1-CRISPant larvae extracts compared to Cas9-controls (Fig. 2E). Importantly, it is worth noting that the elevation of norepinephrine and epinephrine in nf1-CRISPant compared to sdhb-CRISPant (Fig. S1C, D) is relevant to an adrenergic phenotype, which is a hallmark of PPGL cluster 2 mutations8. Consistently, the level of secreted catecholamines and MN in the bathing medium of nf1-CRISPants was also found elevated compared to Cas9-controls (Note that the levels of DA and E were below the detection threshold in this assay, Fig. 2F and S1D). Altogether, these data confirm that the biochemical quantification of free catecholamines and MN from whole larvae lysate and bathing medium is a specific readout of PPGL.
Sdhb-CRISPant zebrafish larvae display broad metabolic perturbations beyond Krebs metabolitesWe next sought to dig into the metabolic perturbations caused by sdhb loss-of-function, particularly among Krebs cycle metabolites and related metabolic pathways (Fig. 3A). In whole-larvae lysates, we found a significant increase in the levels of several Krebs cycle intermediates in sdhb-CRISPrant compared to Cas9 Controls (Fig. 3E–J). Notably, the levels of acetyl-CoA (1.586 p = 0.002; Fig. 3E), citrate-isocitrate (sdhb: 2.402 p = 0.0008; Fig. 3F) and succinate (sdhb: 21.78 p < 0.0001; Fig. 3H) were higher in sdhb CRISPants than in Cas9-control larvae. This is consistent with the impaired enzymatic activity of SDHB, which converts succinate to fumarate (Fig. 3A). We also looked the levels of glycolysis intermediates and showed that while the levels of glycerol-3-phosphate (Gro3P) (1.652, p < 0.0001; Fig. 3B) and lactate (4.421 p < 0.0001; Fig. 3D) were significantly increased in sdhb CRISPants, the level of DHAP (dihydroxyacetone phosphate) was significantly reduced (0.71, p = 0.0112; Fig. 3C). We quantified the levels of various dinucleotides and nucleotides central to bioenergetics (Fig. 3A, K–P). We found that sdhb-CRISPant larvae displayed higher levels of ATP (2.560, p < 0.0001; Fig. 3M), GTP (1.996, p = 0.0014; Fig. 3N) and NAD+ (1.498, p = 0.0013; Fig. 3O) but lower levels of NADH (0.536, p = 0.0013) compared to Cas9-control larvae. This suggests significant reprogramming of mitochondrial energy production. Finally, we quantified the levels of several amino acids and other metabolites linked to Krebs cycle and redox regulation (Fig. 3A, Q–V). Interestingly, we noted a significant increase in the levels of leucine (2.287 p < 0.000 1; Fig. 3Q) and arginine (1.610 p = 0.0007; Fig. 3S) in sdhb-CRISPant larvae compared to Cas9-controls. Conversely, the levels of aspartate (0.2722 p < 0.0001; Fig. 3R), glutamate (0.8111 p < 0.0001; Fig. 3U) and oxidized glutathione (sdhb: 0.7011 p < 0.0001; Fig. 3V) were significantly lower in sdhb CRISPants than in Cas9-control larvae.
Fig. 3: sdhb CRISPants depict broad metabolic pertubations.
A Schematic of Krebs cycle intermediates (in blue) and other metabolites from related pathways (in black) which have been assayed from whole 5 dpf larvae lysates. The changes observed in sdhb CRISPants are indicated with arrowheads (green: increase; red: reduction). B–V Individual metabolite quantified from whole sdhb-CRISPant larvae (pools of 10; n = 9 pools of 10) to Cas9-injected control larvae (n = 10 pools of 10). W Oxygen consumption rate (OCR) was measured in whole Cas9-injected control and sdhb-CRISPant larvae at 2 and 5 days post-fertilization (dpf) using a Seahorse XFe96 analyzer. Unpaired t-test with two-tailed p-value calculation: * p-value < 0.05; ** p-value < 0.01; *** p-value < 0.001; **** p-value < 0.0001.
Given that SDHB encodes a core subunit of mitochondrial complex II, which links the Krebs cycle to the electron transport chain (ETC), we investigated whether its disruption impairs mitochondrial respiration. To this end, we measured the basal oxygen consumption rate (OCR) in sdhb CRISPant zebrafish embryos and larvae using a Seahorse XFe96 analyzer. Surprisingly, OCR was not significantly different from control embryos at either 2 or 5 dpf (Fig. 3W). This unexpected preservation of mitochondrial respiration despite sdhb deficiency suggests the activation of compensatory metabolic mechanisms to sustain oxidative phosphorylation. Altogether, while these data confirm the expected changes in the levels of glycolytic and Krebs cycle intermediates associated with the impairment of SDHB activity (i.e., succinate and lactate increase), they also broaden the scope of the metabolic perturbations caused by sdhb loss-of-function and indicate that basal mitochondrial respiration is unaffected.
Sdhb loss-of-function leads to broad transcriptomic changes in zebrafish sdhb-CRISPantsFinally, we sought to profile the transcriptional changes caused by sdhb loss-of-function in vivo. To do so, we extracted RNAs from whole 5-dpf larvae and sequenced their transcriptome using Next-Generation Sequencing (Fig. 4A). Upon differential gene expression (DEG) analysis, we identified 443 upregulated genes and 326 downregulated genes (filtered by a 5% adjusted p-value and log2 Fold Change \(\ge 1\)) in sdhb CRISPants compared to Cas9-controls (Fig. 4B and Supplementary Data 1). We built a heat-map plotting the more significant negative DEG correlations between Cas9-control and sdhb-CRISPant samples. This map highlights sdhb as strongly underexpressed in the mutant situation (Fig. 4C). Conversely, hypoxia response genes (hif1al and igfbp1a), angiogenesis gene (angptl4), stress response genes (fkbp5 and hsd11b2) and glycolysis gene (pfkfb4b) were all upregulated in the mutant condition (Fig. 4C). These expression changes of relevant DEGs (i.e. hif1al) were confirmed by RTqPCR on independent biological samples (Fig. 4D–I). We also found that other subunits of the SDH complex, enzymes of the Krebs cycle or mitochondrial biogenesis markers (i.e. PGC1-alpha) showed no significant transcriptional changes (Fig. S2A). Moreover, we examined the differential expression of genes involved in the mitochondrial electron transport chain (ETC) and found that only sdhb met our differential expression threshold (log2FC > 1) in sdhb CRISPants. Four additional ETC-related genes showed mild but statistically significant regulation: cox4i2 and atp1b1a were moderately upregulated, while sdhaf2 and ndufaf3 were slightly downregulated (Supplementary Data 2). These modest changes may reflect localized or adaptive responses to the loss of SDHB. However, the vast majority of ETC components, including structural subunits of complexes I to V, remained transcriptionally unchanged, which is consistent with the preserved oxygen consumption rate (OCR) observed in sdhb-deficient larvae (Fig. 3W).
Fig. 4: Transcriptomic changes in sdhb CRISPants.
A Experimental timeline from one-cell stage embryo microinjection to whole larvae mRNA extraction at 5 dpf for RNA-sequencing. B Volcano plot with differentially expressed genes (DEGs) in red (filtered with a value < 0.05 and an absolute log2FoldChange > 1). The full list of DEGs is available in Supplementary Data 1. C Heatmap representing the top 20 DEGs between sdhb-CRISPant samples (sdhb_1, sdhb_2, sdhb_3) and Cas9 controls (cas9_1, cas9_2, cas9_3). D–I qRT-PCR validation of changes in the expression of relevant genes between sdhb-CRISPant (n = 6 pools of 10 larvae) and Cas9-injected control (n = 6 pools of 10 larvae) at 5 dpf. J Lollipop plot of top 15 significantly enriched KEGG pathways clustered from sdhb vs cas9 DEGs. The complete list of enriched KEGG pathways is available in Supplementary Data 2. Icons in panel A are created in BioRender. Samarut, E. (2025) https://BioRender.com/xk8wiuf.
Finally, using DAVID resources29, we conducted a KEGG pathway enrichment analysis with the DEG list, which included genes that met the criteria of p value ≤ 0.05 and log2 Fold Change ≥ 1, encompassing both upregulated and downregulated genes (Fig. 4J). Our analysis revealed several significantly enriched KEGG pathways in our sdhb-CRISPant samples, DNA replication, cell cycle and Metabolic Pathways (Fig. 4J and Supplementary Data 3). These data are consistent with the function of the SDHB gene in both the mitochondrial respiratory chain and several main metabolic processes via the Krebs cycle.
Comments (0)