
Remember me
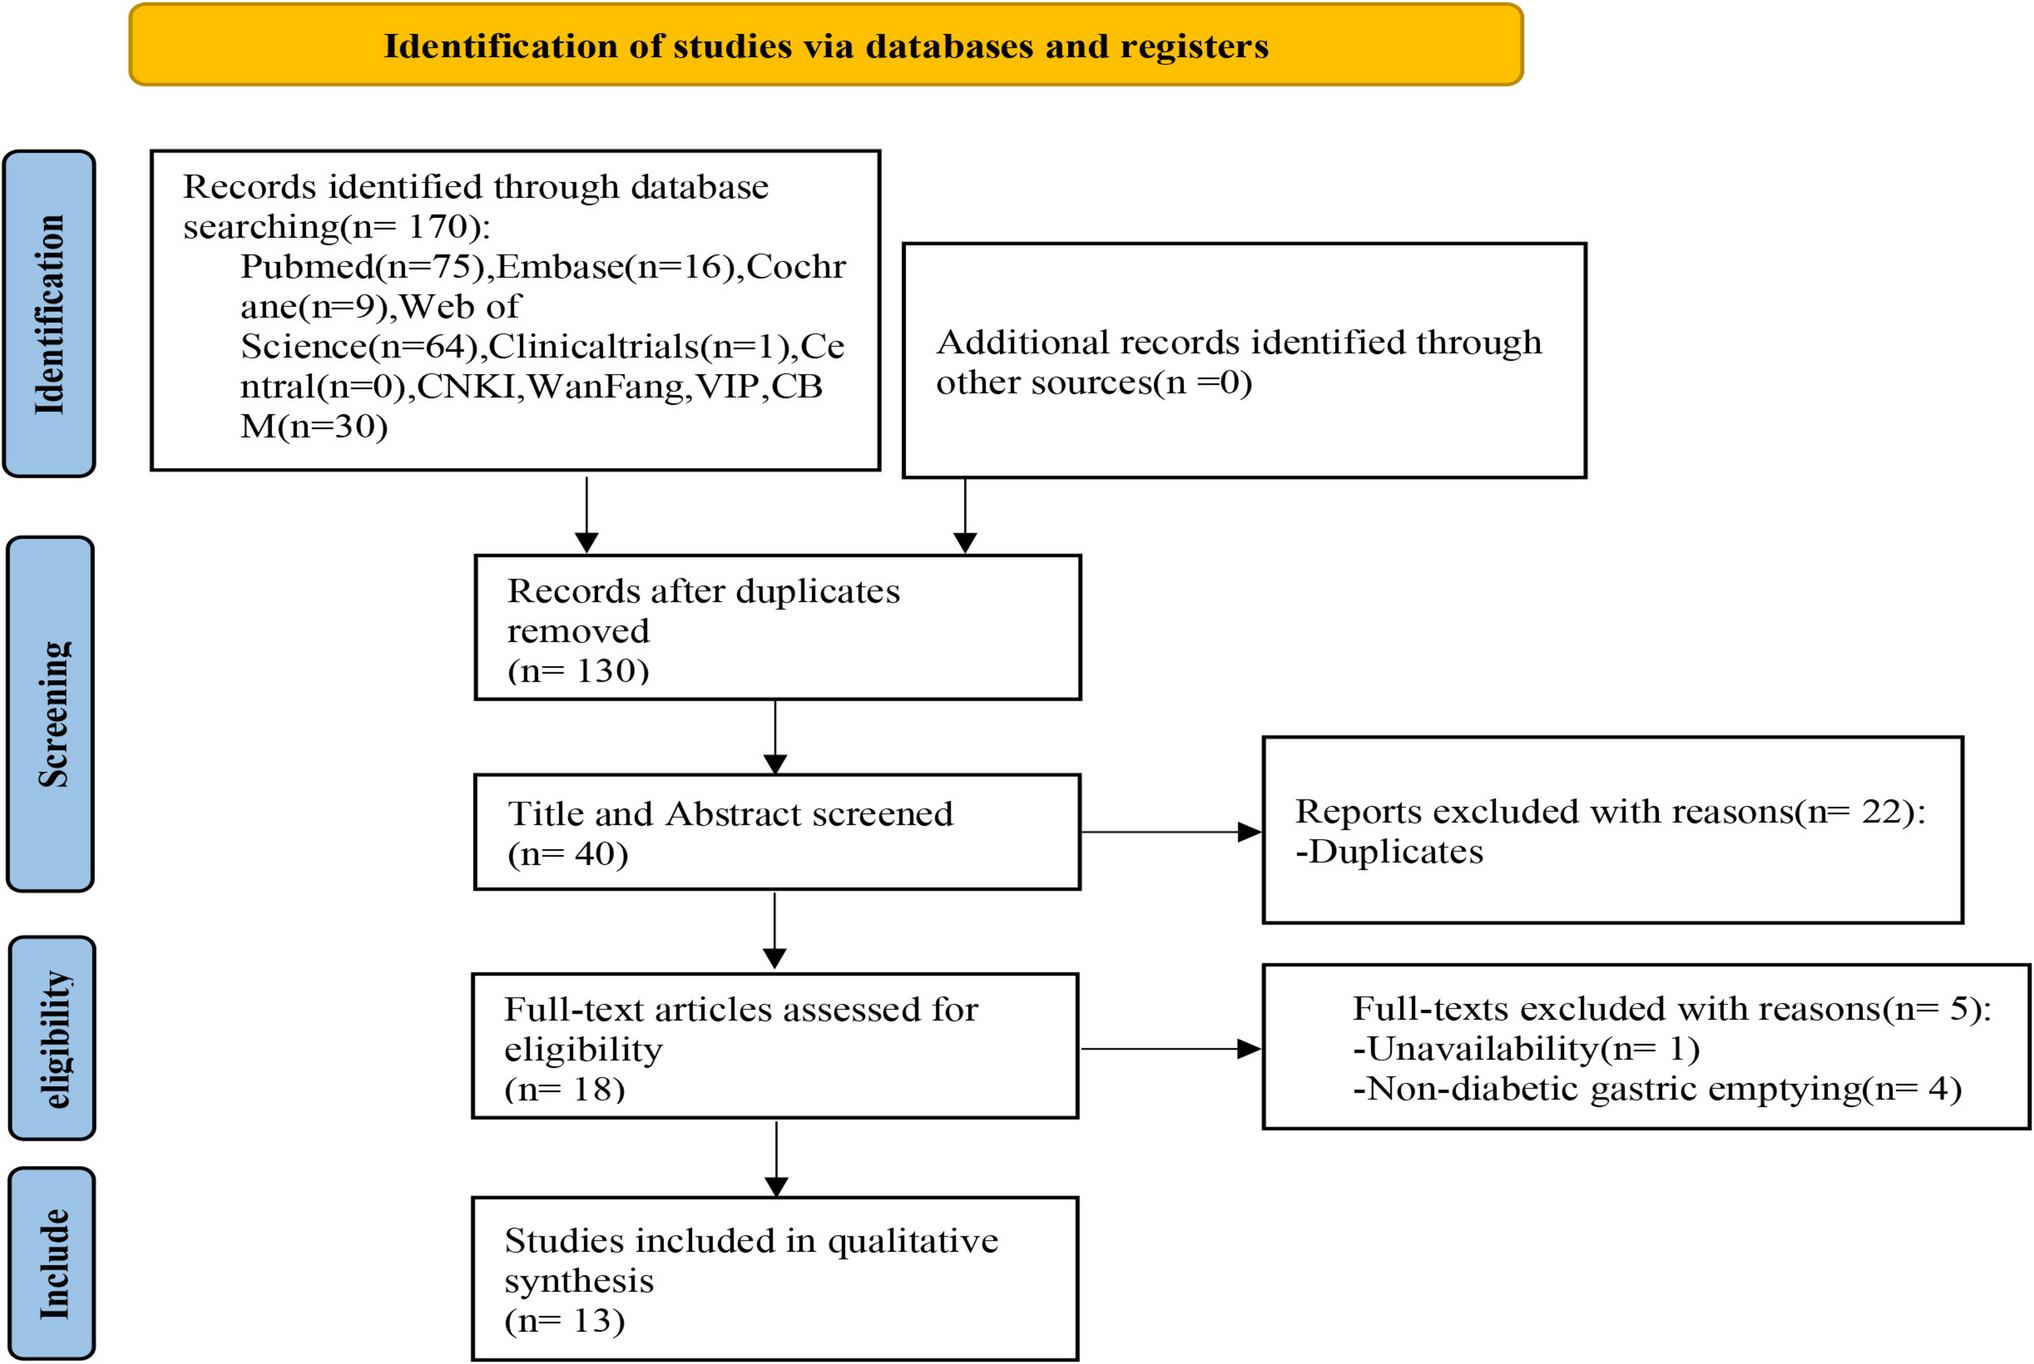

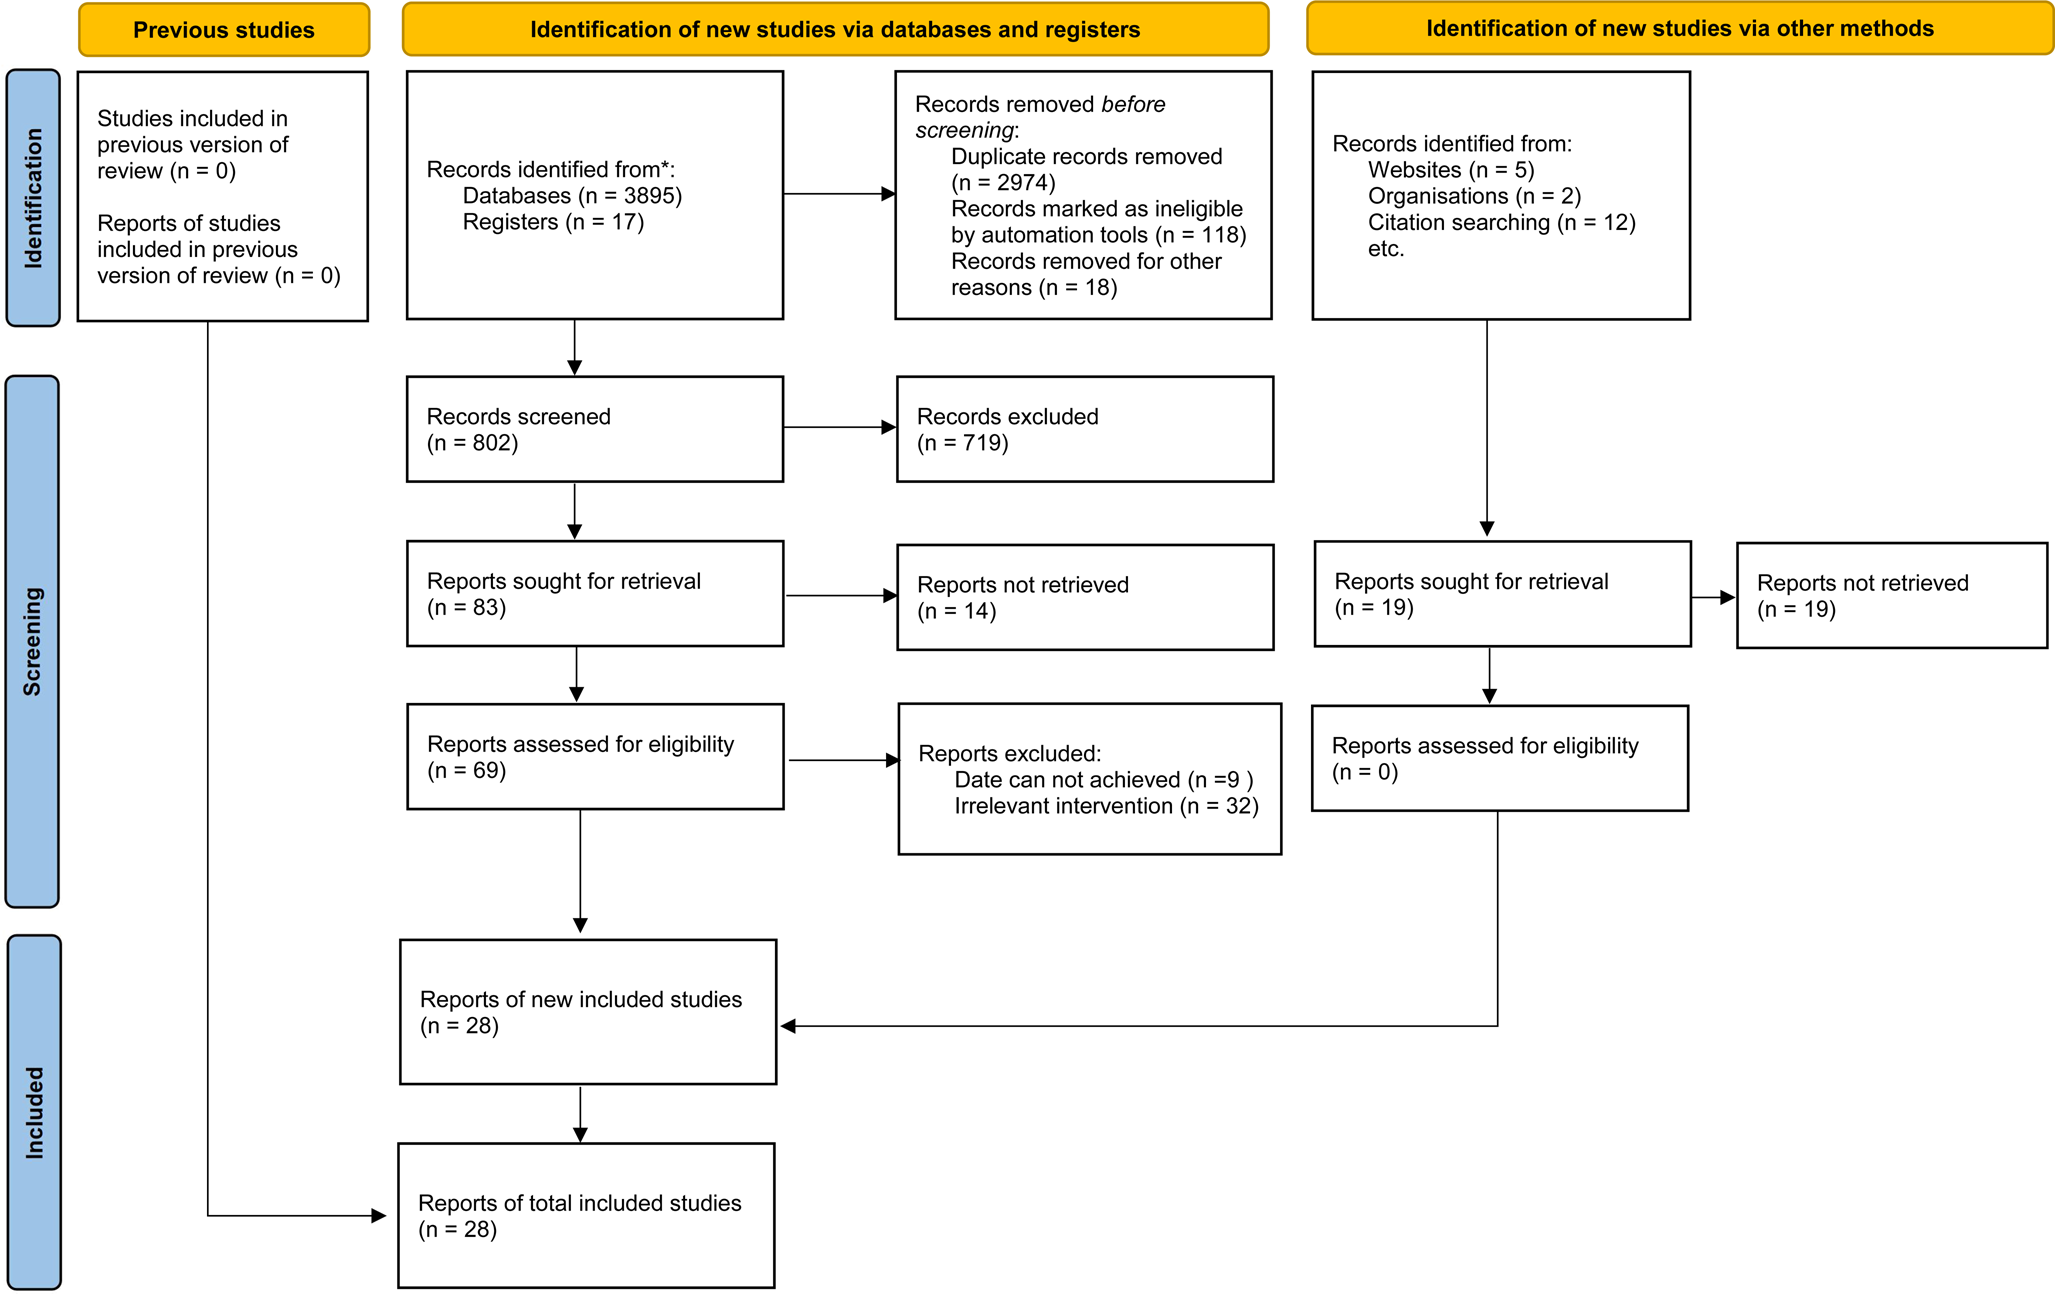
The flow diagram of the study selection process is shown in Fig. 1. Twenty-six reports from 25 trials comprising a total of 3224 patients with T1D reported at least one of the predefined outcomes of interest and were included in the systematic review. Study and participants’ baseline characteristics are presented in Supplementary Table 1.
Fig. 1
Preferred Reporting Items for Systematic reviews and Meta-Analyses (PRISMA) flow chart for the identification, inclusion, and exclusion of studies
Although we did not use age restrictions, only studies in adults were available. The most commonly studied GLP-1RA was liraglutide (N = 16 trials) [18,19,20,21,22,23,24,25,26,27,28,29,30,31,32,33,34], followed by exenatide (N = 6) [35,36,37,38,39,40], lixisenatide (N = 1) [41], semaglutide (N = 1) [42], and dulaglutide (N = 1) [43]. Mean T1D duration was 17 years, including three studies that recruited patients with a very recent diagnosis of T1D (from 33 days to 10 weeks from diagnosis) [26, 27, 38]. Mean age of the included participants was 40.5 years, their mean HbA1c being 7.9% and BMI 26.6 kg/m2. Study duration ranged from 4 weeks to 1 year. Three studies were available only as conference abstracts [26, 33, 34].
Glycemic controlTwenty studies with 3095 participants had a duration of at least 12 weeks and were included in the analysis for the change in HbA1c [18, 20,21,22,23,24,25,26,27,28, 31,32,33,34,35, 37, 38, 40, 42, 43]. GLP-1RA improved glycemic control by reducing HbA1c compared to placebo (MD −0.23%, 95% CI −0.30 to −0.17, Ι2 24%) (Fig. 2). The risk of bias was deemed low only for six trials, there were some concerns for five trials, and in nine trials the risk of bias was considered high (Supplementary Material). We then performed a pre-specified subgroup analysis based on baseline C-peptide levels. Nine studies included either patients with new onset of T1D or with detectable C-peptide levels [21, 22, 26, 31, 34, 35, 43] and were considered having preserved β-cell function. In patients with preserved β-cell function, the addition of a GLP-1RA improved HbA1c compared to placebo to a larger extent than in patients without residual β-cell function (MD −0.42%, 95% CI −0.57 to −0.26, Ι2 60% vs MD −0.17%, 95% CI −0.22 to −0.12, test for subgroup differences p = 0.003) (Supplementary Fig. 1). We did not identify asymmetry in the Funnel plot (Supplementary Material, Supplementary Fig. 2).
Fig. 2
Effect of GLP-1RA compared with placebo on HbA1c (%). * a: liraglutide 0.6 mg, b: liraglutide 1.2 mg, c: liraglutide 1.8 mg. PBO: placebo, CI: confidence interval
Eleven studies involving 549 patients reported data on TIR. Most studies defined TIR as target interstitial glucose levels between 3.9–10.0 mmol/L, except for three studies [25, 28, 32] which used a more stringent interstitial glucose range between (3.8–7.8 mmol/L, 3.9–8.9 mmol/L and 3.8–8.8 mmol/L, respectively) to define TIR. Most studies presented TIR data as %. Few studies presented TIR data as hours per day and in these studies TIR was calculated as % after multiplying by 100 and dividing by 24. Duration of CGM recordings also varied among studies (Supplementary Material). Use of a GLP-1RA did not significantly affect TIR (MD 1.99%, 95% CI −1.17 to 5.15, Ι2 91%) (Fig. 3).
Fig. 3
Effect of GLP-1RA compared with placebo on time-in-range (TIR) (%). * a: liraglutide 0.6 mg, b: liraglutide 1.2 mg, c: liraglutide 1.8 mg. PBO: placebo, CI: confidence interval
Body weightTwenty studies involving 3095 patients were included in the analysis for the change in body weight [18, 20,21,22,23,24,25,26,27,28, 31,32,33,34,35, 37, 38, 40, 42, 43]. Use of GLP-1 RAs reduced body weight (MD −3.93 kg, 95% CI −4.29 to −3.56, Ι2 49%) (Fig. 4).
Fig. 4
Effect of GLP-1RA compared with placebo on body weight (kg). *a: liraglutide 0.6 mg, b: liraglutide 1.2 mg, c: liraglutide 1.8 mg. PBO: placebo, CI: confidence interval
Total insulin doseFourteen studies reported total insulin dose in U/day [18, 20,21,22,23, 26, 28, 30,31,32, 34, 36, 41, 42], five studies reported it in U/kg [25, 27, 29, 37,
Comments (0)