
Remember me
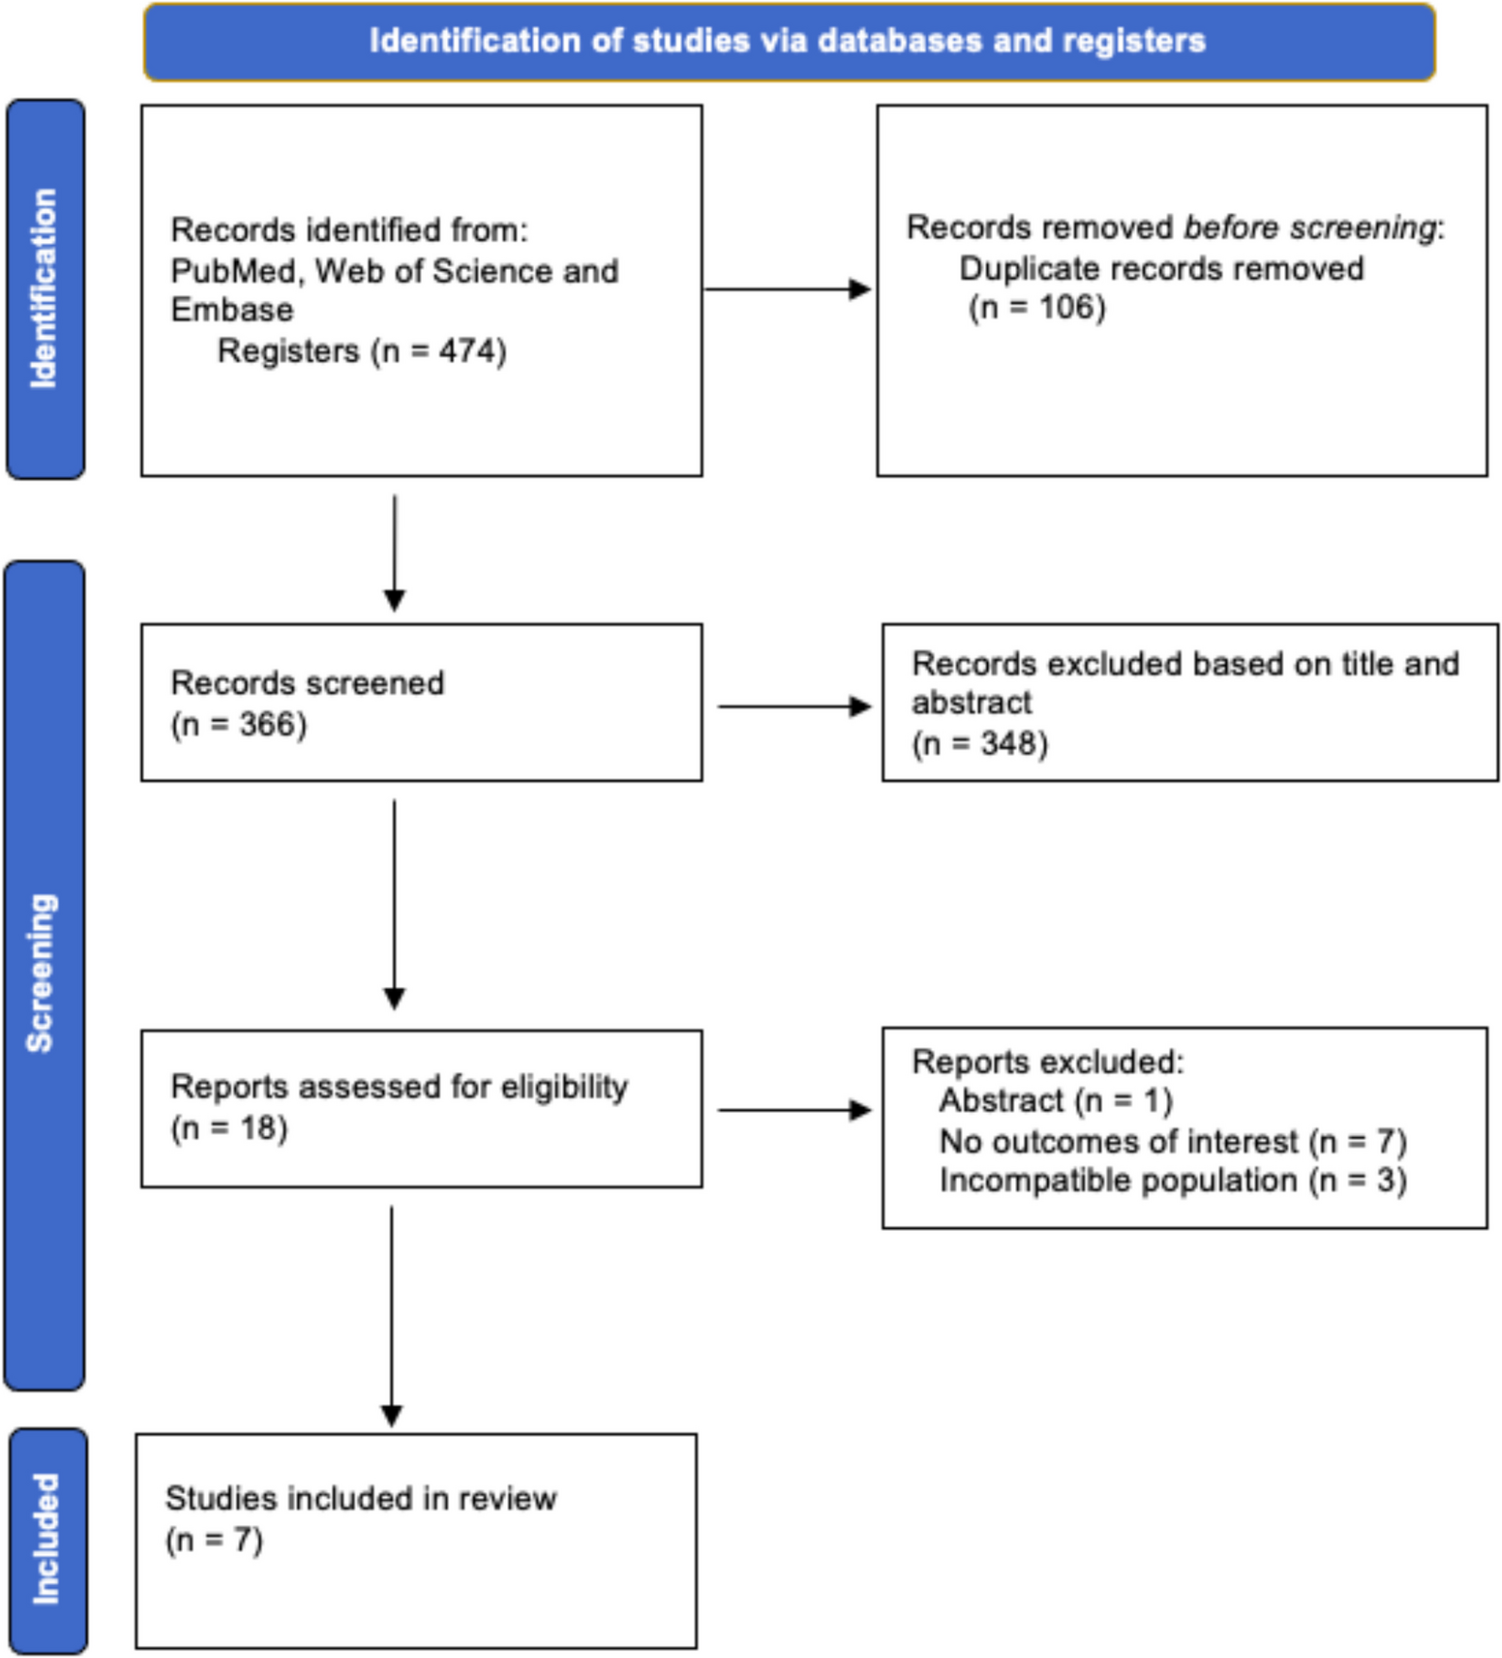
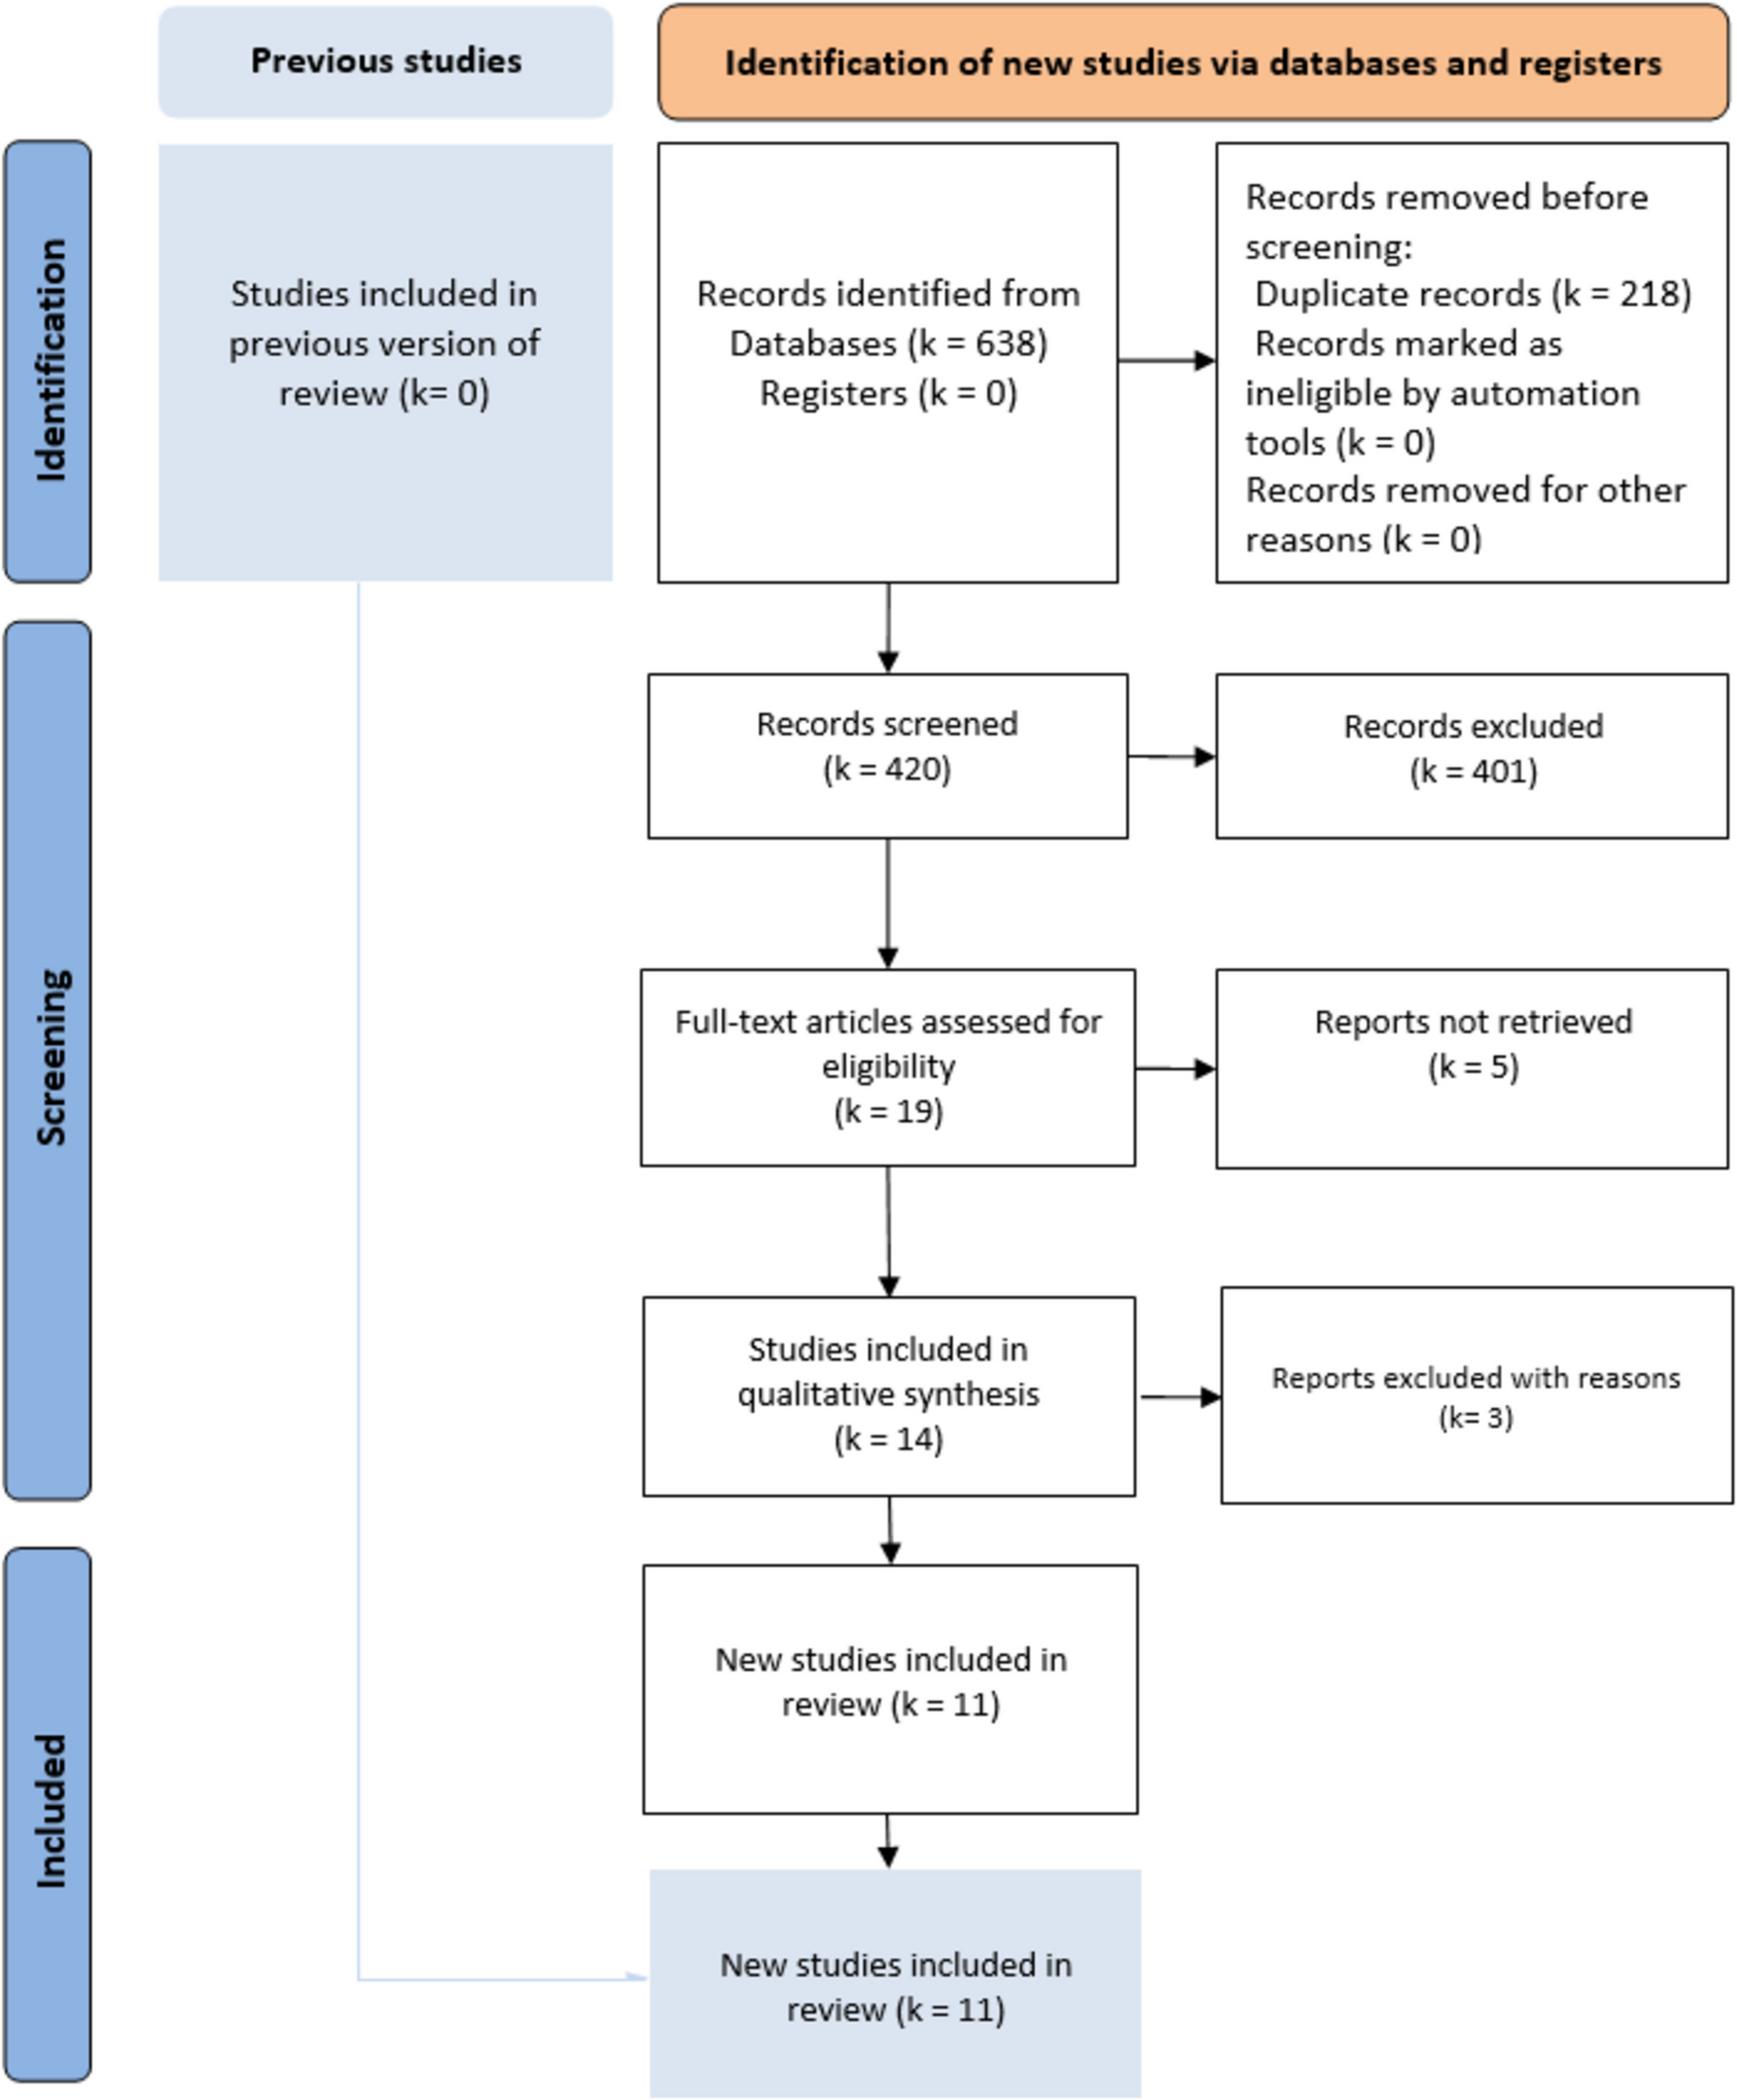
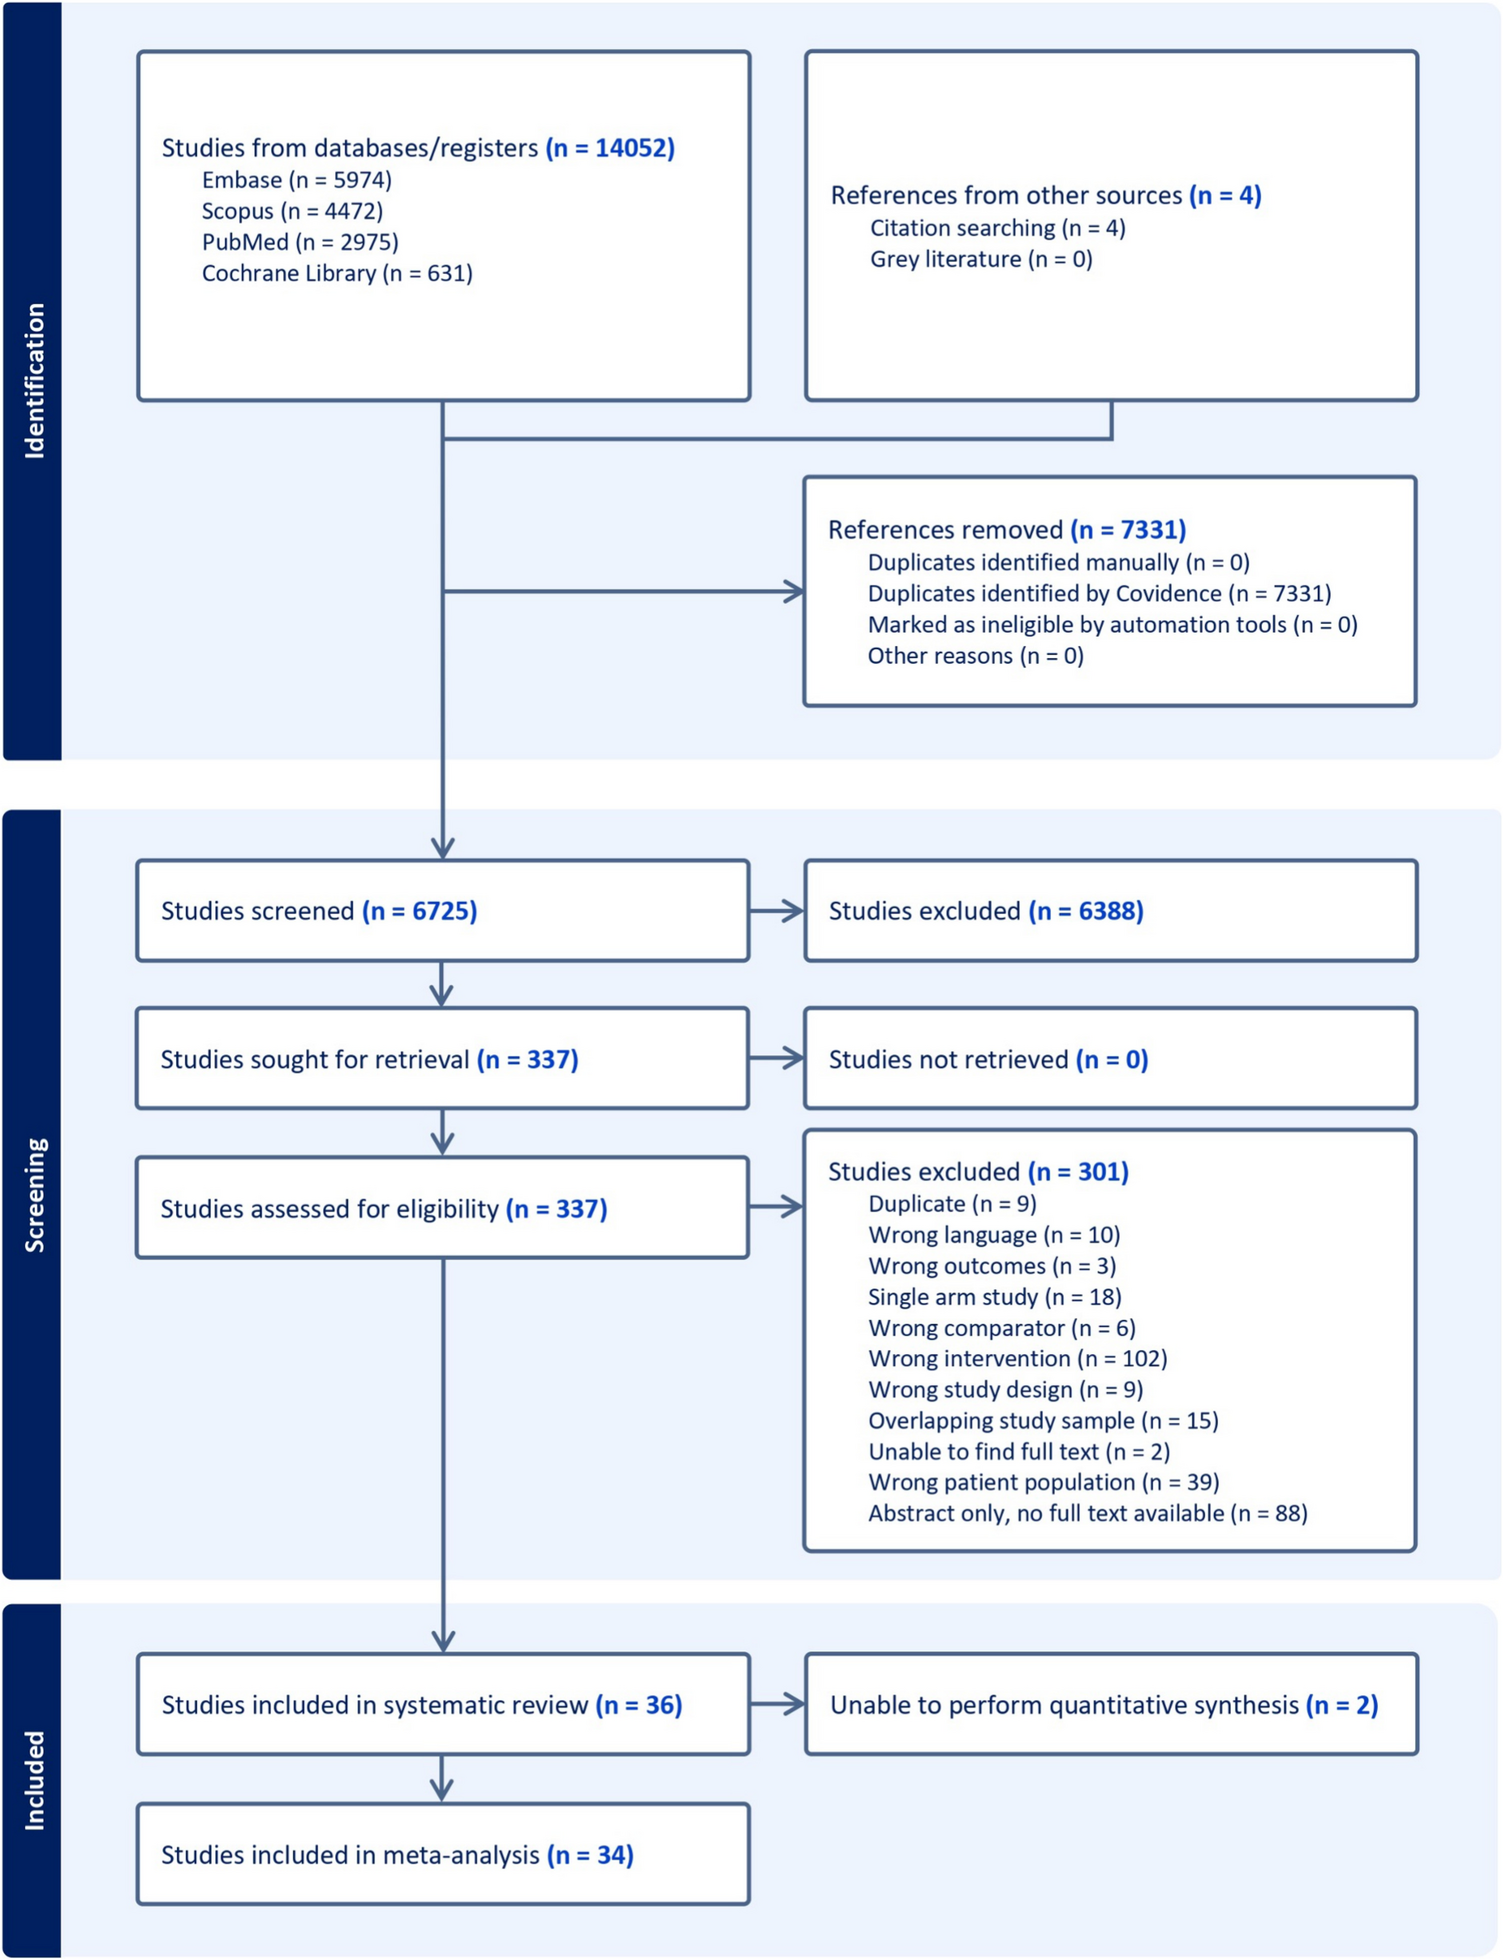

Initial literature search identified a total of 7774 studies. After removing 1548 duplicates (1543 identified by Covidence and 5 manually), 6226 studies remained for screening. The selection process is illustrated in Fig. 1. In the initial screening phase, 5679 studies were excluded based on their title and abstract review, leaving 547 studies for full-text evaluation. During the full-text review, 520 studies were further excluded. The reasons for exclusion were as follows: 180 were reviews, editorials, or non-peer-reviewed articles, 166 did not specify types of red meat, 87 lacked sufficient quantitative data, 69 had no available full texts, and 18 did not provide data on CRC incidence. Following this process, 27 studies met the eligibility criteria and were included in the systematic review and meta-analysis [16, 18,19,20,21,22,23,24,25,26,27,28,29,30,31,32,33,34,35,36,37,38,39,40,41,42,43].
Fig. 1
Flowchart of literature search and selection of studies
The studies included were published between 1993 and 2024, representing over three decades of research (Supplementary Table 1). Of the included studies, 18 (66.7%) were case–control studies, and 33.3% were cohort studies. Cohort studies had follow-up periods ranging from 4.8 to 26 years, with a median follow-up of 10.6 years. These studies covered a wide geographical range with two from Africa (Morocco and Uganda), five from Asia (China, India, Israel, Japan, and Malaysia), eight from Europe (Denmark, France, Germany, the Netherlands, and Sweden), eight from North America (Canada, Mexico, and USA), and four from South America (Argentina, Brazil, and Uruguay). This diversity provides a global perspective on the relationship between red meat consumption and CRC risk across varied populations and dietary patterns.
The total number of participants across these studies was 1,028,166, with individual sample sizes ranging from 270 to 478,040 participants. The largest study, conducted by Norat et al. (2005), involved multiple European countries [26]. The age range of participants was broad, with most studies focusing on adults aged 40 and above, though some included younger participants, resulting in an overall range from 18 to 89 years. Gender distribution was reported in most studies, with many achieving relatively balanced representation.
Beef Consumption and CRCFor beef consumption, the meta-analysis comprised 22 studies for CRC and 11 studies specifically examining CC and RC (Fig. 2). A positive association was identified between beef consumption and CRC risk, with a pooled RR of 1.30 (95% CI: 1.10–1.54, p = 0.0022). When analysing specific cancer subtypes, a possible relationship was observed for CC with an RR of 1.19 (95% CI: 0.99–1.43, p = 0.0585), while RC demonstrated a nonsignificant positive association (RR = 1.19, 95% CI: 0.95–1.49, p = 0.1408).
Fig. 2
Forest plot of relative risk of colorectal, colon, and rectal cancer with high versus low beef consumption
To evaluate potential publication bias and small-study effects, funnel plots were created for overall CRC, as well as for CC and RC separately (Supplementary Figs. 1, 2, 3). These funnel plots, combined with Egger’s test results, suggest that while publication bias may not be a major concern for CC and RC individually, it could be influencing the results for overall CRC (p < 0.0001).
Substantial heterogeneity was observed across all analyses for beef consumption, with I2 values of 97.64% for CRC, 80.85% for CC, and 80.49% for RC, indicating considerable variability in the reported associations. To explore potential sources of this heterogeneity, several subgroup analyses and meta-regressions were conducted. Our subgroup analyses revealed several important findings (Table 1). Consistently across CRC, CC, and RC, stronger associations were observed in case–control studies compared to cohort studies (Figs. 3, 4, 5). For CRC, case–control studies reported an RR of 1.53 (95% CI: 1.19–1.98), whereas cohort studies showed an RR of 1.04 (95% CI: 0.96–1.13). This difference was statistically significant (p = 0.0382). A similar pattern was observed for RC (p = 0.0516), suggesting that the study design is a significant factor contributing to heterogeneity in the results.
Table 1 Stratified meta-analyses of beef consumption and colorectal, colon, and rectal cancer riskFig. 3
Forest plot of cohort and case–control studies of colorectal cancer risk associated with beef consumption
Fig. 4
Forest plot of cohort and case–control studies of colon cancer risk associated with beef consumption
Fig. 5
Forest plot of cohort and case–control studies of rectal cancer risk associated with beef consumption
Publication year emerged as another significant moderator influencing the observed associations. Studies published before 2015 reported stronger associations for both CRC and CC compared to those published after 2015. For CRC, studies published before 2015 had an RR of 1.63 (95% CI: 1.20–2.23), whereas post-2015 studies showed a weaker association (RR: 1.03, 95% CI: 0.99–1.08), with this difference being statistically significant (p = 0.0178). A similar trend was evident for CC (p = 0.0145).
Geographical differences were particularly pronounced for RC, with South American studies reporting the strongest association (RR = 2.36, 95% CI: 1.40–3.97), followed by Asian studies (RR = 1.17, 95% CI: 0.79–1.73) and European studies (RR = 0.92, 95% CI: 0.74–1.14). These differences were statistically significant (p = 0.0018), underscoring the role of regional dietary patterns and other contextual factors.
For all cancer groups (CRC, CC, and RC), studies which were not adjusted for physical activity reported substantially stronger associations between beef consumption and cancer risk. For CRC, non-adjusted studies yielded an RR of 1.91 (95% CI: 1.36–2.67), compared to an RR of 1.06 (95% CI: 0.97–1.15) in adjusted studies. This difference was highly significant (p = 0.0007), with similar patterns observed for CC (p = 0.0219) and RC (p = 0.0888).
Meta-regression analysis for CRC further substantiated these findings. The model explained 26.78% of the heterogeneity in the beef-CRC association, with physical activity emerging as the most significant moderator (p = 0.0006). Other potential moderators, including BMI, alcohol consumption, smoking, and dietary fibre, did not significantly impact the relationship. For CC, the meta-regression model explained a larger proportion of heterogeneity (R2 = 52.76%), identifying dietary fibre as an important factor (p = 0.0190). Conversely, no clear influential factors were identified for RC, potentially due to the smaller number of studies (n = 6).
To further explore the beef-CRC relationship, a dose–response analysis was conducted (Fig. 6). The results showed that each 50 g/day increase in beef consumption was associated with a 23% higher risk (RR = 1.23, 95% CI: 1.09–1.39, p = 0.0006). The spline model also confirmed the positive association, highlighting a particularly strong relationship at higher levels of beef consumption (p = 0.0002), further supporting a dose-dependent relationship between beef intake and CRC risk.
Fig. 6
The plot compares linear and spline models, with the size of each bubble representing the number of cases in each study
Pork Consumption and CRCThe current study identified significant associations between pork consumption and various cancer risks (Fig. 7). For CRC, a random-effects meta-analysis of 16 studies showed a significant positive association, with an RR of 1.17 (95% CI: 1.09–1.25, p < 0.0001). However, for CC, the analysis of nine studies did not reveal a clear association (RR = 1.02, 95% CI: 0.89–1.15, p = 0.8172). Similarly, the pooled analysis for RC showed a nonsignificant positive trend, with an RR of 1.12 (95% CI: 0.94–1.33, p = 0.2113).
Fig. 7
Forest plot of relative risk of colorectal, colon, and rectal cancer with high versus low pork consumption
To assess potential publication bias in our meta-analysis, we generated funnel plots for CRC, CC, and RC (Supplementary Figs. 4, 5, and 6). Across all three funnel plots, studies with larger sample sizes (and lower standard errors) were observed to cluster closely around the overall effect estimate. In contrast, studies with smaller sample sizes showed greater variability in their reported effect sizes.
Despite these observations, Egger’s test indicated no significant asymmetry across any of the cancer types (CRC: p = 0.111; CC: p = 0.6023; RC: p = 0.4786). These results suggest minimal publication bias in the included studies, providing greater confidence in the overall findings of this analysis.
A moderate heterogeneity was observed across studies for all cancer types (CRC: I2 = 40.42%; CC: I2 = 46.59%; RC: I2 = 40.62%), which is common in dietary meta-analysis due to variations in study designs and populations. Subgroup analyses for CRC consistently indicated positive associations across various study characteristics (Table 2). Both case–control (RR = 1.20, 95% CI: 1.09–1.31) and cohort studies (RR = 1.13, 95% CI: 1.02–1.25) demonstrated significant positive associations with CRC risk (Fig. 8). In contrast, analyses for CC and RC revealed no clear associations, though a trend toward increased risk was observed for both study types (Figs. 9, 10).
Table 2 Stratified meta-analyses of pork consumption and colorectal, colon, and rectal cancer riskFig. 8
Forest plot of cohort and case–control studies of colorectal cancer risk associated with pork consumption
Fig. 9
Forest plot of cohort and case–control studies of colon cancer risk associated with pork consumption
Fig. 10
Forest plot of cohort and case–control studies of rectal cancer risk associated with pork consumption
Studies published after 2015 demonstrated more consistent positive associations across all cancer groups, particularly for CRC (RR = 1.14, 95% CI: 1.09–1.18, p < 0.0001) and marginally for RC (RR = 1.14, 95% CI: 1.00–1.31, p = 0.05), as outlined in Table 2. More extensive studies (> 1500 participants) showed a significant association for both CRC (RR = 1.17, 95% CI: 1.08–1.26, p < 0.0001) and RC (RR = 1.14, 95% CI: 1.00–1.31, p = 0.05).
Analysis of measurement methodologies indicated significant positive associations for CRC using both frequency-based (RR = 1.36, 95% CI: 1.10–1.70) and portion-based approaches (RR = 1.12, 95% CI: 1.07–1.17). The influence of confounding factors varied by cancer type. In CRC studies, the association remained significant after adjustments for various confounding factors such as BMI, alcohol consumption, smoking, physical activity, and dietary fibre intake. For RC, studies that adjusted for physical activity reported a positive association (RR = 1.19, 95% CI: 1.05–1.35, p = 0.01), while those adjusted for dietary fibre also indicated a similar association (RR = 1.17, 95% CI: 1.03–1.33, p = 0.02).
Meta-regression analyses were performed for CRC, CC, and RC. For CRC, the mixed-effects model reduced residual heterogeneity to 15.46%, accounting for 52.76% of the observed heterogeneity (R2). In contrast, both CC and RC models demonstrated complete heterogeneity resolution, with I2 = 0% and R2 = 100%, suggesting that the included moderators fully explained the variation in effect sizes for these cancer types. Adjustment for dietary fibre emerged as a significant moderator for CRC (p = 0.0190), suggesting that studies accounting for dietary fibre reported stronger associations between pork consumption and CRC risk. However, this effect was not significant for CC (p = 0.4276) or RC (p = 0.3467). Other individual moderators did not show statistically significant effects, potentially due to the limited number of studies and reduced statistical power.
A dose–response analysis was also conducted (Fig. 11), which showed each 50 g/day increase in pork consumption was associated with a 15% higher risk of CRC (RR = 1.15, 95% CI: 0.96–1.36, p = 0.127). The linear model (AIC = − 12.1) provided a better fit than the spline model (AIC = − 7). These dose–response findings support our overall meta-analysis results (RR = 1.17, 95% CI: 1.09 − 1.25), showing a significant positive association between pork consumption and CRC risk.
Fig. 11
The plot compares linear and spline models, with the size of each bubble representing the number of cases in each study
Lamb Consumption and CRCFor lamb consumption, the meta-analysis included six studies for CRC, four for CC, and four for RC. The results are summarised in the forest plots (Fig. 12), which display the RR and CI for each study, as well as the pooled estimates. For CRC, the random-effects model indicated a significant association, with a pooled RR of 1.11 (95% CI: 1.02–1.21, p = 0.0216) and low heterogeneity (I2 = 15.9%). For CC, the analysis revealed a positive but nonsignificant association (RR = 1.16, 95% CI: 0.92–1.46, p = 0.184), with moderate heterogeneity (I2 = 44.1%). On the other hand, for RC, no clear association was found (RR = 1.06, 95% CI: 0.92–1.21, p = 0.853), with negligible heterogeneity (I2 = 0.0%).
Fig. 12
Forest plot of relative risk of colorectal, colon, and rectal cancer with high versus low lamb consumption
Of the three red meat types, lamb had the fewest number of studies, with only one prospective cohort study available. While a modest association was observed for CRC (p = 0.0216), the limited data preclude reliable conclusions. Comparisons between study designs (cohort vs. case control) were limited by the scarcity of cohort data (one study) across all cancer types (CRC, CC, and RC). These results are presented in Supplementary Figs. 7, 8, and 9 for transparency but should be interpreted cautiously. To evaluate publication bias and small-study effects, funnel plots (Supplementary Figs. 10, 11, and 12) and Egger’s regression test were performed for each cancer subgroup (CRC, CC, and RC). The results suggested that publication bias is unlikely to significantly influence the findings, as Egger’s tests did not detect significant funnel plot asymmetry for any of the cancer types.
Subgroup analyses were performed to examine the influence of publication year, continent, BMI adjustment, and other lifestyle factors (Table 3). For CRC, studies published before 2015 (n = 4) reported a stronger association with lamb consumption (RR = 1.25, 95% CI: 1.05–1.49) compared to those published after 2015 (n = 2; RR = 1.07, 95% CI: 0.96–1.19), though the latter estimate is limited by the small sample size. A similar trend was observed for CC, with pre-2015 studies (n = 3) demonstrating a significant association (RR = 1.33, 95% CI: 1.07–1.65). The correlation between lamb intake and CRC risk was more pronounced in studies that did not adjust for BMI (RR = 1.25, 95% CI: 1.05–1.49) compared to those that accounted for BMI (RR = 1.07, 95% CI: 0.96–1.19). Meta-regression analyses further suggested that BMI adjustment significantly influenced outcomes for CC (p = 0.0487); however, this finding is not robust due to the small number of studies (n = 4). For CRC and RC, no consistent modifying factors were identified.
Table 3 Stratified meta-analyses of lamb consumption and colorectal, colon, and rectal cancer risk
Comments (0)