
Remember me


The REZ in the literature is sometimes used as a synonym for CNS–PNS transitional zone (TZ), whereas in other publications the REZ is used to define the area where cranial nerves are attached to the brainstem with TZ included in this area [15, 26, 58, 84]. Here in this study, to avoid confusion, REZ refers to the later definition and is used to describe the MRI imaging findings. We used the term TZ to refer to the border between the CNS segment, where the nerve fibers are myelinated by oligodendrocytes, and the PNS segment, where the nerve fibers are myelinated by Schwann cells.
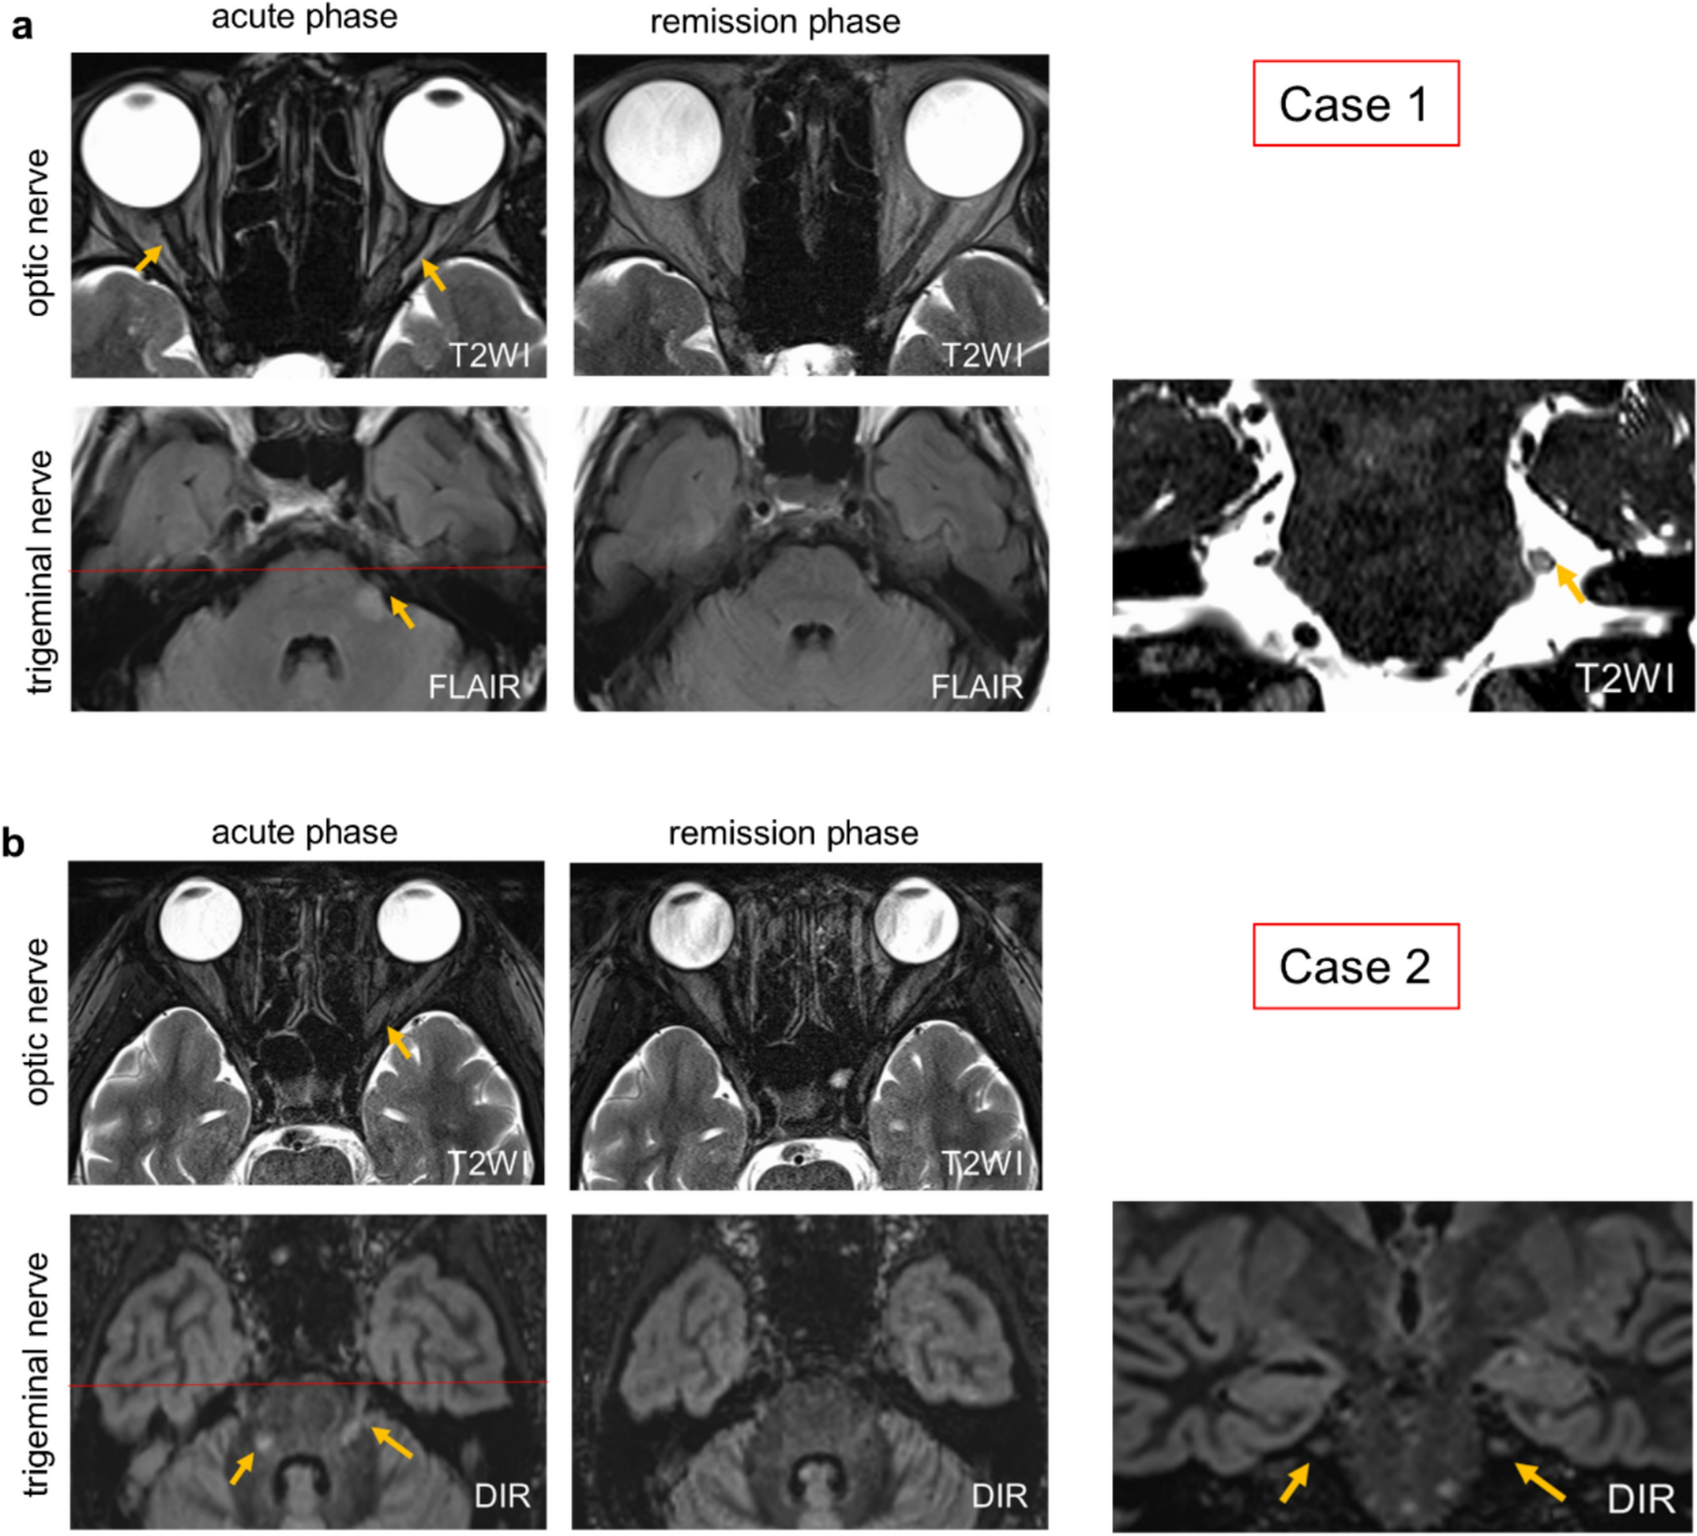
Case 1: an atypical inflammatory demyelinating caseA 70-year-old female developed hypoesthesia and an abnormal sensation in the left upper lip and cheek, which gradually extended over a day to involve the left forehead and periorbital region. Six days later, she experienced vision loss in her left eye over half a day, and on the ninth day, she woke up to complete blindness in her right eye. Brain MRI revealed bilateral optic nerve swelling with contrast enhancement and a lesion in the left intramedullary trigeminal tract at REZ with contrast enhancement (Fig. 1a, supplemental Fig. 1a, b). In addition, a periventricular lesion without contrast enhancement is observed (supplemental Fig. 1c). Both serum and cerebrospinal fluid were negative for aquaporin-4 (AQP4) antibodies (by ELISA and cell-based assay), and MOG antibodies were also negative (by cell-based assay). Cerebrospinal fluid analysis showed a cell count of 2/μL and elevated protein levels at 61.0 mg/dL. The IgG index was 0.59, and oligoclonal bands were negative. Myelin basic protein was markedly elevated, exceeding 2000 pg/mL. Due to the facts that this patient experienced only a single clinical episode and was of advanced age with an atypical periventricular lesion for MS, together with the above-mentioned laboratory findings, we consider this case as a neuroinflammatory demyelinating disease of undefined type. The symptoms improved with steroid pulse therapy, and imaging findings also showed partial resolution of the lesions. There were multiple discrete lesions on both optic nerves at the acute stage, extending from the cranial segment to the intra-orbital segment. The MRI lesion of the left trigeminal nerve at the acute stage extended from the root attachment point 3 mm distally before abruptly terminating. According to an early study [71], the TZ of human trigeminal nerve is located 3.0 mm away from the brainstem; therefore, we speculated that the trigeminal nerve lesion of this patient developed near the TZ.
Fig. 1
Two patients demonstrating both optic neuritis and trigeminal nerve lesions. a Axial T2 weighted images (T2W1) of the optic nerves showed bilateral hyperintensities (yellow arrows) at acute phase, which completely resolved at the remission phase in case 1 (a patient with inflammatory demyelinating disease of undefined type). Fluid attenuated inversion recovery (FLAIR) sequences showed a high signal intensity at the REZ of the left trigeminal nerve of this patient (yellow arrow) at acute phase, which partially resolved at remission phase. b Axial T2WI images showed a hyperintensity lesion of the left optic nerve at acute phase of case 2 (a MOGAD patient), which was nearly completely resolved at remission phase. The double inversion recovery (DIR) sequences showed bilateral lesions at the pons and the REZ of the trigeminal nerves that extended from the pons distally up to 4 mm. The trigeminal nerve lesions were partially resolved at remission phase. Coronal views (right panels) show the red scanned line corresponding to the axial view at the acute phase
Case 2: MOGAD patientA 13-year-old female developed worsening headaches, eye pain, and vision loss over several days. One month later, she experienced right lower limb weakness, gait disturbance, and decreased sensation on the left side of her tongue. Brain MRI revealed a longitudinally extensive high-intensity lesion in the left optic nerve (longitudinal length = 39 mm) (Fig. 1b). Bilateral trigeminal nerve lesions extended peripherally 4 mm beyond the pons. Serum MOG antibodies were positive. Her acute symptoms worsened despite steroid pulse therapy but improved with plasma exchange. The MRI signal abnormalities were partially resolved. Recurrences were successfully suppressed with steroids and immunosuppressants. Based on the MRI lesions location, we speculated that the trigeminal nerve lesions of this patient formed around or slightly beyond the TZ.
EAE mice present with a restricted CCR2+ cell infiltration at the TZ in trigeminal and cochlear nervesTo investigate if EAE mice present lesions at the TZ zone of cranial nerves, we induced active EAE with MOG35-55 peptide in double knock-in CCR2RFP x CX3CR1GFP mice [64]. This double-reporter mouse allows us to differentiate CNS resident macrophages (microglia and border-associated macrophages) from blood-borne monocyte-derived cells during EAE [42, 83]. At the peak stage of EAE, mice were perfused, and each of the cranium was decalcified. Sagittal cryosections were used to assess the trigeminal and cochlear nerves, whereas coronal sections were utilized to investigate the optic and olfactory nerves (Supplemental Fig. 2 a, b).
The TZ transition zone has also been reported to be equipped with fibrillary astrocytes [71], and the line of glia cell transition takes the form of a dome. This dome-shaped line of astrocyte foot processes is sometimes referred to as the glia limitans of the cranial nerves [55]. GFAP immunofluorescence staining for the astrocyte foot processes has been previously shown to mark the central to peripheral TZ at cranial nerves [32, 80]. Using GFAP staining we confirmed the previously described dome-shaped TZ. Contrary to an early study where microglia were not observed in the nerve trunk of human cadavers [71], we observed a dome-shaped line of CX3CR1+ microglia overlapping with the GFAP staining at the TZ of the trigeminal nerve and diffuse distribution of CX3CR1+ microglia within the cochlear nerve (Supplemental Fig. 3). Interestingly, sagittal sections of EAE mice assessed for trigeminal and cochlear nerves showed that CCR2+ cells were not evenly distributed along the nerve trunk. Instead, CCR2+ cells had largely accumulated at the surface of the nerve trunk proximal to the REZ, but across the nerve parenchyma only at the TZ, also forming a dome-shaped distribution pattern (Fig. 2a-d). Confocal images showed that CCR2+ cells were distributed not only on the CNS side of the dome-shaped astrocyte border but also on the peripheral segment near this border (Fig. 2b, d). These results indicate that the cranial nerve inflammatory lesions in this active EAE model resemble those seen by MRI in patients with inflammatory demyelinating diseases.
Fig. 2
Confined CCR2 + cell infiltration at the TZ of trigeminal and cochlear nerves in EAE mice. a No CCR2+ cells were apparent in naïve mice, but CCR2+ cells were preferentially associated with GFAP+ astrocyte foot processes at the TZ of the trigeminal nerve in EAE mice. Images are representative of n = 3 mice in each group. Tri-PNS, peripheral segment of the trigeminal nerve; Tri-CNS, CNS segment of the trigeminal nerve; InCi, interpeduncular cistern; BM, bone marrow. b Confocal images of the boxed area in a, showing the association of CCR2+ cells with the TZ marked by the dome-shaped line of GFAP+ astrocyte foot processes and CX3CR1+ microglia. c CCR2+ cells were not seen at the cochlear nerve in naïve mice, but CCR2+ cells were preferentially associated with GFAP+ astrocyte foot processes at the TZ of the cochlear nerve in EAE mice. Images are representative of n = 3 mice in each group. Cross-sections of the facial nerve (white arrows) are visible, with strong association of CCR2+ cells with the GFAP staining in the EAE mouse. Coc-CNS, the CNS segment of the cochlear nerve; ST, scala tympani; *, spiral ganglion; dotted lines, peripheral segment of the cochlear nerve bundles. d Confocal images of the boxed area in c, showing the association of CCR2+ cells with the TZ. The CX3CR1+ microglia were diffusely distributed, unlike the dome-shaped distribution seen at the TZ of the trigeminal nerve. ST, scala tympani
In addition, we observed CCR2+ cell accumulation inside the SAS near cranial nerves. For example, near the trigeminal nerve, CCR2+ cells were clearly accumulated inside the interpeduncular cistern which is a basal subarachnoid cistern located in the interpeduncular fossa, anterior to the pons (Fig. 2a). In addition, the scala tympani of the cochlea is known to be a fluid compartment that is connected to the SAS through the cochlear aqueduct. CCR2+ cells were found on the wall of the scala tympani of all EAE mice (Fig. 2c), but not in the naïve mice, strongly suggesting that CSF flow mediates immune cell infiltration into the cochlea.
EAE mice present with broad CCR2+ cell infiltration in optic and olfactory nervesNext, we performed GFAP staining on decalcified coronal sections to assess the optic and olfactory nerves. Previous studies have identified two areas in the mouse optic nerve where astrocytes are differentially organized. In the region of optic nerve head where ganglion cell axons are unmyelinated, the GFAP-labeled processes are particularly dense and are transversely oriented with respect to the long axis of the nerve, forming the so-called glial tubes to partite axon bundles [75, 76]. In the myelinated portion of the optic nerve, astrocytes exhibit various shapes, sizes and orientation [8, 9]. Using GFAP immunofluorescence staining, we confirmed these previous findings by revealing that astrocyte foot processes form two morphologically distinct structures between the optic nerve head and the remaining portion of the nerve. In parallel, CCR2+ cells were nearly devoid at the optic nerve head, where dense tubular astrocytic processes exist, but the remaining optic nerve section was inhabited by abundant CCR2+ cells (Fig. 3a). This result indicates that the optic nerve head in this EAE model is protected from CCR2+ immune cell infiltrates, which may be mediated by a physical barrier formed by the astrocytes processes.
Fig. 3
Widespread distribution of CCR2+ cells within the optic and olfactory nerves. a GFAP staining revealed two distinct patterns of astrocyte morphology between the intra-orbital portion and the optic nerve head. There was no clear difference between the naïve and the EAE mice in GFAP staining. Images are representative of n = 3 mice in each group. In EAE mice, CCR2+ cells were diffusively distributed within the intra-orbital segment, but were nearly devoid of the optic nerve head, where astrocytes form a dense network. *, optic nerve. b CCR2+ cells were abundantly accumulated between the two olfactory bulbs (OB), within the nerve fiber layer (NFL), where sparse GFAP labeling was seen. There were abundant GFAP+ astrocytes around the glomeruli of the olfactory bulb. Images are representative of n = 3 mice in each group
GFAP staining of the olfactory nerve bundles revealed sparse staining in the NFL, but strong staining around the glomeruli (Fig. 3b). In parallel, abundant CCR2+ were accumulated in the NFL, but not around the glomeruli. Pathways along the olfactory nerve bundles have been identified as a major CSF efflux route in the mouse [48, 61, 73, 85]. CCR2+ cell accumulation in this CSF-filled compartment is further evidence that the cranial nerve segment that is exposed to CSF flow is more susceptible to immune cell infiltration. It is likely that the lack of a glia barrier permits immune cell infiltration into this region.
Taken together, GFAP staining of the investigated cranial nerves supports the hypothesis that CSF may mediate immune cell distribution to the cranial nerves, and that astrocytes may provide a physical barrier to prevent immune cells infiltration into the cranial nerve parenchyma from the CSF space, as well as limiting their spread across the TZ of the nerve.
CCR2+ cells are highly accumulated at the segment of cranial nerves that is accessible to CSF flowTo further validate our hypothesis that CSF plays a role in disseminating CCR2+ immune cells into cranial nerves, we used 106-nm DiD-labeled liposomes as a CSF tracer, which has been shown to be optimal in assessing the CSF flow, as they do not enter the CNS parenchyma unless the glia limitans superficialis is severely damaged [83].
For the trigeminal nerve, 2 h post-i.c.v infusion, liposomes were found distributed along the CNS segment of the nerve trunk as far as to the peripheral segment where CCR2+ cells also reached their furthest point along the nerve trunk (Fig. 4a). Unlike CCR2+ cells that were also inside the nerve parenchyma, liposomes were not observed inside the nerve parenchyma and instead remained on the surface of the nerve. These observations indicate that while CSF flow may facilitate propagation of CCR2+ cells along the SAS of the cranial nerves, other mechanisms (e.g., chemokine-mediated cell infiltration) are likely involved in the entrance of CCR2+ cells into the nerve parenchyma [35]. Given that liposomes can access the peripheral nerve further than the dome-shaped glia limitans, we reason that this short section of the peripheral segment of trigeminal nerve may be a weak point for CCR2+ cell infiltration.
Fig. 4
CCR2+ cells largely accumulated at the CSF accessible segment of trigeminal and cochlear nerves during EAE. a Representative images (n = 3 mice in each group) show that liposomes distributed along the trigeminal nerve only slightly beyond the TZ toward the PNS in both naïve and EAE mice. CCR2+ cells were not visible at the PNS segment, where there is also no liposome distribution on the nerve surface. Tri, trigeminal nerve; InCi, interpeduncular cistern. b Representative images (n = 3 mice in each group) show that the liposome accessible segment of the cochlear nerve (Coc) presented with substantial infiltration of CCR2+ cells. Liposomes were visible in the cochlear aqueduct in the naïve and EAE mice, but CCR2+ cells were only found at this location in EAE mice. The basal scala tympani (ST) is directly connected with the cochlear aqueduct (#). CCR2+ cells were not seen in the spiral ganglia of the naïve mice, but were visible in some of the ganglia (*) in the EAE mice. c Confocal images of the blue box area in b. d Confocal images of the yellow box area in b
Regarding the cochlear nerve (Fig. 4b-d), liposomes seem to be largely accumulated at the entrance of the internal acoustic canal from the cochlea, where CCR2+ cells also had accumulated. CCR2/CX3CR1 double-positive cells were apparent in the spiral ganglia of EAE mice, but not in healthy mice. Nevertheless, as expected, liposomes spread through the cochlear aqueduct into the scala tympani. In EAE mice, numerous CCR2+ cells, positive for liposomes, were found inside the cochlear aqueduct and on the wall inside the scala tympani. These observations support the hypothesis that CSF flow may contribute to the spreading of immune cells into the inner ear through the cochlear aqueduct.
Optic nerves have been shown to be encased in the SAS throughout their length up until the sclera in mice [45]. As expected, the liposomes spread along the optic nerve up to this point (Fig. 5a, b), where they form a cuff-like distribution. CCR2+ cells were not found in the intra-ocular segment, where liposomes were also absent. However, numerous CCR2+ cells were found inside the parenchyma of the remaining portion of the optic nerve, where liposomes were distributed along the nerve surface.
Fig. 5
The CSF accessible portion of the optic and olfactory nerves are heavily infiltrated with the CCR2+ cells during EAE. a-b Representative images (n = 3 mice in each group) showing widespread distribution of CCR2+ cells in the intra-orbital segment of the optic nerve, in contrast to the lack of CCR2+ infiltrates in the intra-ocular segments (white arrow) of the optic nerve. Liposomes were around the optic nerve at the intra-orbital segment, accumulated around the sclera (*), but no liposomes were seen around the intra-ocular segment of the optic nerve (white arrow). c Representative images (n = 3 mice in each group) of the colocalization of CCR2+ cells with liposomes within the NFL between the two olfactory bulbs (OB) during EAE. A confocal image from the blue box area is shown on the right
Olfactory nerves have been shown by multiple studies to be enclosed by a discontinuous arachnoid barrier layer, providing a potential mechanism for CSF to “leak” into the NFL [31, 73]. There was substantial colocalization of CCR2+ and liposomes at the NFL of the olfactory nerves (Fig. 5c), but once the olfactory nerve bundles pass through the cribriform plate, CCR2+ were only occasionally found around the nerve bundles in the nasal submucosa.
To further support our hypothesis that the CCR2+ cells infiltrated into the cranial nerves are largely originated from the SAS, we checked multiple SAS cisterns in the EAE mice, found that abundant CCR2+ cells colocalized with liposomes (Supplemental Fig. 4). In summary, the i.c.v-infused liposomes are significantly colocalized with CCR2+ cells within the SAS. During EAE, the cranial nerve segments that are accessible to liposomes are also inhabited with abundant CCR2+ infiltrates.
Differential arachnoid coverage among cranial nervesPrevious studies of the leptomeninges have shown that the outer cell layer of the arachnoid (also known as the arachnoid barrier layer) expresses the adherens junction protein E-cadherin; therefore, this marker is used to indicate the outer border of the SAS [16, 50, 60]. The proposal of a so-called Prox1+ SLYM layer has evoked discussion and disagreement among researchers [50, 53, 60]. Some researchers referred to this Prox1+ layer as a fourth layer of meninges forming a barrier between an inner and outer SAS, while others provided evidence that this is the inner arachnoid layer directly adjacent to the E-cadherin+ barrier layer. Consequently, we performed E-cadherin staining on decalcified cranial tissue sections of the Prox1-GFP reporter mice that were i.c.v infused with liposomes. We speculated that liposomes would stop spreading along the nerve trunk at the point where the arachnoid barrier layer terminates on the nerve.
Interestingly, E-cadherin staining on the trigeminal nerve revealed an arachnoid cul-de-sac around the nerve before the ganglion (Supplemental Fig. 5a). No spreading of the liposomes was detected beyond this point toward the peripheral segment of the trigeminal nerve (Fig. 6a). The Prox1+ layer was immediately adjacent to the E-cadherin layer at the basal surface of the brain. At the point where the trigeminal nerves emerge from the pons, both layers reflect off the brain surface to form the interpeduncular cistern. The Prox1+ and E-cadherin+ layers then together form the outer boundary of a sheath around the trigeminal nerve that ends in the cul-de-sac. This observation indicates that similar to the surface of the brain, Prox1 marks the inner arachnoid layer, instead of a lymphatic-like fourth layer of meninges around the trigeminal nerve as suggested [37]
Fig. 6
Trigeminal and cochlear nerves are only partially accessible to CSF. a Representative images showing that the Prox1+ inner arachnoid layer (arrowhead) is closely associated with the E-cadherin+ arachnoid barrier layer, which lines the basal brain and forms a SAS around the trigeminal nerve (Tri). Both arachnoid layers end at the point (blue arrows) where the distribution of CSF-injected liposomes also terminate. #, dura mater. b Representative images showing that the Prox1+ inner arachnoid layer (arrowhead) is closely associated with the E-cadherin+ arachnoid barrier layer around the facial nerve (*) and the cochlear nerve (Coc) to form a SAS that liposomes could also access. c Confocal images of the area between the two red arrows shown in b. The Prox1+ and E-cadherin+ layers are interrupted at the point where the cochlear nerve bundles pass through the bony labyrinth (BL) to reach the spiral ganglia (SG). Liposomes were visible between the nerve bundles. d Confocal images of the area between the two yellow arrows shown in b. Prox1+ and E-cadherin+ layers are interrupted at the point where two cochlear nerve bundles merge into the trunk of the cochlear nerve. e Representative images showing discontinuous E-cadherin+ layer and the lack of the Prox1+ layer (between the yellow arrowheads and between the orange yellow arrowheads) where olfactory nerve bundles pass through the cribriform plate (CP). Liposomes were visible on both side of the CP. Prox1+ lymphatic vessels (white arrows) closely associated with the CP are visible. Images are representative of n = 4 naïve mice
Similarly, there was also a Prox1+ layer directly adjacent to the E-cadherin+ layer around the cochlear nerve (Fig. 6b). Surprisingly, where the cochlear nerve bundles originating from the spiral ganglion pass through the bony labyrinth of the cochlear to merge into the cochlear nerve trunk, the E-cadherin+ layer is discontinuous (Fig. 6c, d), which microscopically looks similar to the olfactory nerve bundles when they pass through the cribriform plate (Fig. 6e). In some tissue sections, we indeed observed that liposomes spread into the cochlear nerve bundles and spiral ganglion, indicating that the CSF from the SAS of the cochlear nerve can enter the cochlea (Fig. 6c, d). Nevertheless, different from the olfactory nerve bundles, which are surrounded by a rich network of lymphatic vessels both above and below the cribriform plate (Fig. 6e), we did not observe Prox1+ lymphatic vessels near the cochlear nerve or trigeminal nerve.
E-cadherin+ arachnoid layer remains morphologically unchanged during EAENext, we compared E-cadherin staining around cranial nerves in naïve and EAE mice (Supplemental Figs. 6 and 7), to check if the arachnoid barrier is disrupted during EAE to allow immune cells to spread to the surrounding tissue. For all the investigated cranial nerves (trigeminal, cochlear, optic, and olfactory nerves), we did not observe any morphological differences between the naïve and EAE group based on the staining of E-cadherin. Consistent with the above-mentioned CSF tracer study, the CCR2+ cells were found in the spiral ganglia and below the cribriform plate likely due to the discontinuity of the arachnoid barrier layer. Another note of interest is that abundant CCR2+ cells were found within the periorbital fat tissue beyond the E-cadherin+ arachnoid barrier layer, even though the E-cadherin staining did not reveal any differences between the naïve and EAE mice (Supplemental Fig. 7a). This is consistent with clinical MRI observations [11, 68] that MOGAD patients often present with characteristic lesions in the peribulbar fat (also referred to as perineural enhancement). At this stage, we cannot rule out the possibility that the arachnoid barrier layer does not form a barrier at the optic nerve head, which may allow immune cells within the nerve sheath to access the surrounding tissue.
CCR2+ cells at the TZ were significantly reduced at chronic stagePrevious studies have suggested that the lymphatic vessels near the cribriform plate are important for immune cell migration out of the CNS during neuroinflammation [31]. We found Iba1+ macrophages inside Prox1+ cribriform plate lymphatic vessels in naïve mice, while CCR2+ cells were found inside LYVE1+ lymphatic vessels in EAE mice (Supplemental Fig. 8). At chronic EAE, the CCR2+ cells appeared to have reduced numbers above the cribriform plate; however, this decrease did not reach a significant difference from the levels seen at peak disease (Fig. 7 a, b). Both trigeminal and cochlear nerves showed a significant reduction of CCR2+ cells on the CNS and PNS side at chronic EAE (Fig. 7c–f). Since we did not find lymphatic vessels near the TZ of cochlea and trigeminal nerves, lymphatic vessel-mediated migration of immune cells along these nerves out of the CNS is currently debatable.
Fig. 7
Decreased CCR2+ cells around the trigeminal and cochlear nerves during the chronic stage of EAE. a, b Representative images and quantification showing the levels of CCR2+ infiltratesabove the cribriform plate (Cfp) at EAE peak and chronic stage. c, d Representative images and quantification comparing CCR2+ cells on the CNS side (Tri-CNS) and the PNS side (Tri-PNS) of the trigeminal nerve at EAE peak and chronic stage. It should be noted that at EAE chronic stage, numerous CCR2+ cells had accumulated within the subarachnoid space (arrow). #, dura mater; *, arachnoid mater. e, f Images and quantification comparing CCR2+ cells on the CNS side (Coc-CNS) and the PNS side (Coc-PNS) of the cochlear nerve at EAE peak and chronic stage. g Confocal images showing that at the EAE chronic stage, CCR2+ cells accumulations were present in GFAP-negative cavities. h A representative confocal image showing the engulfment of CCR2+ cell by CX3CR1+ microglia. Quantifications are performed from n = 3 mice in each group, 14–17 tissue sections/mouse
Furthermore, with the significantly reduced number of CCR2+ infiltrates, confocal imaging showed “black holes” within the fibrillary branches of astrocytes. Interestingly, CCR2+ cells were found in these holes in the cochlear nerves of 3 out 3 EAE mice (Fig. 7g). This phenomenon was only observed in one of the 3 mice for the trigeminal nerves. Activated microglia have been previously shown to phagocytose dying and apoptotic cells neurons and oligodendrocytes [27, 56, 57]. However, it is still unclear whether CX3CR1+ microglia are capable of phagocytosing CCR2+ cells during neuroinflammation. We indeed observed microglia engulfment of CCR2+ cells inside the cochlear nerves (Fig. 7h).
Based on these results, while we cannot rule out a role for cribriform plate lymphatics in the drainage of CCR2+ cells from the SAS, the mechanism for CCR2+ immune cell resolution at the EAE chronic stage for trigeminal and cochlear nerves remains to be elucidated.
Graphical summaryThe key histopathological findings of the trigeminal, cochlear, olfactory, and trigeminal nerves from the EAE mice at peak disease are summarized schematically (Fig. 8), highlighting the CCR2+ infiltrates, SAS, the differential arrangement of inner and external arachnoid matter, glia limitans marked by GFAP+ astrocyte foot processes for trigeminal and cochlear nerves, as well as specially arranged/distributed GFAP+ astrocytes in optic nerve and olfactory nerves and the distribution of CX3CR1+ microglia.
Fig. 8
Comments (0)