
Remember me

The initial step involved determining the minimum inhibitory concentrations (MICs) of CARV to evaluate their intrinsic antimicrobial activity. This allowed us to subsequently assess potential synergistic interactions with antibiotics by calculating the fractional inhibitory concentration index (FICI), a quantitative metric of combined antimicrobial efficacy.
Table 2 displays the MIC and the FICI values for CARV in combination with various antibiotics across a range of bacterial species. MIC values for CARV alone ranged from 125 to 500 µg/mL, with S. enterica being the most susceptible (MIC = 125 µg/mL) and E. coli the most resistant (MIC = 500 µg/mL), indicating moderate to low intrinsic antimicrobial activity. Notably, SACs (defined by FICI ≤ 0.5, highlighted in grey) were observed against A. baumannii and S. aureus. In the case of A. baumannii, three SACs were detected (with CHL, GEN, and STM), achieving up to 16-fold reductions in ABX MICs. For S. aureus, synergy was observed with GEN and STM, also reducing MICs by fourfold. In contrast, combinations with other bacterial species generally resulted in FICI values ≥ 1, suggesting additive or indifferent effects.
When compared with the SACs identified for THY in our previous study (end of Table 2) [22], both similarities and differences in synergy patterns were observed. Although THY and CARV are structural isomers, they exhibited distinct synergistic profiles. For A. baumannii (Fig. 1a), both THY and CARV showed synergy with CHL, but only CARV demonstrated additional synergy with GEN and STM. For S. aureus (Fig. 1b), both THY and CARV show synergy with GEN and STM. These combinations have recently begun to receive significant attention, as they also appear effective against resistant bacteria isolated from patients. A very recent study investigated the essential oil of Lippia origanoides and its main components (including CARV), reporting a FICI of 0.375 for the combination of GEN with CARV against multidrug-resistant A. baumannii strains [37]. Another recent study [38] examined the effects of CARV on MRSA strains of S. aureus in combination with GEN and STM, reporting FICI values within ranges comparable to our findings (see Table 2).
Fig. 1
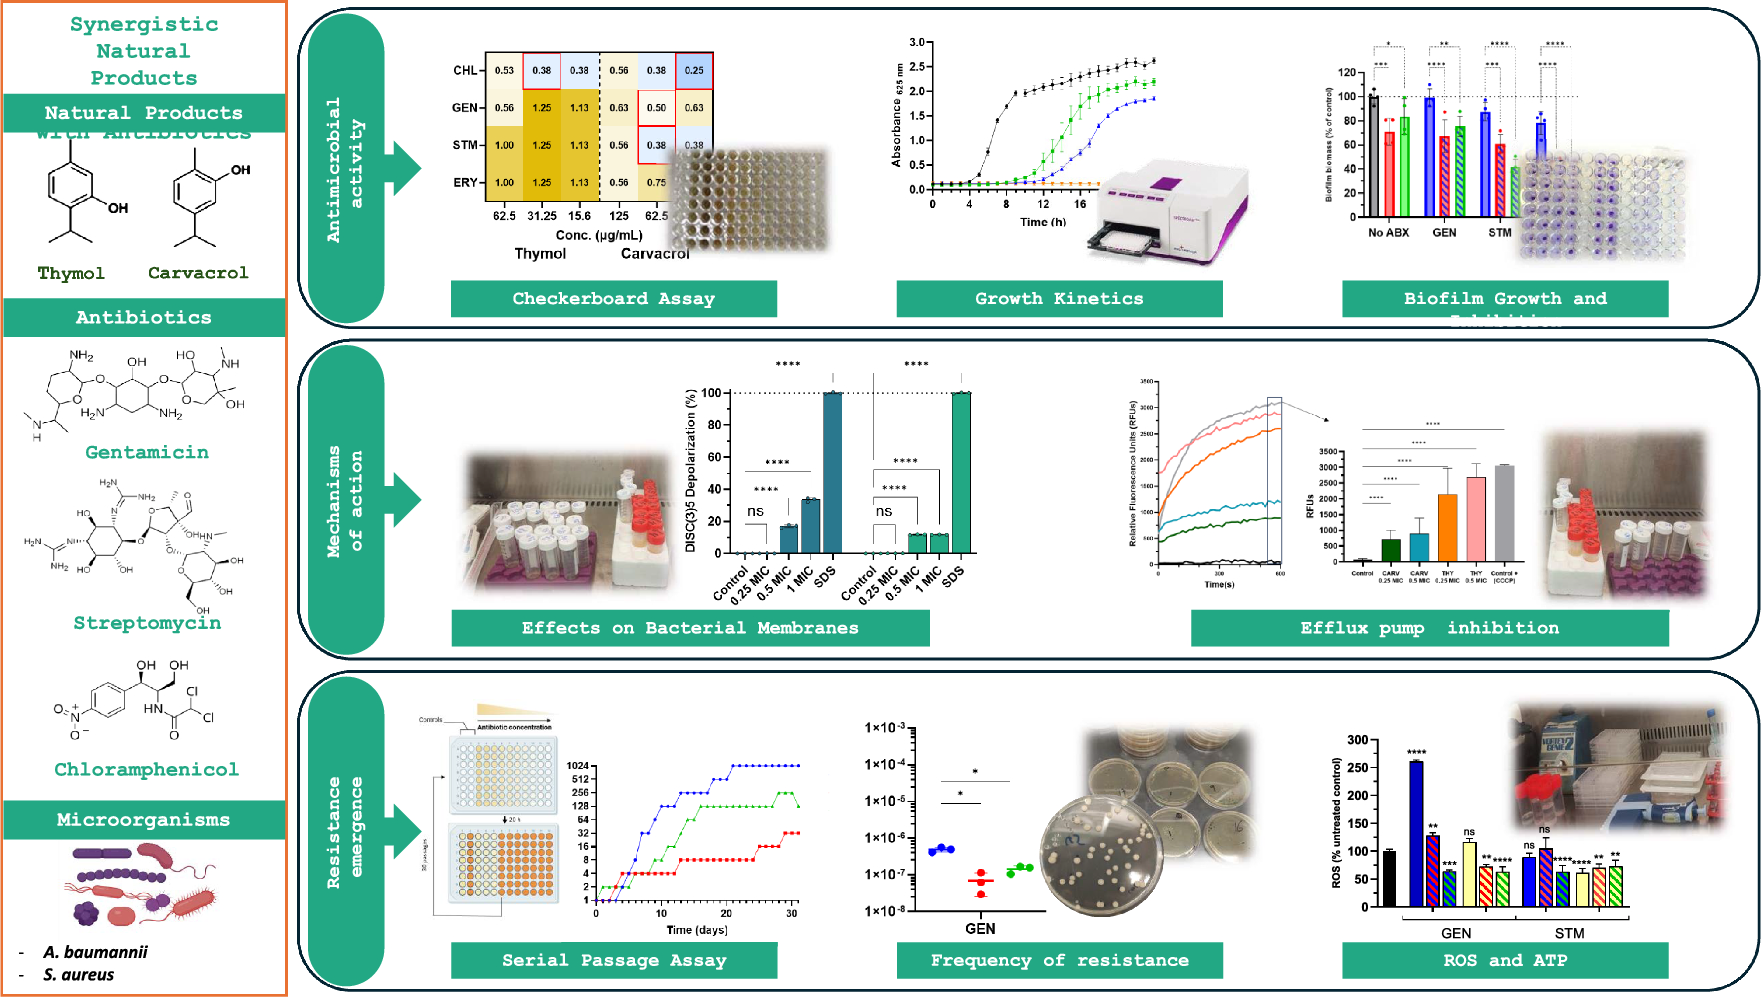
Heatmap plots of the Fractional Inhibitory Concentration Index (FICI) for combinations of thymol (THY) and carvacrol (CARV) with four antibiotics against (a) A. baumannii and (b) S. aureus. THY and CARV were tested at three subinhibitory concentrations (0.5×, 0.25×, and 0.125× MIC), indicated at the base of each heatmap as “conc.” (concentration, in µg/mL). Each square displays the corresponding FICI value, calculated using the checkerboard microdilution method. For each combination, FICI values were determined across a two-dimensional matrix of concentration pairs, and the values shown represent those that produced the greatest reduction in antibiotic concentration. Combinations exhibiting the strongest synergy—i.e., the greatest MIC reduction—are outlined in red and were selected for further analysis. The color gradient represents increasing FICI values, ranging from blue (synergy) to yellow (no interaction). A FICI ≤ 0.5 denotes synergistic interaction
The fact that the antibiotics involved in the observed synergies—CHL, STM, and GEN—primarily target intracellular components supports further mechanistic investigations into how natural compounds such as CARV and THY may facilitate antibiotic uptake or retention within bacterial cells.
3.1.2 Growth kinetics testsWhile MIC values provide a static snapshot of bacterial susceptibility at a fixed endpoint, growth kinetics offer a dynamic perspective on antimicrobial activity over time. Moreover, this approach allowed the observation of not only complete growth inhibition but also potential sublethal effects.
Figure 2 shows the growth kinetics of A. baumannii and S. aureus exposed to the five SACs of CARV, as well as to ABXs and CARV individually, each at the subMIC concentrations used in the checkerboard test. The kinetic profiles reflect the effect of each treatment on bacterial population dynamics. For a more detailed characterization of the growth kinetic profiles, Cmax, r and Tm50 values are presented in a table below the graphs. The ABXs at synergistic concentration have a greater impact on Cmax than CARV, though r values are generally similar across treatments, except for CHL, which has a slower effect compared to CARV. The synergy curves consistently show complete growth inhibition.
Fig. 2
Growth kinetics of A. baumannii (a–c) and S. aureus (d, e) treated with carvacrol (CARV), individual antibiotics (ABXs), and their synergistic combinations at subinhibitory concentrations. Tables below each plot report kinetic parameters: maximum population density (Cmax), growth rate (r), and Tm50 values for each curve. Error bars indicate standard deviations (n = 4). Panels f, g show the relative effects of subinhibitory concentrations of thymol (THY) and CARV on the kinetic parameters of A. baumannii and S. aureus, expressed as percentage differences from the control. THY data in these panels were sourced from Gan et al. 2023 [22] and are included here to enable direct comparison with CARV. Statistical significance was assessed using two-way ANOVA (****p < 0.0001, ***p < 0.001, **p < 0.01, *p < 0.05, ns = not significant)
Figure 2f and g provide a comparison of the relative effects of THY and CARV on two key kinetic parameters—maximum population density (Cmax) and growth rate (r). These comparisons provide insight into sublethal inhibitory effects that are not captured by MIC alone. The data for THY shown in panels f and g were extracted from a previous study [22] and are presented to enable a direct comparison with the new results obtained for CARV.
In S. aureus (panel g), THY demonstrates significantly stronger inhibitory activity than CARV. THY significantly reduces Cmax at both 0.25 and 0.5 MIC, and causes a sharp decrease in r at both concentrations. In contrast, CARV only reduces Cmax at 0.5 MIC, but consistently decreases the growth rate across all three subinhibitory concentrations tested (0.125, 0.25, and 0.5 MIC). In A. baumannii (panel f), CARV has minimal to no measurable impact on either Cmax or r at any of the subinhibitory concentrations, in line with the kinetic profiles observed in panels 2a–c. THY significantly reduces both Cmax and r (at 0.5 MIC), indicating strong inhibitory effects.
3.1.3 Antimicrobial effect of SACS in biofilm biomassA bacterial biofilm is a community of bacteria that adhere to a surface and are encased in an extracellular matrix, typically composed of a mixture of polysaccharides, proteins, and extracellular DNA (eDNA) [39]. Biofilm formation is regulated by quorum sensing (QS), a cell-to-cell communication mechanism that synchronizes gene expression in response to population density [40]. This structure provides a physical barrier formed by the extracellular matrix, which hinders the penetration of antimicrobials to the bacteria within [41]. Moreover, bacteria within the biofilm are often in a metabolically slower state, reducing the efficacy of ABXs that rely on active processes, such as protein synthesis.
Biofilm formation is a major factor contributing to antibiotic resistance and the persistence of infections, as these structured bacterial communities are significantly more difficult to eradicate than their planktonic counterparts.
Consequently, the antimicrobial efficacy of SACs should be evaluated not only against planktonic cells but also against biofilms, to assess their ability to both prevent biofilm formation and disrupt mature biofilms formed by A. baumannii and S. aureus.
Our results demonstrate that SACs of THY and CARV with ABXs are effective in both inhibiting biomass production and destroying preformed biofilms biomass. Figure 3 shows that certain SACs of ABXs with CARV or THY significantly reduced biofilm biomass production and effectively reduced the biomass of established biofilms, compared to ABXs and natural products alone. In A. baumannii, combinations of CARV with CHL reduced preformed biofilm biomass by up to 80%, compared to less than 30% achieved by CHL alone. In S. aureus, most combinations were more effective than ABXs alone, reaching biomass reductions of up to 70%, compared to about 40% with ABXs alone.
Fig. 3
Effect of antibiotics (ABXs) alone and in combination with carvacrol (CARV) or thymol (THY) at 0.25 MIC on biofilm biomass formation and eradication in A. baumannii and S. aureus. Panels (a, c) show the biofilm biomass production (biofilm inhibition), while panels (b, d) show the eradication of preformed biofilm biomass (disruption of mature biofilms). Biofilm biomass was quantified using the crystal violet assay and is expressed as a percentage relative to the untreated control (set at 100%), representing the total biomass under each assay condition. Data are presented as mean ± standard deviation from four independent experiments. Statistical significance was determined by two-way ANOVA (****p < 0.0001, ***p < 0.001, **p < 0.01, *p < 0.05, ns = not significant)
Previous studies have shown the efficacy of CARV and THY alone against S. aureus [42,43,44] and A. baumannii biofilms [45, 46]. Notably, some A. baumannii isolates from patients also showed significant biofilm inhibition with THY and CARV exposure [37]. A recent study [38] also investigated the effect of biofilm destruction in S. aureus exposed to a combination of CARV and GEN, with results very similar to ours (about 70% destruction). However, in their study, the combination of CARV and STM showed only 21.7% destruction, which yields approximately 55% biofilm destruction in our case. This discrepancy may be due to differences in the S. aureus strain used and methodological variations (Fig. 3d, green bars).
Different mechanisms may underlie the effects of natural products in biofilms compared to planktonic bacteria due to the unique characteristics of biofilms. For example, studies have reported that CARV can affect S. aureus biofilms, by potentially reducing the production of key biofilm-associated components, including extracellular polysaccharides, polysaccharide intercellular adhesin, and extracellular DNA, which would decrease biofilm density and adhesion [47]. Additionally, CARV inhibits biofilm resistance genes such as sarA and icaA, in this bacterium [43]. Another possible mechanism would be the inhibition of intercellular communication (QS), critical for biofilm formation and maintenance. By disrupting QS, the biofilm's collective resistance is weakened, increasing its susceptibility to ABXs. Other authors have demonstrated that CARV inhibits violacein and chitinase production, key QS signals in Chromobacterium violaceum biofilms [48]. Other proposed mechanism is reduced twitching motility due to type IV pili inhibition by THY and CARV in A. baumannii [45]. Numerous studies have also highlighted that the inhibition of efflux pumps in A. baumannii strains can also impact their biofilm-forming ability [49,50,51]. These pumps regulate biofilm-associated genes and actively expel QS autoinducers, antimicrobials, and metabolic intermediates, influencing QS regulation and biofilm development [52]. This activity directly and indirectly influences biofilm formation and QS regulation.
3.2 Mechanisms of action of carvacrol and thymolWhile the mechanisms of the antibiotics are well-established, understanding the contribution of natural compounds is essential for elucidating the overall mechanism of SACs. GEN and STM, aminoglycosides with broad-spectrum activity, target the 30S ribosomal subunit but differ in binding sites and effects on translation [53, 54]. CHL, an amphenicol, inhibits the 50S subunit’s peptidyl transferase, blocking peptide elongation [55]. Since all the antibiotics that exhibited synergy act intracellularly, their enhanced efficacy likely depends on increased cellular uptake or reduced efflux. To further explore how CARV and THY enhance antibiotic efficacy in SACs, we examined their impact on bacterial membranes and efflux pumps, two critical targets of natural antimicrobials that play essential roles in bacterial resistance and survival.
3.2.1 Interaction with bacterial membranesThe potential of THY and CARV to compromise bacterial envelope integrity, thereby facilitating antibiotic uptake, a critical step for the intracellular activity of GEN, STM, and CHL, was investigated by evaluating their effects on membrane potential and permeability in both species.
Figure 4 illustrates the effects of THY and CARV on membrane integrity. For A. baumannii (Fig. 4a–c), THY induced significant membrane depolarization at MIC or lower (Fig. 4a), while CARV showed no substantial effect on membrane potential. Both natural products disrupted the cellular membrane at MIC, with CARV showing a significantly stronger effect (ANOVA, p < 0.0001; Fig. 4b). Outer membrane of A. baumannii (Fig. 4c) was affected by both compounds at 0.5 and 1 MIC. In S. aureus (Fig. 4d, e), THY and CARV caused significant depolarization at their MIC and 0.5 MIC (Fig. 4d), with THY producing a higher depolarization at both concentrations (ANOVA, p < 0.0001). Regarding membrane disruption, both compounds induced substantial permeabilization at MIC (Fig. 4e), with CARV showing a significantly stronger effect (ANOVA, p < 0.0001).
Fig. 4
Effect of thymol and carvacrol on membrane of A. baumannii (a–c) and S. aureus (d, e). Membrane assays include: (a, d) DiSC(3)5 depolarization (expressed as % of positive control (SDS)), (b, e) inner membrane permeabilization measured by propidium iodide (PI) accumulation (expressed as % of positive control (alexidine)); and c outer membrane permeabilization measured by 1-N-phenylnaphthylamine (NPN) uptake (expressed as % of positive control (alexidine)). Statistical significance was determined by two-way ANOVA *P < 0.05; **P < 0.01; ***P < 0.001; ****P < 0.0001; ns = not significant. Error bars represent standard deviations
These findings suggest that THY and CARV disrupt membrane integrity in both Gram-positive and Gram-negative bacteria, although their efficiencies differ. The observed actions can be attributed to the physicochemical properties of these natural products. Both CARV and THY are small molecules, with a molecular weight of 150.22 g/mol. Additionally, they are highly lipophilic, with Log Kow values of 3.43 and 3.30, respectively. These properties facilitate their diffusion through lipid membranes and allow them to embed easily into the phospholipid bilayer of bacterial membranes, altering the membrane's structure and affecting ionic gradients responsible for the membrane potential. Their lipophilicity promotes accumulation in the hydrophobic regions of the membrane, leading to destabilizing effects at the molecular level that can disrupt charge distribution or impair ion pumps and channels. This results in the leakage of protons and cations (K⁺ and Na⁺), contributing to membrane depolarization. Aminoglycosides, such as GEN and STM, activity rely significantly on active uptake into bacterial cells. This process is slow and depends on the bacterial membrane's electrochemical gradient. This gradient facilitates the active transport of aminoglycosides through specific channels or via facilitated diffusion [56]. The depolarizing effect induced by THY and CARV may facilitate aminoglycoside entry by increasing membrane permeability, thereby improving their intracellular access and enhancing their efficacy [15].
Moreover, both compounds are weak acids with a pKa of ~ 10.5, predominantly existing in a neutral form at physiological pH, facilitating membrane penetration. The phenolic hydroxyl group enables specific interactions with membrane lipids and transmembrane proteins, leading to the disruption of their structural integrity. This disruption causes the leakage of essential solutes and the entry of external substances, ultimately destabilizing the microorganism and potentially resulting in cell lysis. Indeed, our findings confirm that both THY and CARV can damage the cellular membrane of A. baumannii and S. aureus, as well as the outer membrane of A. baumannii's cell wall at MIC concentrations. The structural differences between the Gram-positive cell wall of S. aureus and the Gram-negative wall of A. baumannii do not seem to hinder the effectiveness of both natural products, as both at MIC concentration, are able to disrupt the outer membrane of A. baumannii (Fig. 4c), penetrating the thin peptidoglycan layer to also affect the inner membrane (Fig. 4b). The minor differences between the compounds may stem from the higher hydrophobicity of CARV compared to THY, which facilitates its penetration through the bacterial membrane [57]. However, as this effect appears to occur only at high concentrations, it may explain their direct antimicrobial activity, but the synergistic effect with antibiotics does not seem to rely on this mechanism.
Our results align with microscopy studies showing that S. aureus exposed to CAR and THY, revealed deformed cells with projections of cellular material [58, 59], and alterations in membrane fatty acid profiles [57, 59], further affecting pH homeostasis and the equilibrium of inorganic ions [60]. Consistent with a previous study [61] that used a similar technique to determine that the membrane integrity of S. aureus ATCC 25923 treated with CARV at half of the MIC, a 50% disruption was observed, compared to the 24.3% observed in our study. The discrepancies may be due to slightly different technique and the different ATTC strain. Furthermore, we tested a broader range of CARV MICs (from 0.125 to 1 MIC), which allowed us to observe a progressive increase in membrane disruption, reaching over 100%. Other techniques for detecting cell membrane damage, such as the detection of the endogenous β-galactosidase enzyme, also revealed that CARV is capable of disrupting the membrane of S. aureus [59]. Studies also confirm THY's ability to damage bacterial membranes. For instance, Li et al. observed that, in S. aureus, after 6 h of exposure to 500 μg/mL, the rate of cell membrane damage increased from 0.26 to 7.82% [62]. THY also disrupts membranes in Salmonella typhimurium, E. coli, and Bacillus subtilis [63, 64].
3.2.2 Efflux pump assayGiven the critical role of efflux pumps in multidrug resistance and biofilm development, assessing their inhibition is essential for understanding the mechanism of action of antimicrobial agents. Therefore, the potential of THY and CARV to interfere with these systems was evaluated, as their inhibition could enhance intracellular antibiotic accumulation and restore ABX efficacy.
Figure 5 presents the active efflux kinetics of ethidium bromide (EtBr) in A. baumannii exposed to THY and CARV. Acute exposure to THY, at 0.5 and 0.25 MIC, significantly inhibited the efflux pumps, as evidenced by a substantial increase in intracellular EtBr fluorescence (Fig. 5a). CARV showed no significant effect under the same conditions. However, after 6 h pre-exposure (Fig. 5b), both compounds significantly inhibited efflux pump activity. THY maintained strong inhibition, while CARV showed a delayed but significant effect, suggesting that CARV requires extended exposure to interact effectively with efflux systems.
Fig. 5
Active efflux kinetics of ethidium bromide in A. baumannii under two conditions: a acute exposure to two concentrations of thymol (THY) and carvacrol (CARV), and b pre-exposure of A. baumannii to the compounds for 6 h. Results are measured as relative fluorescence units (RFUs). Carbonyl cyanide m-chlorophenyl hydrazone (CCCP) was used as the positive control. Statistical significance was determined by two-way ANOVA: ****P < 0.0001. Error bars represent standard deviations
Our results support the hypothesis that THY and CARV act as efflux pump inhibitors at sub-MIC concentrations, increasing intracellular ABX accumulation thus enhancing its efficacy. Similarly, other studies have shown that THY and CARV inhibit efflux pumps in S. aureus strains [65, 66]. This mechanism has also been proposed as a reason why THY and CARV enhance the activity of ABXs such as tetracycline against S. aureus [67].
Although THY and CARV are isomers, their antimicrobial activity differs due to variations in functional group positioning, polarity, and membrane interactions. Both compounds have a phenolic hydroxyl group (−OH), but in CARV, the -OH is in the ortho position relative to the methyl group, while in THY, it is in the para position [68, 69]. These structural differences may affect how they interact with molecular targets [70].
Considering all the results, the direct antimicrobial activity of THY and CARV is likely linked to their ability to disrupt bacterial membranes. However, the adjuvant activity may instead result from their effects on membrane depolarization (in some cases) and efflux pump inhibition, allowing ABXs that rely on intracellular entry for their action to penetrate more easily and at higher concentrations.
3.3 Effectiveness of synergistic combinations of thymol and carvacrol in preventing antibiotic resistanceGiven the rise of MDR pathogens, it's essential to assess whether THY and CARV, beyond their potential synergistic antimicrobial effects, could also act as protective agents capable of reducing or preventing the development of antibiotic resistance by limiting bacterial adaptation in S. aureus and A. baumannii, both under prolonged exposure and short-term treatment.
Both A. baumannii and S. aureus are urgent threats that require immediate intervention to curb resistance development. A. baumannii, prevalent in hospital settings, causes severe infections like ventilator-associated pneumonia, wound infections, bacteremia, and urinary tract infections, with high mortality rates in critically ill patients. Different strains employ multiple mechanisms, such as efflux pumps and carbapenemases to resist even last-resort ABXs like carbapenems. Similarly, S. aureus causes infections ranging from superficial skin conditions to severe illnesses like pneumonia and bacteremia, with methicillin-resistant strains (MRSA) limiting therapeutic options and increasing mortality rates.
While serial passage and frequency selection assays provide complementary insights into the long- and short-term dynamics of resistance emergence, ROS accumulation, and ATP quantification offer mechanistic understanding of the physiological stress and metabolic disruptions induced by the treatments. Together, these approaches enable a comprehensive evaluation of both the evolutionary and cellular responses to SACs.
3.3.1 Resistance selection by serial passageFigure 6 shows resistance development in A. baumannii and S. aureus when exposed to ABXs, natural products, and SACs. Natural products alone did not cause significant resistance (Fig. 6d, g), whereas ABXs alone led to rapid MIC increase. A. baumannii exhibited a 1024-fold MIC increase for GEN and 512-fold for STM (Fig. 6b, c, blue line). In S. aureus, GEN MIC increased 128-fold, and STM resistance rose 2048-fold (Fig. 6e, f). SACs with THY (red line) limited MIC increases in A. baumannii to 32-fold for both aminoglycosides, while CARV (green line) was less effective. In S. aureus, THY mitigated GTM resistance to an eightfold MIC ratio increase and mitigated STM resistance to 128-fold increase, with CARV showing similar but slightly weaker effects. CHL induced slower resistance in A. baumannii, likely due to a different mechanism (Fig. 6a), with THY and CARV only delaying resistance.
Fig. 6
Effect of antibiotics (ABXs) and natural compounds on resistance selection (Serial passage) in A. baumannii (a–d) and S. aureus (e–g). a–c and e, f illustrate the evolution of MICs for ABXs alone or in combination with thymol (THY) or carvacrol (CARV). d and g show the MIC progression for THY and CARV alone. MIC₀ represents the initial MIC value at the beginning of the experiment, and MICₙ indicates the MIC measured after n days of exposure. The MIC ratio (MICₙ/MIC₀) reflects the fold increase in resistance relative to baseline and provides a quantitative measure of resistance development over time. Higher ratios indicate greater degree of resistance selection
3.3.2 Frequency of resistance (FoR)FoR to ABXs was also assessed in A. baumannii and S. aureus treated with ABXs alone and combined with sub-MIC of THY or CARV (Fig. 7). The only significant reduction in resistance was observed in the combinations with GTM against S. aureus. THY and CARV alone showed no growth, indicating no single-step resistance generation by this natural compounds.
Fig. 7
Comments (0)