Acquiring instrument variables for proteins in plasma
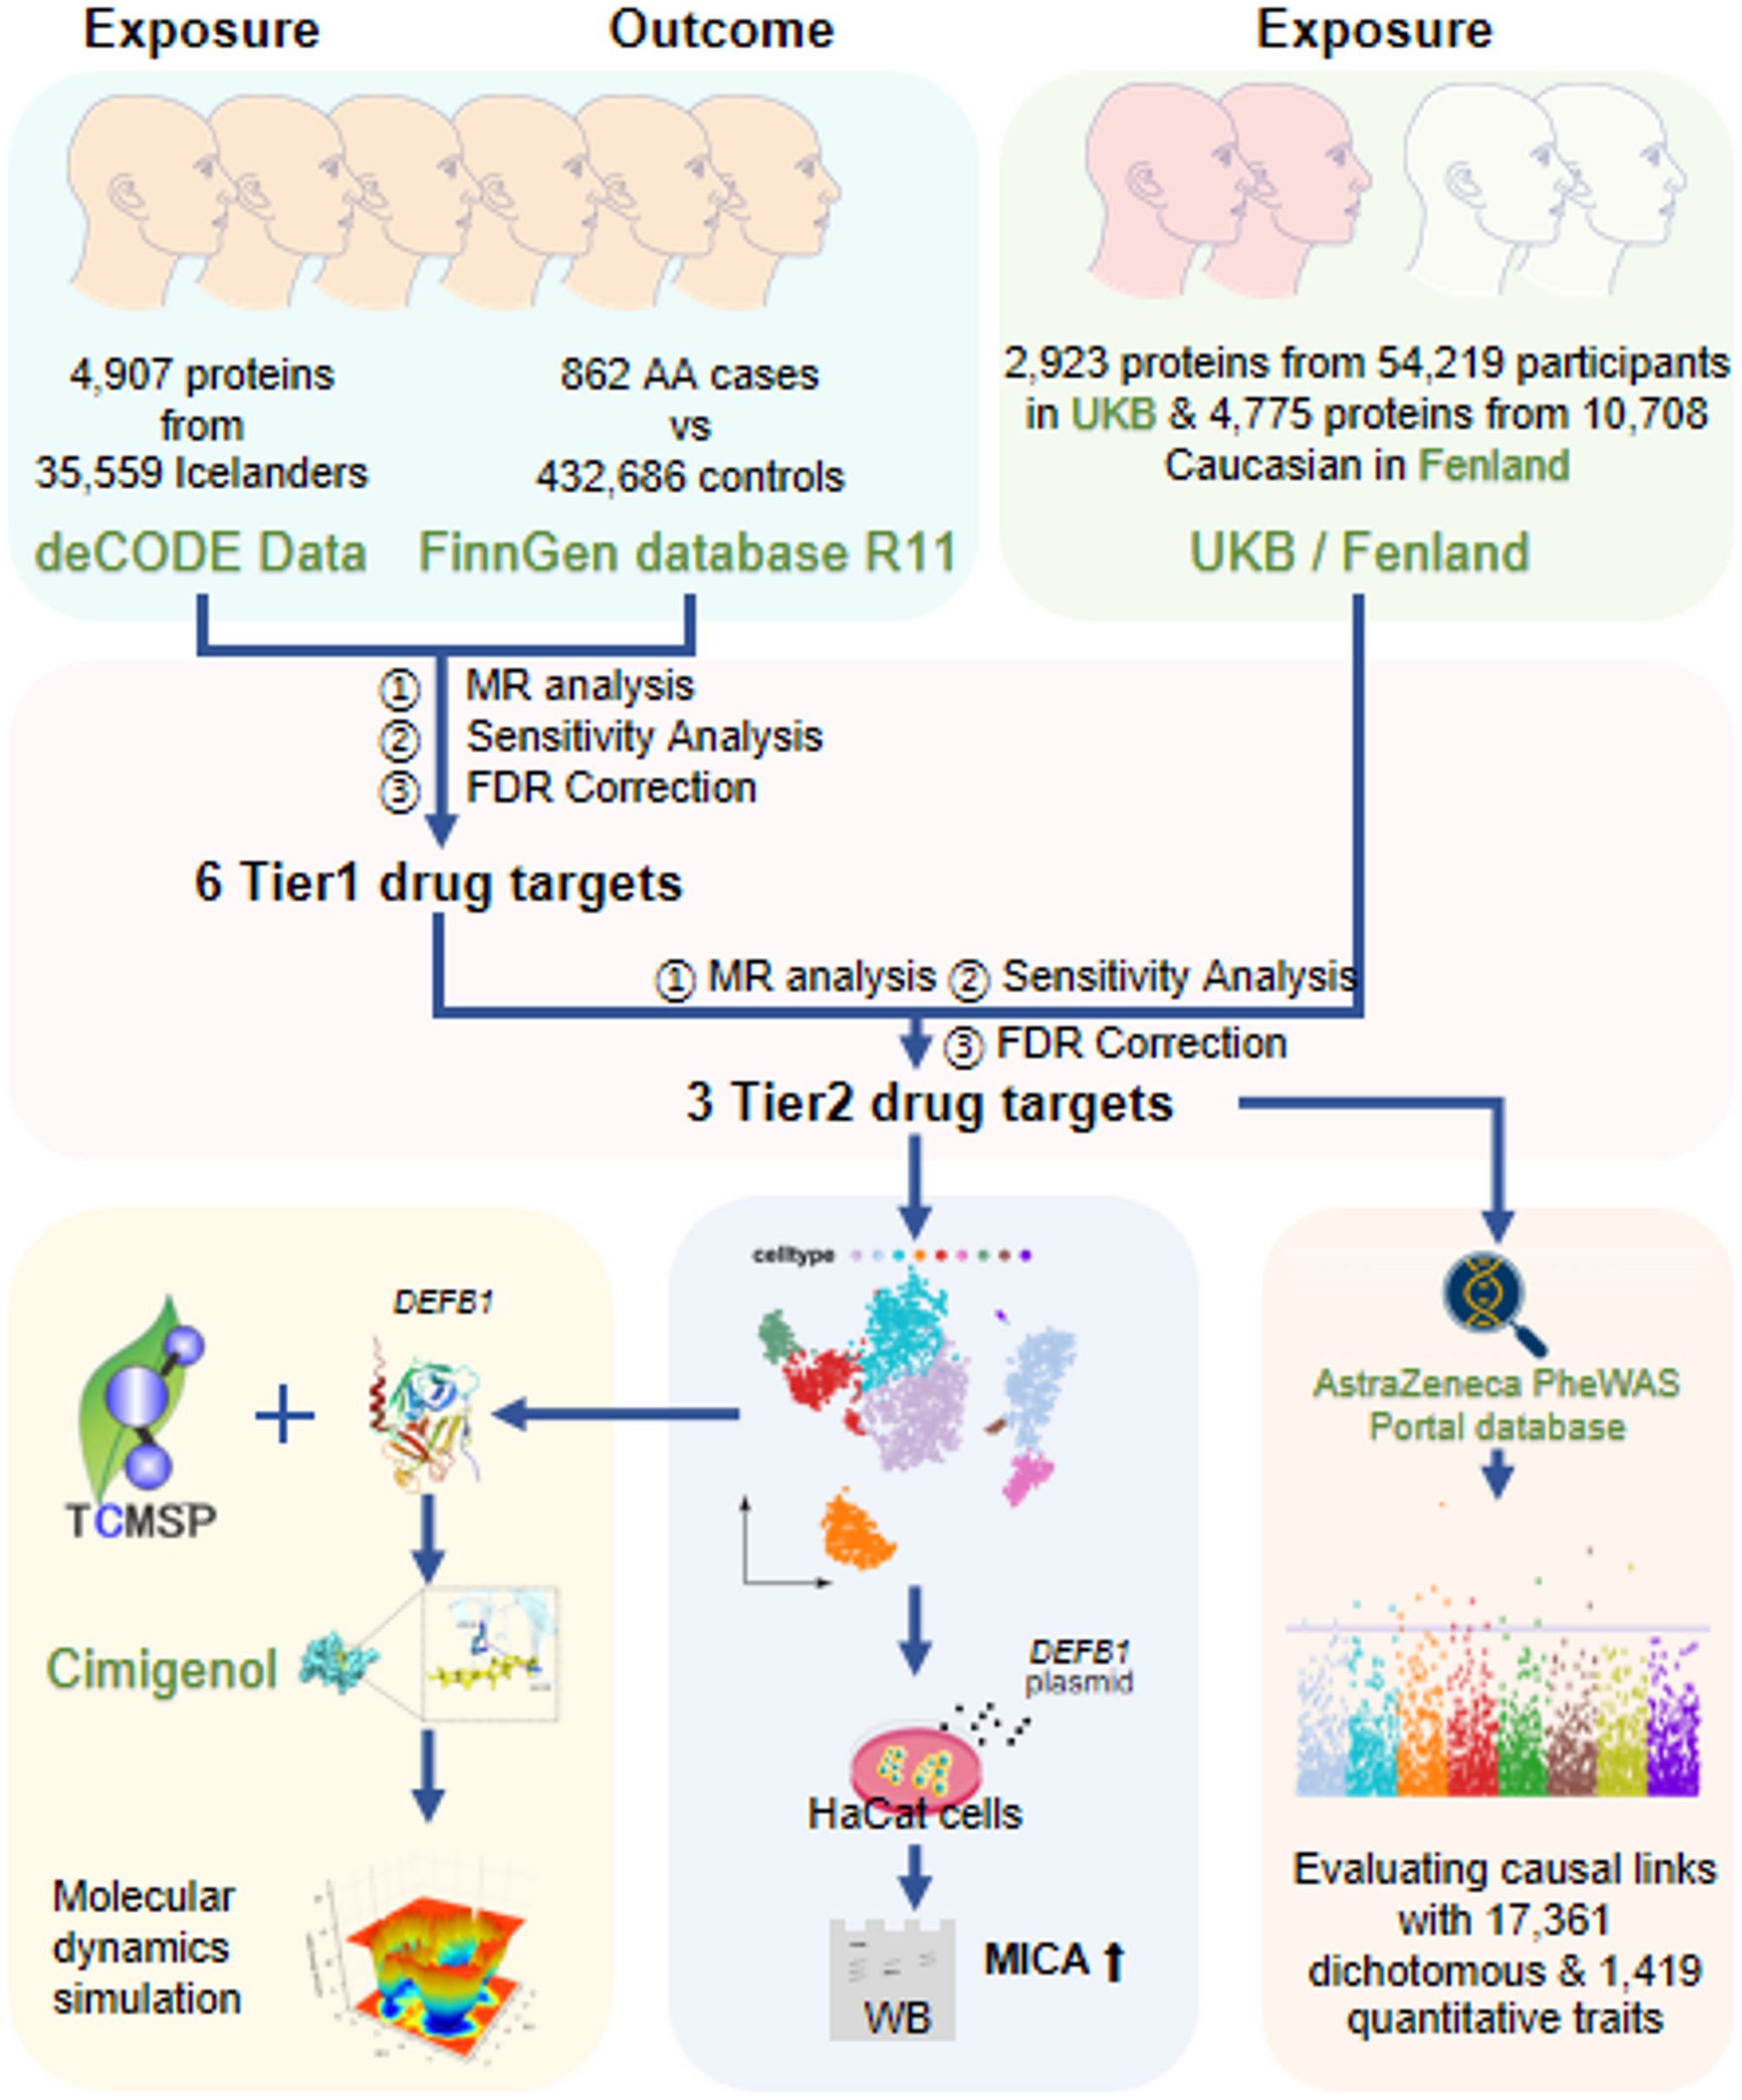
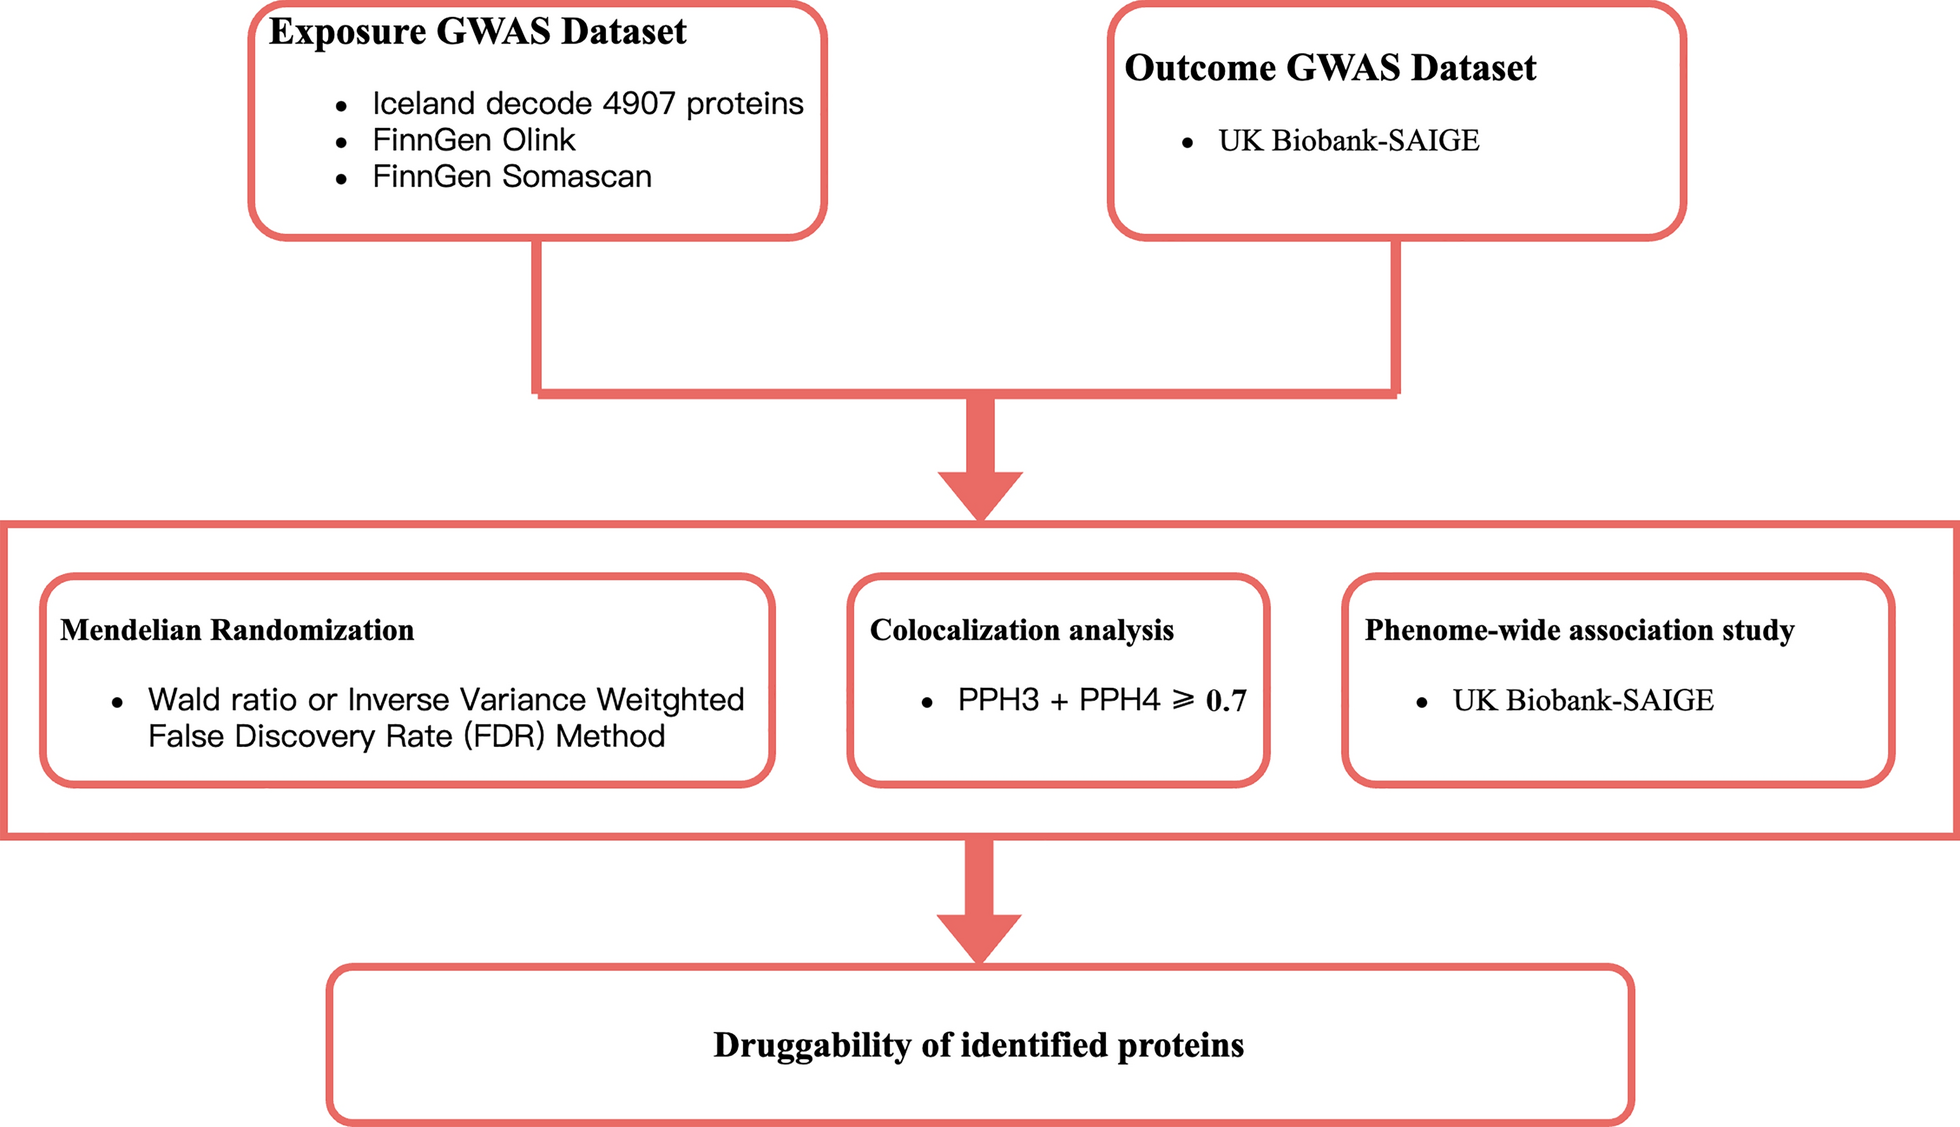
Plasma pQTL data obtained from deCODE Genetics were used for exposure in the primary selection. Involving 35,559 Icelanders in GWAS, deCODE contained 4,907 plasma proteins and significant genetic associations (pQTLs). The selection of pQTLs in MR was based on the following criteria: first, the pQTL had a significant genetic association with a certain plasma protein (p < 5e-08) and was not located within the range of the major histocompatibility complex (MHC) region (chr6, 26–34 Mb); second, the pQTLs showed no linkage disequilibrium (LD) clumping (r2 < 0.1, window size = 1000 Kb); and (should) a cis-acting pQTL (within 1 Mb range of gene for a lower pleiotropy).
Data from the UK Biobank Pharma Proteomics Project (UKB), which contained 54,219 participants and identified 2,923 proteins, were used for the validation of identified drug targets [12]. Additionally, proteome data from the Fenland Study with 4,775 proteins from 10,708 Caucasians were used for validation as well [13]. The selection of pQTLs in these two replication cohorts adhered to the same criteria outlined for the deCODE cohort.
GWAS summary statistics of AA
For both primary analysis and further validation, summary data obtained from the FinnGen database R11 were used as the outcomes. The GWAS summary data of the outcome were the AA dataset from the FinnGen R11 database (https://r11.finngen.fi/pheno/L12_ALOPECAREATA), which contained 862 patients with AA and 432,686 healthy participants.
MR analysis and study design for selection and validation of drug targets
MR analysis was developed to evaluate causal relationships without interference from confounding variables. In our study, the plasma proteins from the statistics in the deCODE, UKB, and Fenland studies were used as exposures, while AA was the outcome in the main MR analysis. The instrumental variables (IVs) were selected based on the criteria mentioned above. Using the “TwoSampleMR” package, the causal association between the protein with only one genetic instrument and AA was evaluated using the Wald ratio. The inverse variance weighted (IVW) method was used for other conditions. In addition, the MR Egger, Weighted median, simple mode, and weighted mode methods were used to evaluate the causal effects of proteins with more than two instruments. The increased risk of AA at the proteome level per standard deviation (SD) in blood is shown by the odds ratios (OR). The plasma proteins identified as being closely related to the risk of AA were prioritized as drug target candidates.
The causal effect of the drug target candidates on AA was further validated by MR analysis in the UKP and Fenland cohorts. Significance was also evaluated based on Bonferroni-corrected results [14]. We also employed the random effects model of the “metafor” package for the meta-analysis of the results in the three cohorts without heterogeneity and pleiotropy.
Phe-MR analysis investigated for side-effects of target proteins
To evaluate the potential side effects of the prioritized AA-associated proteins, Phe-MR analyses were performed on a range of diseases using the AstraZeneca PheWAS Portal (https://azphewas.com/) [15]. A significant risk or protection association will be determined with a p-value < 0.05/n in the Phe-MR analysis [16].
Sensitivity analysis
In the MR analysis, if a protein had more than two SNPs, the MR-Egger intercept test was employed to detect pleiotropy in the IVs of the exposure. Cochran’s Q test was used to evaluate heterogeneity among IVs.
In addition, Bonferroni correction was employed in the MR analysis to lower the potential false discovery rate (FDR) after multiple tests. A threshold of p < 0.05/n was used to determine whether the causal association was significant [17].
Analysis based on ScRNA expression dataset
Based on scRNA-seq data of biopsy samples from healthy controls and lesional areas with alopecia areata, the altered expression of genes encoding drug target proteins in specific cells was further evaluated. Gene expression profiles GSE212447 and GSE233609 were downloaded from the GEO database, and the original data were preprocessed and converted using the “Scanpy” package. After removing cells whose gene count was less than 200 and genes that were expressed in fewer than three cells in the sample, the RNA count was normalized and scaled with the “scanpy.pp.normalize_total” function. After data preprocessing, principal component analysis (PCA) and the “scanpy.tl.umap” functions were used to reduce the dimensionality of the merged dataset and visualize the expression of drug targets in different cell types. The “FindMarkers()” function and “clusterProfiler” package were employed in the gene set enrichment analysis(GSEA) to investigated the signaling pathways enriched in the keratinocytes of GSE212447.
Plasmid transfection
The plasmid was constructed (Corues Biotech, Nanjing, China), and cultured in RPMI 1640 medium supplemented with 10% FBS transfected with a plasmid carrying the DEFB1 fragment (DEFB1 sequences: ATGAGAACTTCCTACCTTCTGCTGTTTACTCTCTGCTTACTTTTGTCTGAGATGGCCTCAGGTGGTAACTTTCTCACAGGCCTTGGCCACAGATCTGATCATTACAATTGCGTCAGCAGTGGAGGGCAATGTCTCTATTCTGCCTGCCCGATCTTTACCAAAATTCAAGGCACCTGTTACAGAGGGAAGGCCAAGTGCTGCAAG) or empty plasmid in 12-well plates. The plasmid was transfected using CRTrans reagent (Abcam, USA).
Quantitative PCR
Total RNA was isolated from cultured cells using an RNA Isolation Kit (Vazyme, Nanjing, China), following the manufacturer’s protocol. The extracted RNA was then reverse-transcribed into cDNA using HiScript III RT SuperMix for qPCR (Vazyme, Nanjing, China). ChamQ SYBR Color qPCR Master Mix (without ROX) (Vazyme, Nanjing, China) was employed in accordance with the specifications of the Bio–Rad CFXTM Real-Time PCR Detection System for quantitative PCR. Sequences of the DEFB1 primers used for real-time PCR were constructed by Corues Biotech.
Western blotting
In the cell experiment, fibroblasts were collected after transfection and lysed in RIPA buffer (Thermo Fisher Scientific) with protease inhibitors (Thermo Fisher Scientific). The acquired proteins were quantified, separated by sodium dodecyl sulfate-polyacrylamide gel electrophoresis, and electroblotted to PVDF membranes. After blocking for 1 h at room temperature, the PVDF membranes were incubated with primary antibodies overnight and then with HRP-conjugated secondary antibodies at 4 °C. The primary antibodies used were anti-β-actin (1:10000, Proteintech, 20536-1-AP), anti-GAPDH(1:10000, Proteintech, 60004-1-Ig), anti-DEFB1(1:1000, Proteintech, 14738-1-AP), anti-TGFβ1(1:5000, Proteintech, 81746-2-RR), anti-SMAD2 (1:2000, Proteintech, 12570-1-AP), anti-p-SMAD2(1:1000, Proteintech, 80427-2-RR), and anti-MICA (1:1000, Proteintech, 66384-1-Ig). The bands were visualized using HRP substrate on a ChemiDocTM XRS + system (Bio-Rad).
Targeted screening for drugs interacted with drug targets via molecular docking
To identify new options for AA treatment, we searched for drugs that interact with DEFB1 in the Traditional Chinese Medicine Systems Pharmacology Database and Analysis Platform (TCMSP) database via molecular docking [18]. Based on the proteomic structure of drug targets downloaded from Uniprot, AutodockVina 1.5.7 was employed to evaluate predicted binding energy (PBE) and interaction between the Chinese herbal medicinal ingredients and DEFB1. We obtained the molecular structures of the herbal medicinal ingredients from TCMSP. The parameters for better druggability were set as follows: the blood-brain barrier (BBB) < −0.3, oral bioavailability (OB) > 30, and drug-likeness (dl) > 0.18 [19]. In addition, the molecular weight (MW) < 500 for a better drug absorption while the value of BBB should be less than − 0.3 to reduce possible neurotoxicity in the central nervous system. Discovery Studio Visualizer was employed to visualize the compound-protein interaction.
Molecular docking simulation
Before the molecular docking simulation, a system was prepared using a solution builder module. The systems were set into a cubic box and solvated using the TIP3P water model with antagonist sodium ions and hydrogen atoms to neutralize the charge. The edge of the box was at a minimum distance of 1 nm from the protein. The condition of the system was similar to that of the physiological environment, and the energy minimization step was performed using the Steepest Descent algorithm to eliminate any abnormal contacts between the protein and the surrounding water molecules.
After the system was equilibrated, the restraints on the protein were removed, and a 100 ns production molecular dynamics simulation was performed in GROMACS [20]. The production simulation was conducted under NPT conditions, maintaining a temperature of 300 K and pressure of 1.0 atm. The time step was set to 2 fs and all hydrogen-containing bond lengths were constrained using the SHAKE algorithm.
Cell viability test
The toxicity of selected drug was evaluated according to the viability of HaCaT cells with the Cell Counting Kit-8 (CCK-8). Briefly, the HaCaT cells were cultured with different concentrations of Cimigenol (MCE, HY-N6988) in a 96-well plate. After 24-hours culture, the CCK-8 reagent was added and the absorbance at 450 nm was measured 2 h later.


Comments (0)