Study design
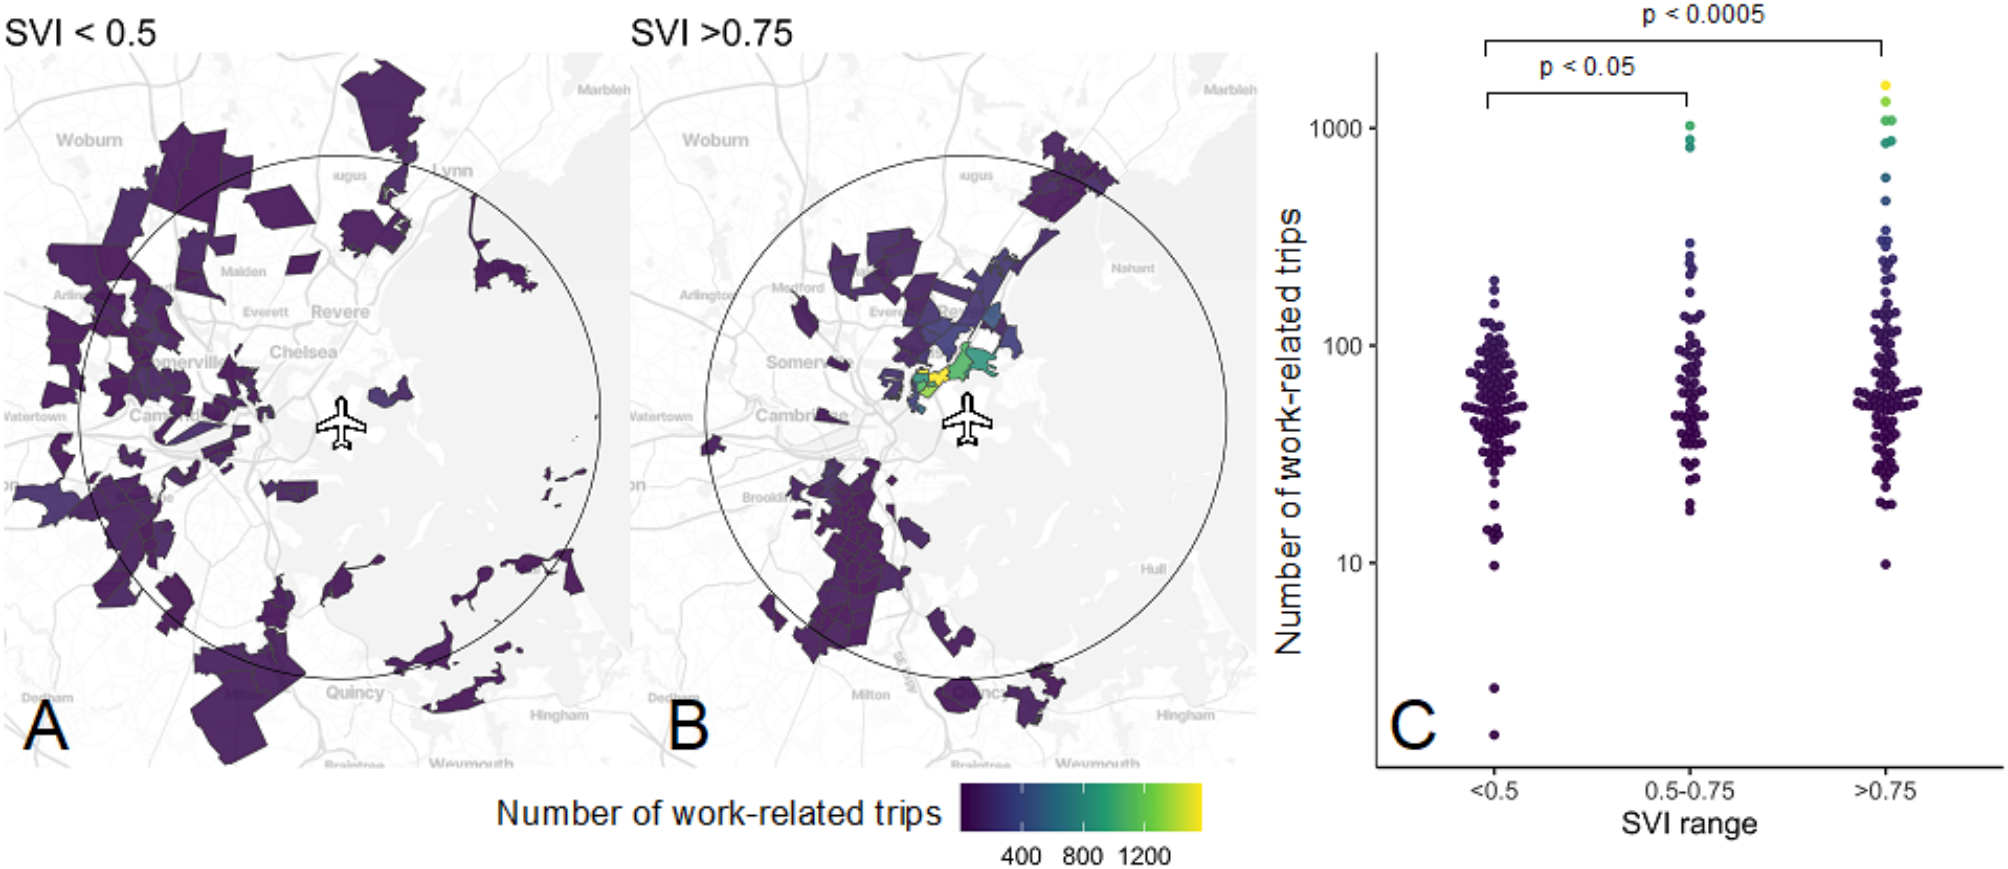
We conducted an ecological study to estimate the distribution of communities with airport workers in the Greater Boston area during the first eighteen months of the COVID-19 pandemic. We mapped estimates of the number of airport workers in each census block group across the Greater Boston Area and compared them with the Centers for Disease Control and Prevention (CDC) Social Vulnerability Index, a composite marker of socioeconomic status, household composition, minority status, and vehicle access [9]. Past studies have shown the close association between Social Vulnerability Index and COVID-19 burden during this period of the pandemic [10].
Mobility data
We used aggregated, anonymized GPS-derived location data from mobile phone applications collected in Massachusetts from January 2020– August 2021, obtained from SafeGraph (https://www.safegraph.com/). The dataset includes information about travel to and from census block groups and points of interest, such as airports, hotels, and restaurants. The dataset includes “dwell time buckets,” indicating the amount of time spent at each point of interest and counts of visitors between specific census block groups and specific points of interest. Prior research has validated the accuracy of SafeGraph data by comparing it with Google mobility data in the US and observing matching trends [11,12,13].
Social vulnerability index data
The CDC’s Agency for Toxic Substances and Disease Registry (ATSDR) assigns a Social Vulnerability Index score to each census tract, ranging from 0 (lowest vulnerability) to 1 (highest vulnerability) [9]. Each census block group in our SafeGraph dataset belongs to a census tract, so we assigned census tract-based Social Vulnerability Index scores to all census block groups within its boundaries. We grouped Social Vulnerability Index scores into one of three categories for each census block group: Social Vulnerability Index 0.00–0.50, Social Vulnerability Index 0.50–0.75, and Social Vulnerability Index 0.75–1.00.
Analysis of “visits for work” and “visits for travel” to Boston Logan international airport
According to the International Air Transport Association Global Passenger Survey, most travelers spend three or less hours at the airport [14]. Based on this, we defined any visit to one of the 134 points of interest located in census block groups within or contiguous to Logan Airport that lasted for four or more hours as a “visit for work” and any visit that lasted less than four hours as a “visit for travel.” We normalized the raw counts to points of interest at Logan International Airport based on the population of each evaluated census block group to avoid over-weighting travel frequency between Logan International Airport and census block groups with large populations (Supplemental Methods). We used the normalized count data to calculate the number of “visits for work” and “visits for travel” to Logan International Airport for each census block group. We used a one-sided t-test to compare the number of airport visits from communities across different Social Vulnerability Index quartiles.
Ethics approval
we used commercially and publicly available data without any individual identifiers, and we obtained ethics approval for this study from the Mass General Brigham institutional review board, which deemed the project to be non-human subjects research.
Patient and public involvement
No patients were involved in this study. Community involvement in this study occurred in the design, implementation, interpretation, and dissemination process through community volunteers for the Center for Complex Interventions, the Metropolitan Area Planning Council of Boston, and local boards of public health.


Comments (0)