
Remember me
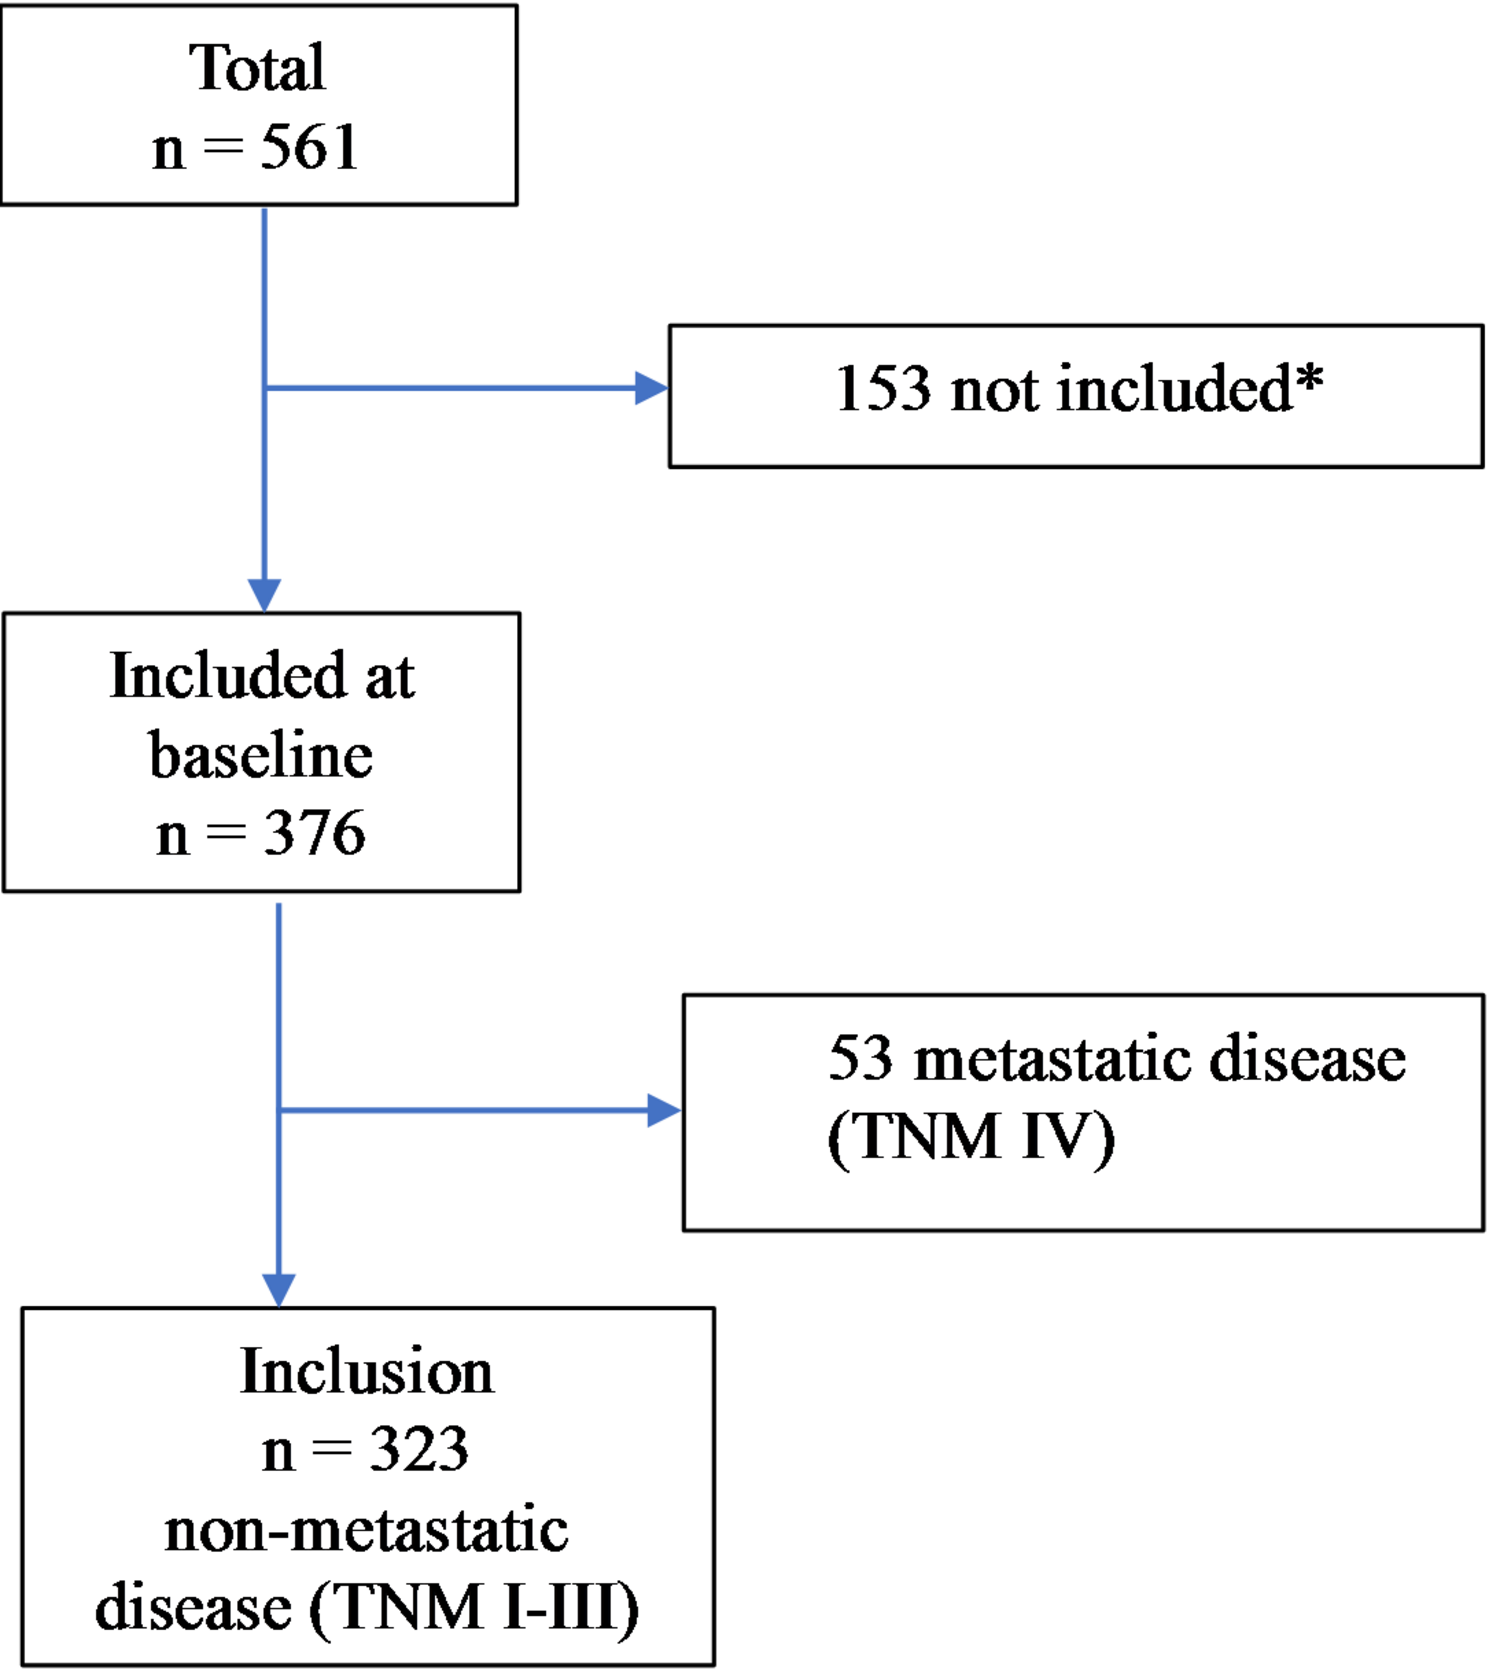


A detailed description of the data collection process has been given in a previously published study [14]. The study population consisted of 561 patients diagnosed with colon cancer between March 2012 and September 2016 in Västmanland County, Sweden (Fig. 1). In brief, after the patients provided written informed consent, they were enrolled in the study and completed the baseline questionnaire, including the EORTC QLQ-C30 instrument, within 1 month of diagnosis and before the start of treatment. Follow-up questionnaires were answered at follow-ups taking place 6 months, 1 year, and 3 years after baseline. Patients who did not consent to be included in the study or were unable to understand or answer the questionnaire were excluded. They were followed-up until June 4, 2022. Additional data on patient characteristics, including age, sex, American Society of Anesthesiologists (ASA) classification, body mass index (BMI), tumour location, preoperative tumour stage, and surgery were collected from medical reports. Patients were followed-up according to the Swedish National Guidelines, undergoing computer tomography after 1 and 3 years and endoscopic control with colonoscopy after 3 years and subsequently every 5 years until the patient turned 75 years old. Patients with tumour-node-metastasis (TNM) stage III received adjuvant chemotherapy if they were not too old, had severe comorbidity, or low World Health Organization performance status.
Fig. 1
Flow chart of the number of patients diagnosed with colon cancer between March 2012 and September 2016 in Västmanland County, Sweden (* reference 14)
Outcome and measuresThe primary outcome measures were local recurrence and appearance of distant metastases in patients with non-metastatic (TNM stage I-III) disease. Local recurrence was confirmed by a biopsy sample and/or positive imaging. Distant metastases were defined as recurrent disease in the peritoneum, liver, or outside the abdomen. The date of first site of recurrence was calculated, and DFS was defined as time to first event (local recurrence, distant metastasis, or death), with an individual considered censored at the date of follow-up (June 4, 2022) if it had not yet experienced any of these events at this date. The secondary outcome measure was OS, defined as the time from diagnosis to death from any cause. In this case, an individual was considered censored at the date of follow-up (June 4, 2022) if it was still alive at this date.
HRQoL questionnaireHRQoL was assessed using the well-validated generic EORTC QLQ-C30 questionnaire [15]. It consists of a global health status scale, five functional scales (physical, role, emotional, cognitive, and social), three symptom scales (fatigue, nausea/vomiting, and pain), and six single items (dyspnoea, insomnia, appetite loss, constipation, diarrhoea, and financial difficulties). All scales and items have scores ranging from 0 to 100 points. A high score for the global QoL or functional scale is interpreted as representing a high level of QoL or functioning, while a high score for symptoms scales/items is interpreted as representing more severe symptomatology.
Statistical analysesCategorical data are given as frequencies and percentages, n (%), while continuous data are given as means with accompanying standard deviations (SDs). Kaplan–Meier plots are used for graphically describing the univariate survival probability over time for categorical data, with differences between groups tested using associated log-rank tests. Unadjusted (univariable) and adjusted (multivariable) Cox proportional hazards regression models were used to estimate how HRQoL, age, sex, BMI, comorbidity (measured with ASA status) and TNM stage I-III were associated with DFS and OS. The results of the Cox regression models are given as hazard ratios (HRs) with accompanying 95% confidence intervals (CIs), with the association between HRQoL and DFS/OS estimated using separate models for each of.
Global health status (GHS), the five functional scales, and nine symptom scales/items. For ease of interpretation, the HRs and 95% CIs for the HRQoL variables are given per 10 points of the 0–100 points range. SPSS 28.0 (IBM, Armonk, NY, USA) and R 4.4.2 (R foundation for Statistical Computing, Vienna, Austria) were used for the statistical analysis, with P-values < 0.05 considered statistically significant. In line with the arguments by Rothman (1990) that adjustments for multiple comparisons should be avoided when analysing empirical data from actual observations, since these are not random numbers but should be considered as mirroring underlying natural processes, no adjustments for multiple comparisons were performed [16].
Comments (0)