
Remember me


Sixty-five patients were included in the AML-cohort. Among them, 45 (69%) presented hyperleukocytosis, 18 (28%) leukostasis, 26 (40%) diffuse intravascular coagulopathy and 23 (35%) tumor lysis syndrome. Forty-three (66%) received hydroxyurea, and 39 (60%) dexamethasone before induction chemotherapy. Thirty-eight patients (59%) received their induction chemotherapy in the ICU. Antibiotics were prescribed before induction chemotherapy in 44 patients (68%)(Table 1).
Table 1 Clinical characteristics of the AML-cohortFollowing induction chemotherapy, the 65 patients experienced neutropenia for a median of 21 [20,21,22,23,24] days. Twenty-six (40%) were diagnosed with NE (AML-NE). The remaining 39 patients (60%) constituted the AML-control group. Among them, 28 (43%) experienced uncomplicated diarrhea (AML-C diarrhea (+)), while 11 patients (17%) did not have any digestive complications (AML-C diarrhea (-)) (Fig. 1). The baseline characteristics of the AML-NE patients did not differ from the rest of the cohort, and they did not receive more antibiotics prior to induction chemotherapy (Table 1 and Supplemental Figure S1).
During neutropenia, AML-NE patients exhibited a higher incidence of bloodstream infections (15 vs. 11; p = 0.04) with a notable prevalence of Enterobacteriaceae (Supplemental Table S1). They also presented more oral mucositis [20 (77%) vs. 13 (33%); p < 0.001], and Herpes Simplex virus (type 1 and 2) recurrences [13 (50%) vs. 4 (10%); p < 0.001]. However, antibiotic treatments did not differ in either antibiotic class or duration (Table 1). No significant differences were observed in 1-year outcomes (Supplemental Figure S2).
Additionally, 13 patients admitted to the ICU for NE with other underlying hematological diseases, had samples collected and formed the N-AML-NE group. Most of these patients (8/13) had undergone autologous stem-cell transplantation. They were not clinically different from the AML-NE group (Supplemental Table S2).
Bacterial load and ?-diversity significantly decreased after chemotherapy in all patientsThe taxonomic identification generated an average of 92,038 reads per sample, and a total of 439 operational taxonomic units (OTUs) were annotated. Regarding α-diversity, all indexes (number of identified OTUs, Shannon and Simpson indexes) were lower in the post-chemotherapy samples (p < 0.001), with Shannon index decreasing from 3.3 [2.7–3.7] before chemotherapy to 2.2 [1.3–3.0] in the AML-NE group at NE’s diagnosis (Fig. 2.A). Similarly, bacterial load was 4.1 1010 [1.9 1010; 6.4 1010] bacteria / gramme of feces in the AML-cohort before chemotherapy and decreased in all groups (p < 0.001) down to 9.2 109 [2.3 109; 2.5 1010] in the AML-NE group at NE’s diagnosis (Fig. 2.B). Although the N-AML-NE group had the lowest Shannon index and bacterial load, there was no statistical difference between the 2 NE groups (AML and N-AML) and the 2 post-chemotherapy AML control groups [diarrhea (+) and diarrhea (-)]. Regarding the impact of antibiotics, the initiation of antibiotics prior to chemotherapy was not significantly associated with a reduction in bacterial load (p = 0.26) or α-diversity indices in baseline samples (Supplemental Figure S3.A). Moreover, neither the use of broad-spectrum antibiotics (piperacillin-tazobactam or carbapenems), nor prolonged antibiotic treatments was associated with a significant reduction in α-diversity.
Fig. 2
Targeted 16s rRNA metagenomic analysis of gut microbiome (α and β-diversity). Box plots presenting levels of (A) Shannon α -diversity index and (B) bacterial load (expressed as number of bacteria / g of feces) between the 4 different clinical timepoints: before chemotherapy in all AML patients (n = 38), at day 14 for AML-controls diarrhea (-) (n = 15), at diagnosis of diarrhea for AML-controls diarrhea (+) (n = 15), at diagnosis of NE for AML-NE (n = 19), and N-AML-NE (n = 6). p-values were calculated using a non-parametric two-sided Kruskal-Wallis test with Dunn’s multiple comparisons tests. A p-value < 0.01 was considered statistically significant. (C) Dot plot illustrating the coordinates of the Bray-Curtis matrix distances of each sample on Principal Coordinates Analysis (PCoA). Dots were colored based on their associated clinical timepoint. (D) Permutated Multivariate Analysis of Variance (PERMANOVA) analysis of Bray-Curtis distances. A p-value < 0.001 was considered statistically significant. (E) Violin plot and (F) regression curve with 95%CI comparing the dynamic modifications in the AML-NE group (n = 26) to the rest of the AML controls (n = 39). (G) Bar plot describing taxa contributing to the dynamic microbial signature of NE
Dynamic taxonomic analysis identified a microbial signature associated with NEWhen Bray-Curtis distances were subject to PERMANOVA analysis, baseline samples from the AML-cohort taken before chemotherapy exhibited distinct clustering from all post-chemotherapy samples (p = 0.003). After chemotherapy, all 4 groups were not statistically different (Fig. 2.C and D). However, the dynamic analysis of the AML-cohort identified a microbial signature associated with AML-NE’s patients (p < 0.001) (Fig. 2.E and F). This signature was positively characterized in sequence by phylotypes related to Veillonella, Eggerthellaceae family, Enterococcus faecalis, and Barnesiella. In contrast, phylotypes associated with AML-controls included those from the Coriobacteriaceae Incertae Sedis family, Alistipes putredinis, and Lactococcus lactis (Fig. 2.G).
Unsupervised analysis identified two enterotypes associated with NEUnsupervised analysis identified 4 clusters named enterotypes (Fig. 3.A), with a temporal switch from a predominance of an enterotype 2 to a predominance of enterotypes 1 and 4 (Fig. 3.B). These enterotypes were associated with clinical time-points (p < 0.001). Indeed, 66% (25/38) of samples taken before chemotherapy presented the enterotype 2 and 72% (18/25) of samples taken at the diagnosis of NE (AML or N-AML) presented the enterotype 1 or 4 (Fig. 3.C). This distribution of enterotypes remained stable both at baseline (p = 0.08) (Supplemental Figure S3.B) and during neutropenia regardless of antibiotic class and duration.
Fig. 3
Unsupervised analysis of 16s rRNA data identified 4 distinct enterotypes. (A) Dot plot depicting coordinates of each sample on the principal co-ordinate analysis (PCoA) performed using the Bray-Curtis matrix distance. Samples were clustered using hierarchical k-means, with each cluster representing an enterotype. (B) Comparison of the time elapsed from the initiation of chemotherapy in the AML-cohort between the enterotypes. p-value was computed with bilateral Wilcoxon test. (C) Bar plot showing the distribution of the 4 enterotypes among the different clinical timepoints (All AML baseline, AML-C diarrhea (-) at Day 14, AML-C diarrhea (+), AML-NE, and N-AML-NE at diagnosis). Box plots depicting the comparisons of (D) bacterial load (bacteria / g of feces), and (E) Shannon α -diversity index between the 4 enterotypes [enterotype 1 (n = 19), enterotype 2 (n = 31), enterotype 3 (n = 25) and enterotype 4 (n = 18)]. Two tailed p-values were performed using Kruskal-Wallis test with Dunn’s multiple comparisons tests. p-value < 0.01 was considered statistically significant
Regarding microbial characteristics, fecal bacterial load and α-diversity also differed significantly among the enterotypes (p < 0001) (Fig. 3.D and E). Enterotype 2 was the richest with a bacterial load of 4.3 1010 [2.5 1010– 7.3 1010]. It also exhibited the highest Shannon α-diversity index (3.6 [3.2–3.7]). It was characterized by high proportions of members of the Eubacteriales order: Agathobacter, Anaerostipes, Blautia, Dorea, Roseburia, but also Butyricicoccus, Ruminococcus and members of the Eubacterium siraeum group. It also included Akkermansia, Bifidobacterium and Collinsella. Enterotypes 1 and 4 had the lowest bacterial loads (8.8 109 [3.5 109– 1.9 1010] and 8.9 109 [2.8 109– 6.2 109] respectively) and the lowest Shannon α-diversity indexes (1.3 [1.0–1.5] and 1.3 [1.0–2.4] respectively). Enterotype 1 was characterized by a strong predominance of Enterococcus.
Enterotypes associated with NE were characterized by a depletion in short-chain-fatty acids producing genera and low SCFA fecal concentrationsEnterotype 1 and 4 exhibited a lower representation of bacterial genus that were predominant in enterotype 2, and which are known to be SCFAs-producing genera: Anaerostipes, Agathobacter, Akkermansia, Blautia, Bifidobacterium, Bacteroides, Butyricicoccus, Eubacterium, Faecalibacterium, and Ruminococcus (Fig. 4.A.a to A.d). Consistently, enterotypes 1 and 4 had significantly lower total SCFAs fecal concentrations compared to enterotype 2 with 6.8 µmol/g [3.1–14.7] (p = 0.002) and 4.0 µmol/g [1.2–16.0] (p < 0.001) respectively, vs. 32.2 µmol/g of dry weight [20.4–56.0] (Fig. 4.B). The decrease was more pronounced for butyrate, representing 1.7% ± 2.6 and 2.9% ± 3.7 of all SCFAs in enterotypes 1 and 4, respectively, vs. 9.0% ± 4.6 in enterotype 2 (p < 0.001) (Fig. 4.C). The concentrations of butyrate and propionate were correlated respectively to the number of OTUs of butyrate-producing genera (R = 0.57 [0.38–0.71]; p < 0.001) (Supplemental Figure S4.A; Supplemental Table S4) and propionate-producing genera (R = 0.52 [0.32–0.67]; p < 0.001) (Supplemental Figure S4.B; Supplemental Table S4).
Fig. 4
Enterotypes 1 and 4 demonstrated a reduced production of fecal short-chain fatty acids. (A) Bar plots presenting for each enterotype (A.a to A.d) the differential abundance of the significant genera (adjusted p-value < 0.01). (B) Box plots comparing the total SCFAs fecal concentrations expressed in µmol / g of dry feces weight among the 4 enterotypes [enterotype 1 (n = 19), enterotype 2 (n = 31), enterotype 3 (n = 25) and enterotype 4 (n = 18)]. (C) Bar plot showing the distribution in percentages of the majority SCFAs namely acetate, butyrate, and propionate for each enterotype. “Other SCFAs” gathered valerate, isovalerate, isobutyrate, caproate, and isocaproate
Enterotypes associated with NE exhibited a significant pro-inflammatory cytokine profileRegarding the panel of 12 plasmatic cytokines tested, significant differences were observed between the 4 enterotypes (p < 0.001) for IFN-?, IL-6, IL-8, CXCL12, GM-CSF and IL-13. Compared to enterotype 2, enterotype 1 and 4 had significantly higher levels of circulating IL-6 [162.1 pg/mL [14.0–298.3] (n = 17) and 13.2 pg/mL [7.0–390.2] (n = 13) respectively, vs. 1.7 pg/mL [0.8–6.6] (n = 28)] and IL-8 [654.0 pg/mL [225.1–874.0] (n = 17) and 358.6 pg/mL [125.1–654.0] (n = 13) respectively, vs. 29.4 pg/mL [14.2–154.7] (n = 28)] (Fig. 5.A.a to A.l). However, both f-calprotectin or f-hBD2 levels remained low and showed no significant differences across the 4 enterotypes (p = 0.39 and p = 0.20), with a median of 18.4 µmol/g of feces [10.3–79.5] for f-calprotectin and 18.6 µmol/g of feces [9.6–49.8] for f-hBD2 (Fig. 5.B and C).
Fig. 5
Enterotype 1 and 4 exhibited decreased enteral mass and significant systemic inflammation. (A) Box plots comparing the plasmatic concentrations of the following cytokines and chemokines among the 4 enterotypes: IFN- ? (a), IL-6 (b), IL-8 (c), SDF-1 (d), GM-CSF (4), IL-13 (f), IL-10 (g), IL-12p70 (h), IL-1 β (i), IL-2 (j), TNF-α (k), VEGF (l). Cytokine concentrations were expressed on a base-10 logarithmic scale (pg/mL). (B) Box plots comparing f-calprotectin among the 4 enterotypes [enterotype 1 (n = 18), enterotype 2 (n = 19), enterotype 3 (n = 20) and enterotype 4 (n = 16)]. (C) Box plots comparing the fecal concentration of human β-defensin 2 among the 4 enterotypes [enterotype 1 (n = 19), enterotype 2 (n = 19), enterotype 3 (n = 20) and enterotype 4 (n = 16)]. (D) Box plots presenting levels of plasma citrulline among the 4 enterotypes [enterotype 1 (n = 15), enterotype 2 (n = 26), enterotype 3 (n = 20) and enterotype 4 (n = 17)]. p-values were calculated using a non-parametric two-sided Kruskal-Wallis test with Dunn’s multiple comparisons tests. (E) Heatmap presenting the matrix of Spearman’s correlation coefficients between IL-6, IL-8, SDF-1, GM-CSF, IL-13, plasma citrulline, bacterial load, Shannon α-diversity index, the number of observed OTUs of butyrate producers, the NE’s bacterial signature coefficient, and the fecal concentrations of butyrate. p-value < 0.01 was considered statistically significant
Enterotypes associated with NE exhibited a significant decrease in plasma citrulline levels which correlated with IL-6 inflammatory profile and low fecal butyrate concentrationPatients classified under enterotypes 1 and 4 exhibited lower plasma citrulline levels (6 µmol/mL [4–8] and 9 µmol/mL [4–15], respectively) compared to enterotype 2 (26 µmol/mL [19–34]) (p < 0.001) indicating a severe reduction of enterocyte mass in NE patients (Fig. 5.D). Interestingly, a strong correlation was found between plasma citrulline levels and plasma IL-6 levels (r = -0.66), as well as with the number of OTUs of butyrate-producing genera (r = 0.46) and fecal butyrate concentration (r = 0.46) (Fig. 5.E).
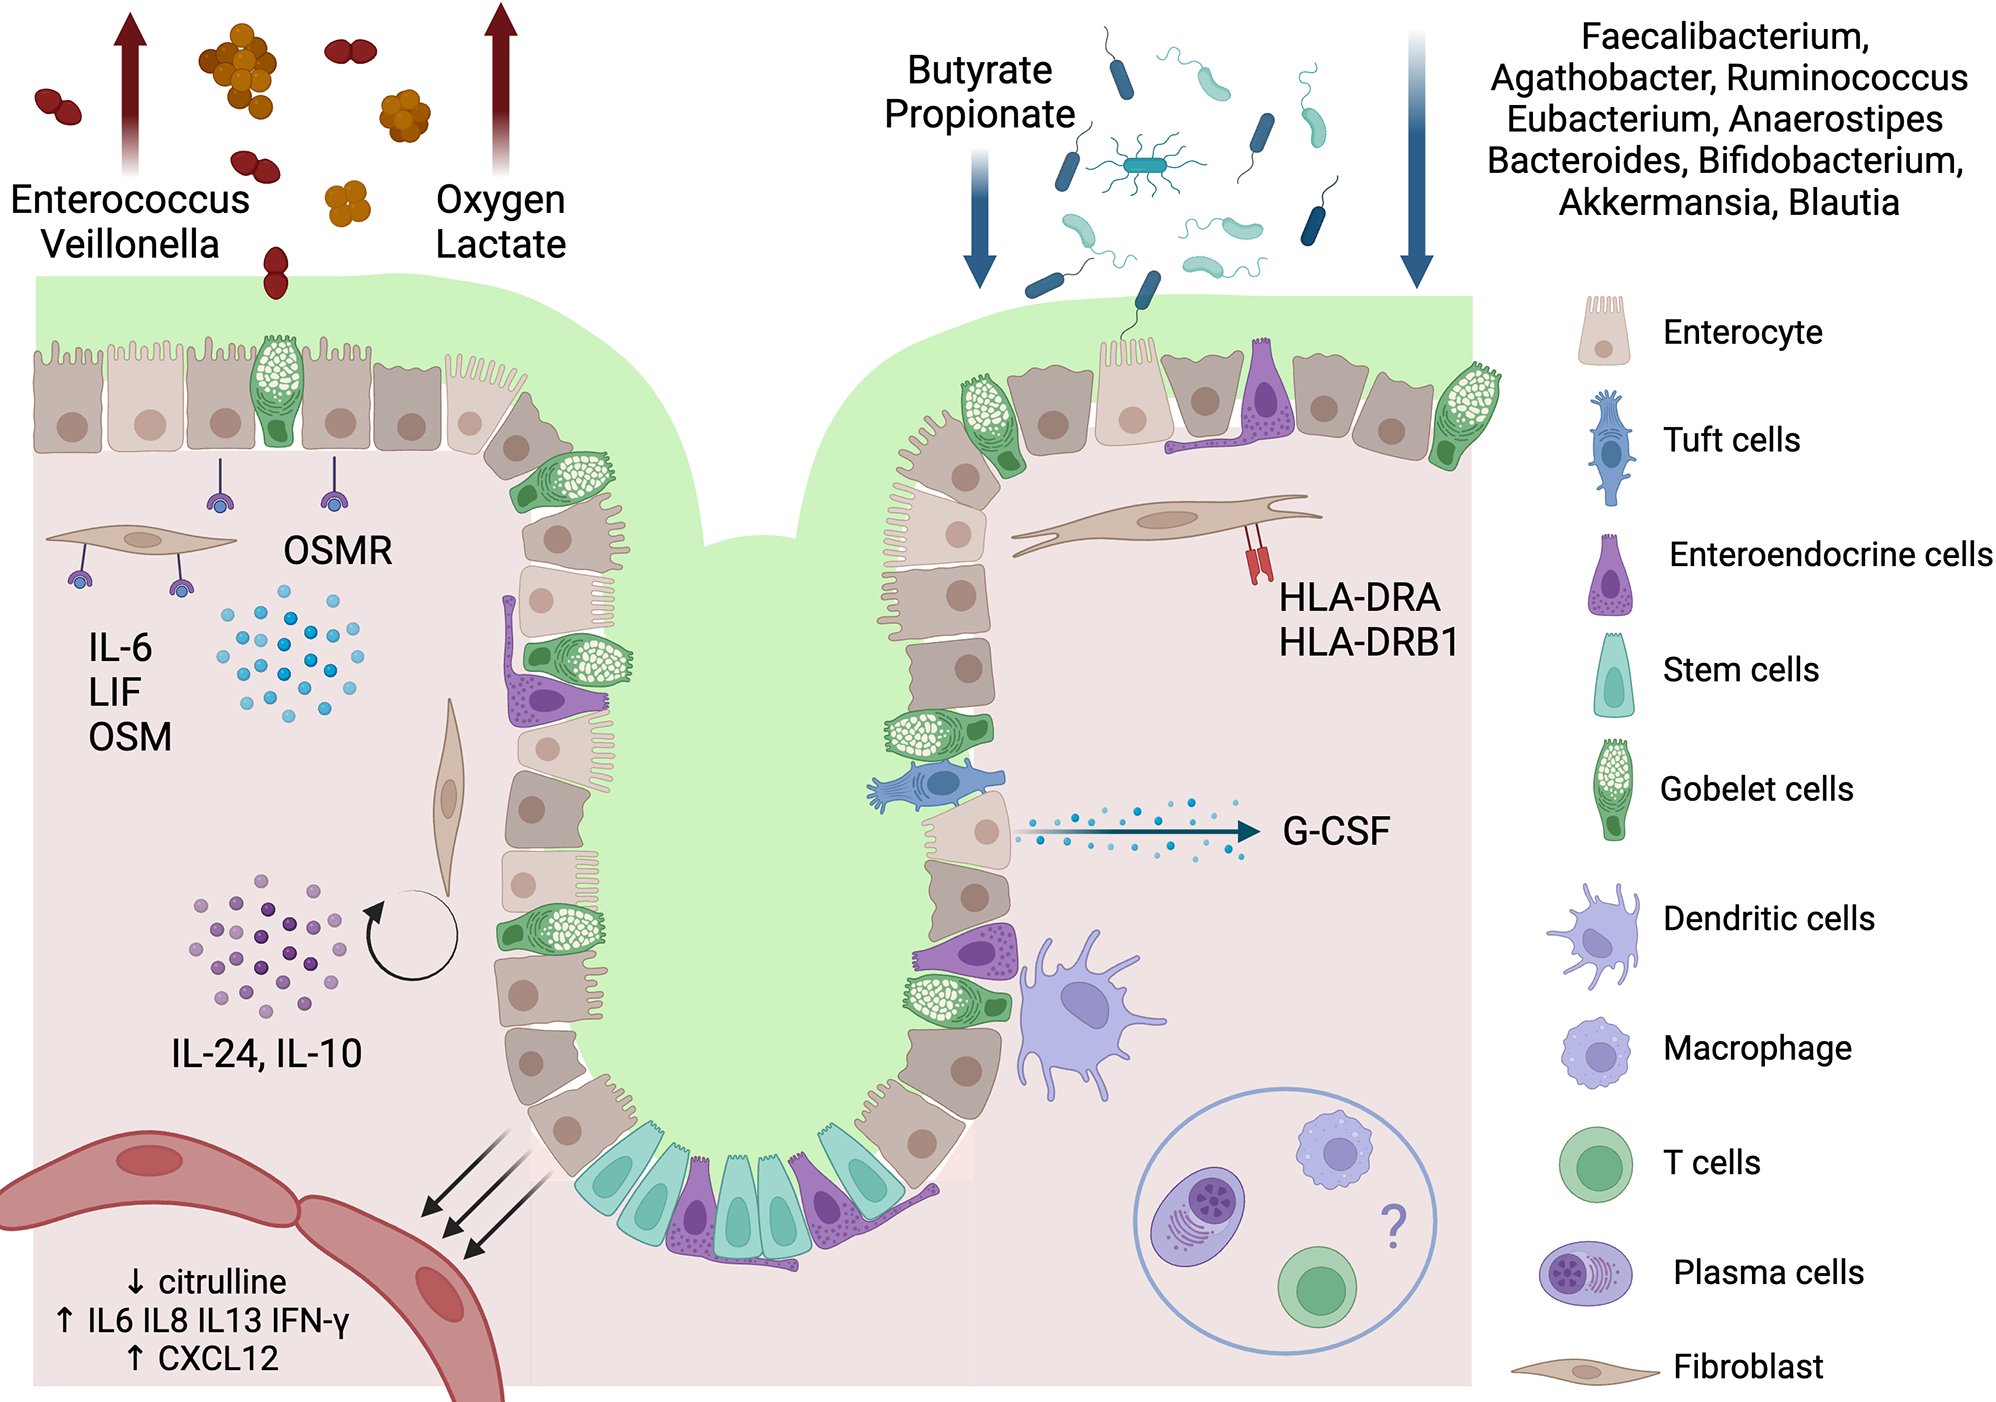
Histopathological and transcriptomic analyses supported the presence of a local immune response in severe NEAmong the 39 patients with NE, 10 particularly severe underwent surgical management, and 6 of them had a colonic resection (Supplemental Table S3). Human transcriptomic analysis compared the 6 colonic samples to 5 controls. The histopathological analysis of the specimens with NE revealed an ulcerated mucosa covered with a fibrino-leukocytic exudate. The submucosa appeared edematous and congested, accompanied by hemorrhagic suffusion (Fig. 6.A). One sample was excluded in each group because the number of identified genes was below 10 000. Principal Component Analysis of global transcriptomic data differentiated between NEs and controls, indicating significant differences in gene expression (Fig. 6.B). The 840 significantly differentially expressed genes defined by a Log2Fold Change >⎟2⎜and a p adjusted value < 0.05 (Fig. 6.C) were used to perform unsupervised ranked ontology analysis within the Kyoto Encyclopedia of Genes and Genomes (KEGG) pathways (Fig. 6.D). Among the 185 KEGG pathways, the analysis identified 22 significantly up-regulated ones. The most significative was the JAK-STAT signaling pathway (normalized enrichment score (NES) 2.61, false-discovery rate (FDR) 0.0006, KEGG Pathway hsa04630) that includes the signal transducer and activator of transcription 1 (STAT1), cytokines and receptors from the IL-6 family [IL-6, leukemia inhibitor factor (LIF), oncostatin M (OSM), oncostatin M receptor (OSMR)], cytokines from the IL-10 family (IL-10, IL-24), IL-7 receptor (IL-7R) and growth factors (colony stimulating factor, CSF3) (Fig. 6.E and 6.F). Moreover, among the 22 up-regulated pathways 12 shared up-regulated genes of class II major histocompatibility complex [HLA-DQB1 (NES 8.07, FDR 0.00006), HLA-DRB1 (NES 2.82, FDR 0.008), HLA-DRA (NES 2.04, FDR 0.000008)] and class I major histocompatibility complex [HLA-B (NES 2.34, FDR 0.00006)] (Supplemental Figure S5).
Fig. 6
Human transcriptomic and histopathological analysis. (A) Histopathological observations of NE specimen (A1 to A3) and control (A4 to A6) using Hematoxylin and eosin stain with X1, X2, and X10 scanning magnifications. Observations A1 to A3 reveal ulcerated mucosa with fibrino-leukocytic exudate, edema, and vascular congestion. Scales are reported on the right of the control images (B) Dot plot illustrating the principal transcriptomic coordinates of the 5 NE samples and 4 controls. (C) Volcano plot illustrating the down-regulated and up-regulated genes in NE colic samples compared to the controls. Genes were considered unchanged when padj was > 0.05 and L2FC < ⎟2⎜. (D) Bar plot of the normalized enrichment scores of the 20 most significative up-regulated KEGG-pathways in the NE’s human transcriptomic analysis compared to the controls. (E) Heatmap of the Jak-STAT signaling KEGG pathway (hsa04630). (F) Bow plots comparing between NE samples and controls the normalized expression count for the most significant genes of the Jak-STAT pathway: STAT1, IL-24, CSF3, and genes from the IL-6 family (IL-6, LIF, OSMR). Specific Mann-Whitney comparison of padj < 0.001 was considered statistically significant
Comments (0)