
Remember me

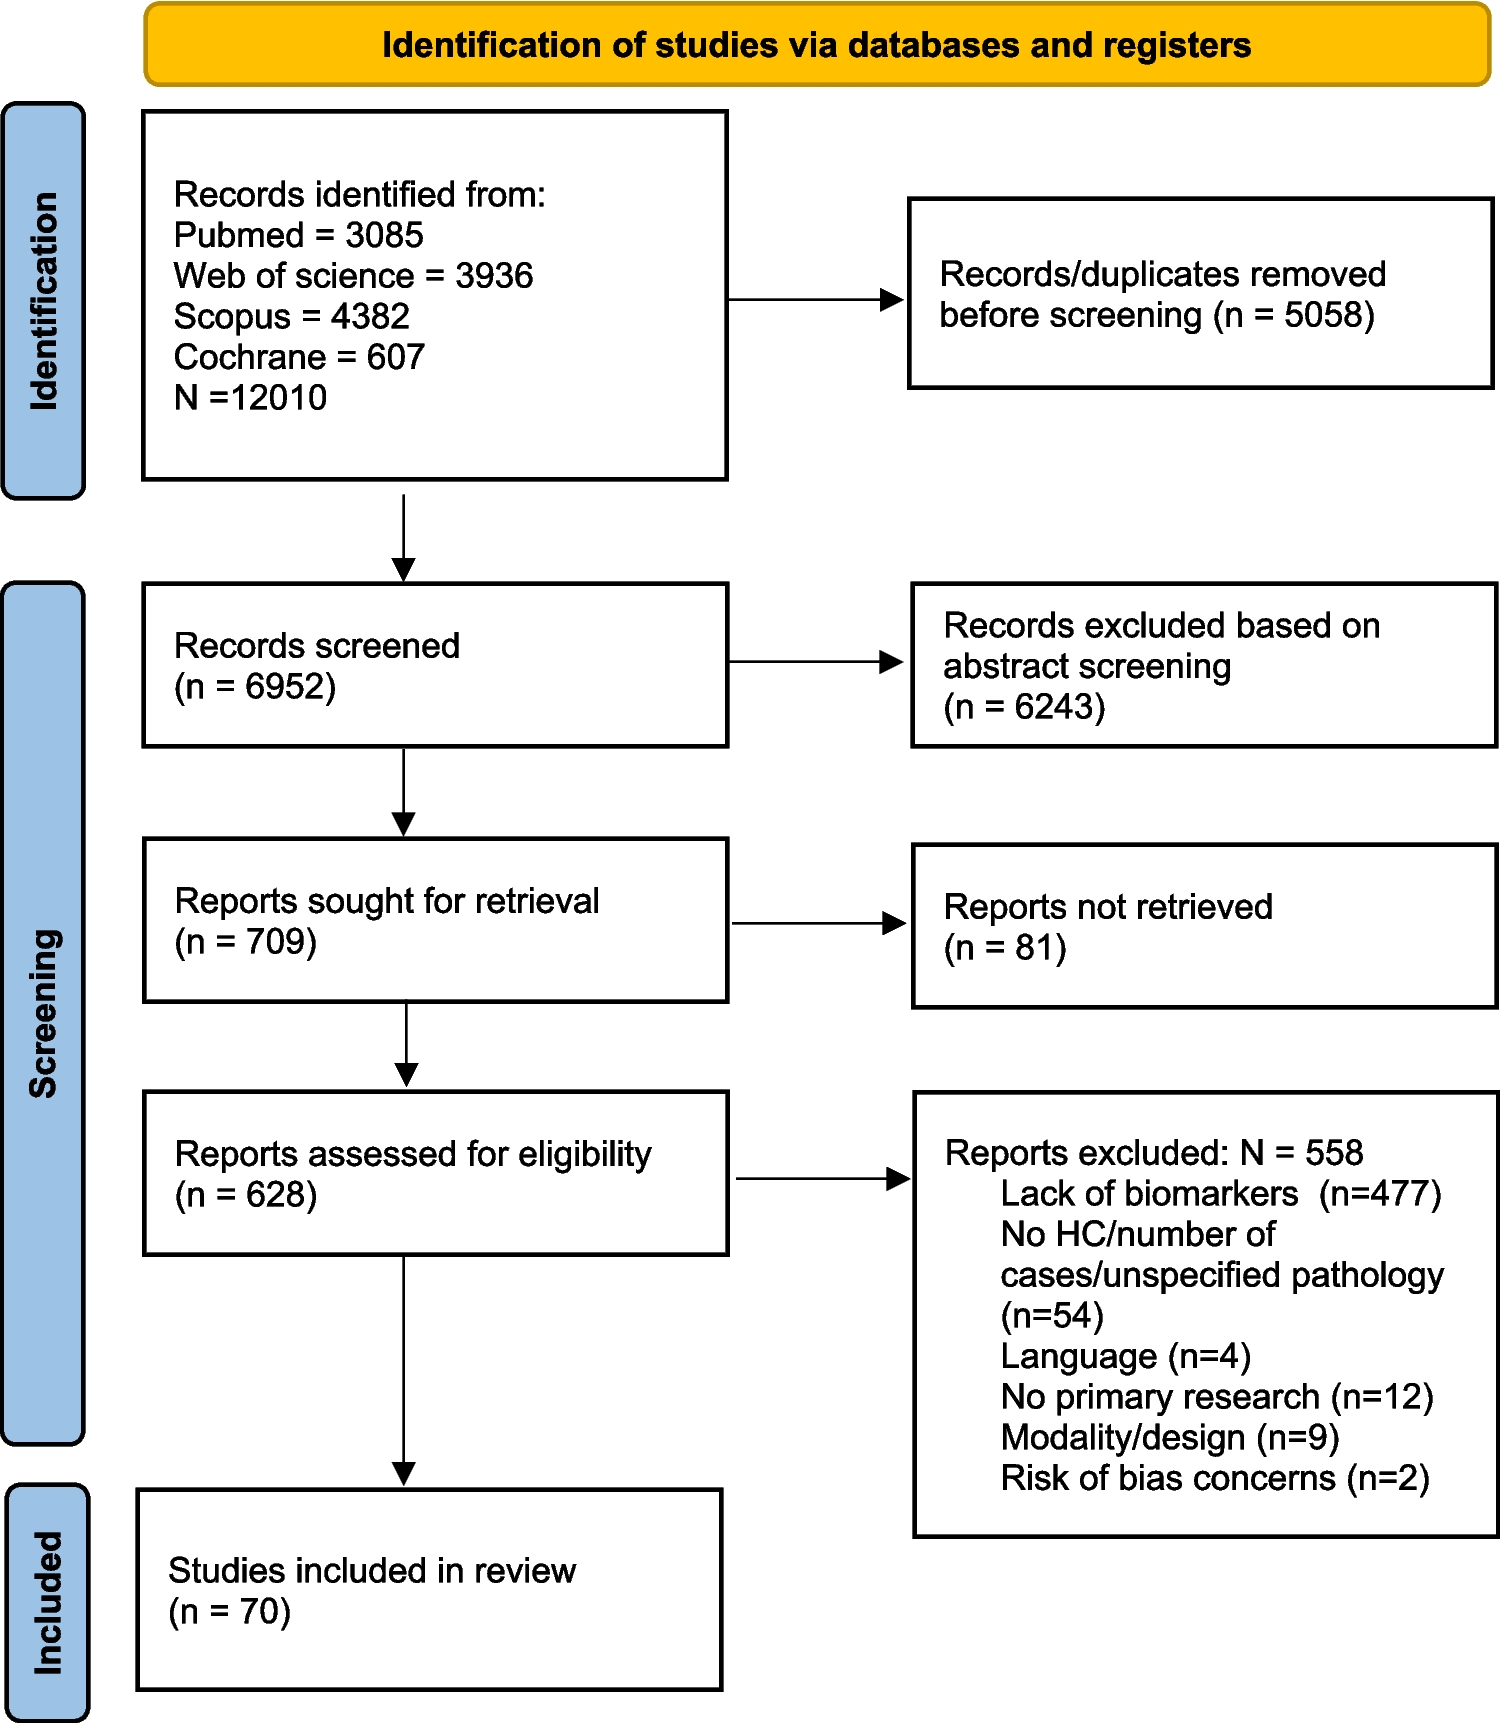
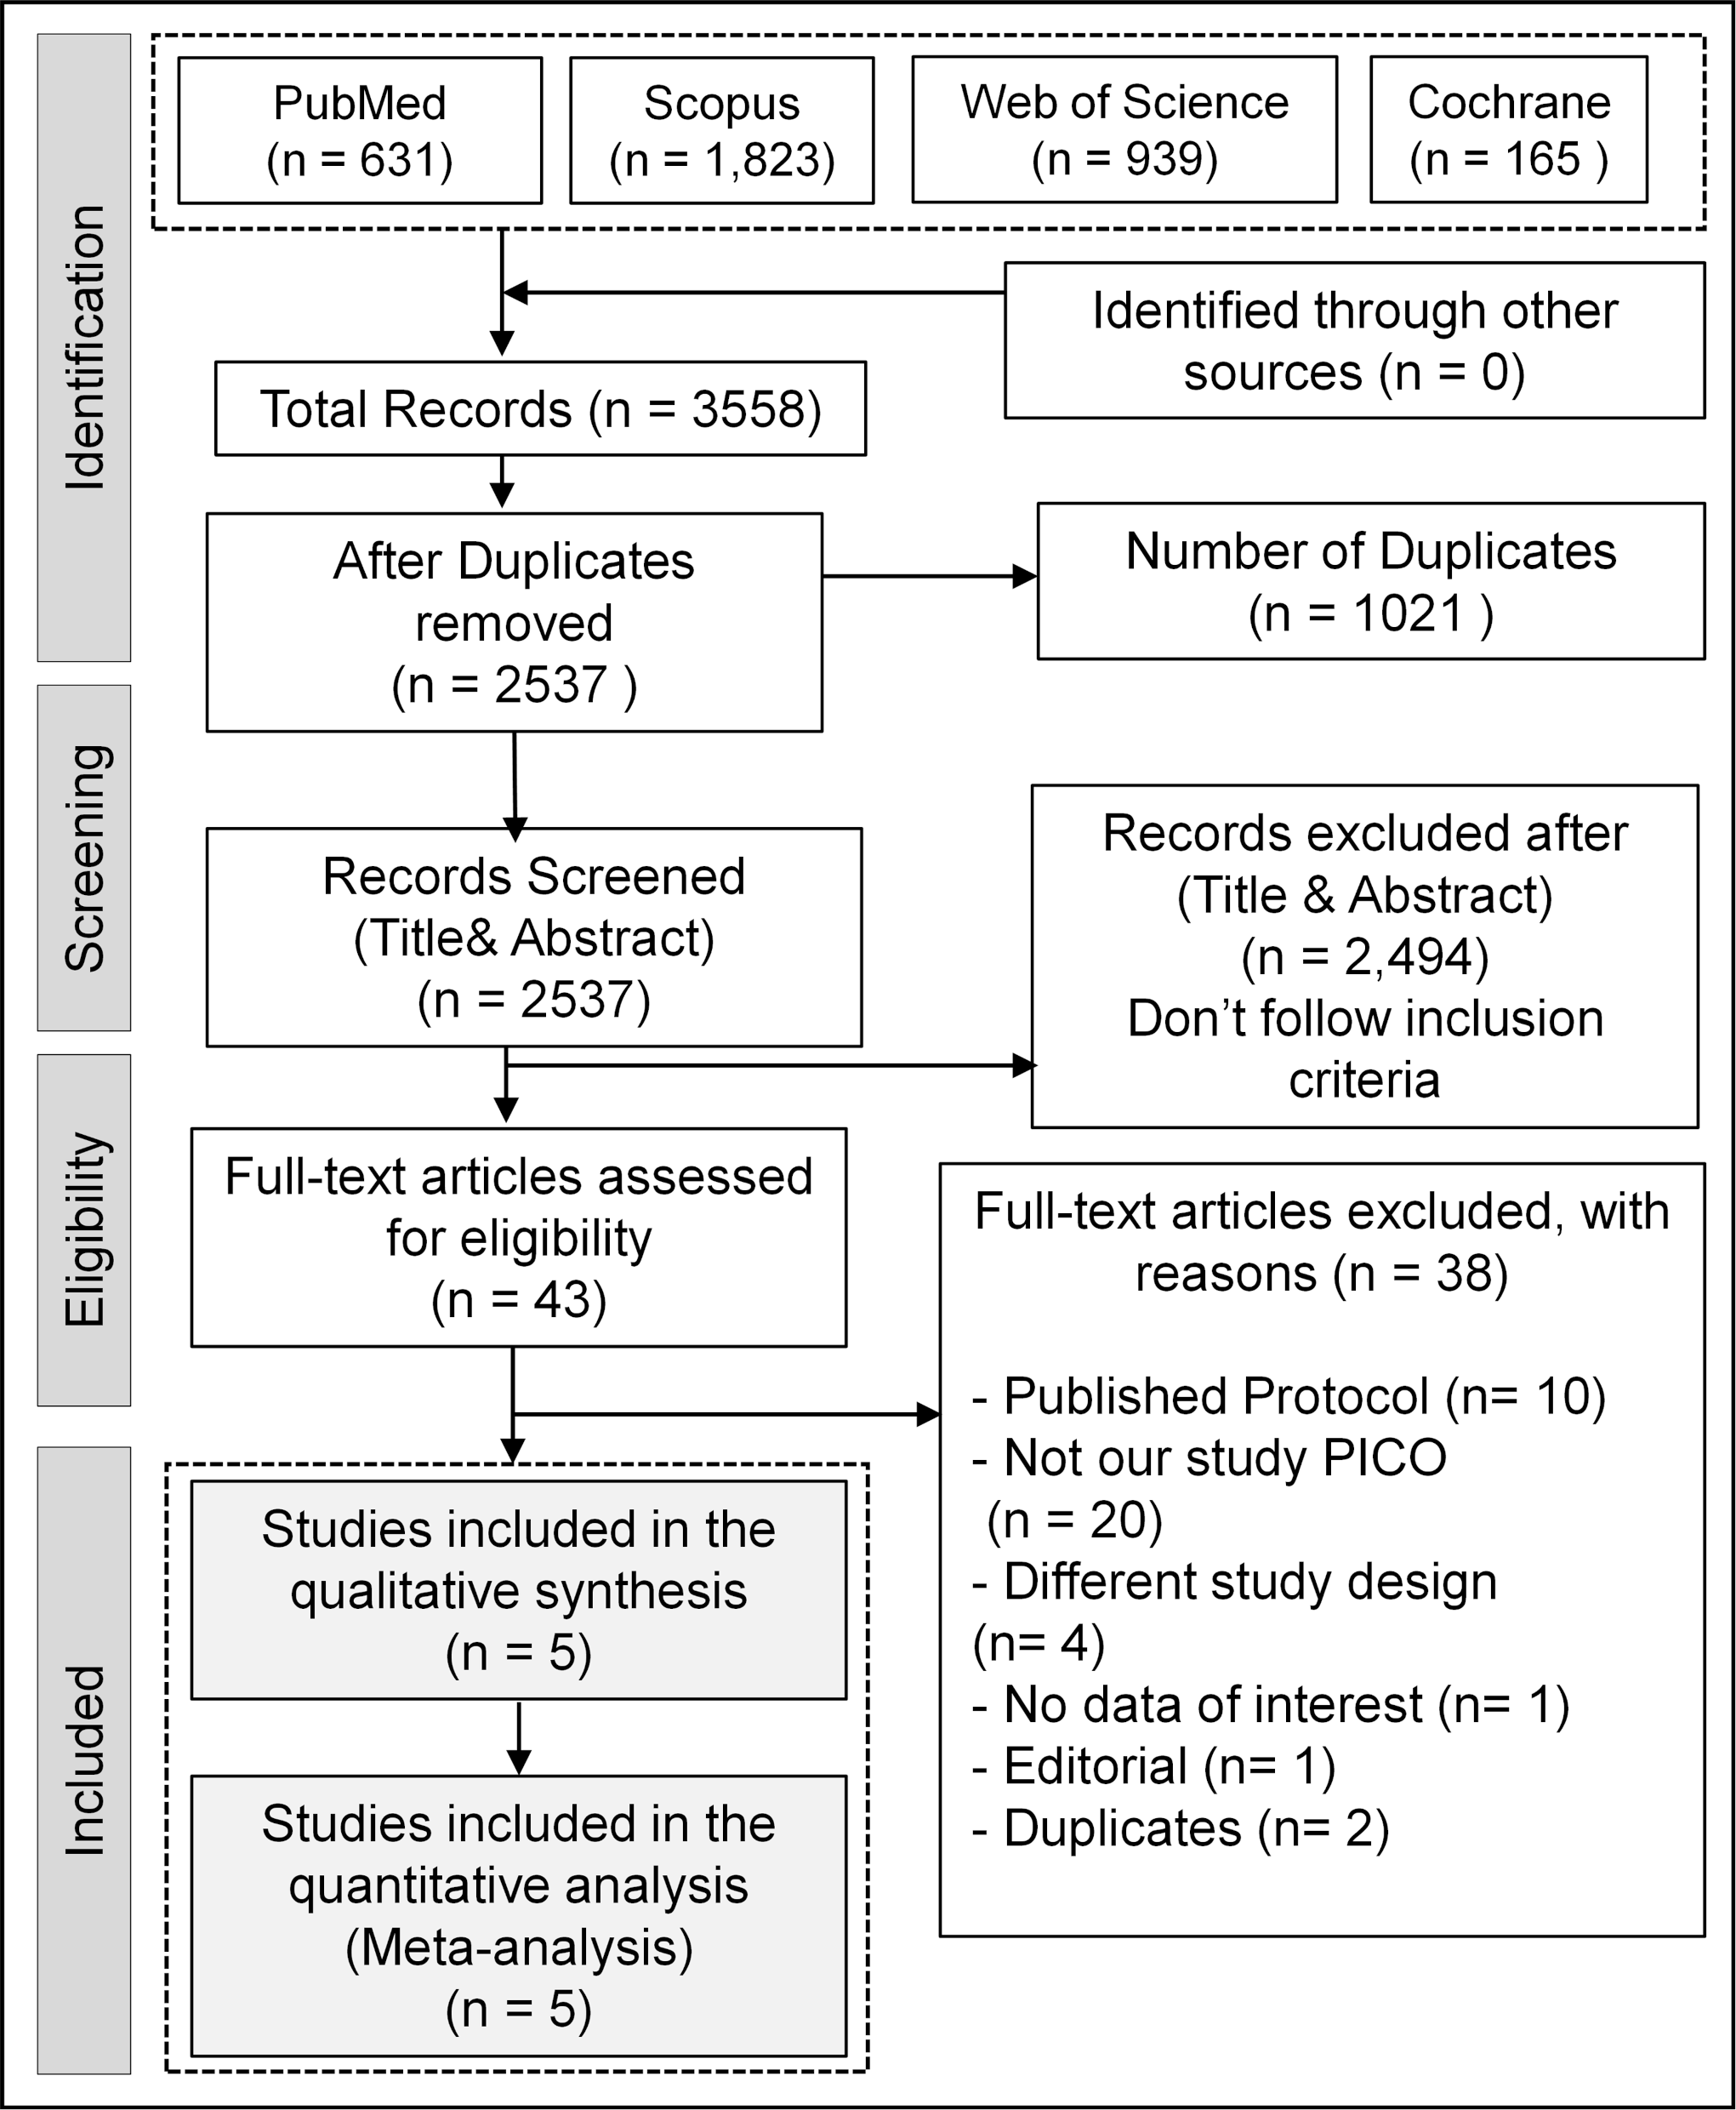
After searching databases, we retrieved 2537 records. According to the declared selection criteria, five double-blind RCTs [15, 16, 29,30,31] were finally pooled in our study, with 219 patients diagnosed with Parkinson’s disease. Figure 1 shows the processes of literature identification and study selection.
Fig. 1
PRISMA flow diagram of the literature search
Characteristics of the included studiesFive RCTs [15, 16, 29,30,31] published between 2007 and 2024 were included, comprising a total of 219 patients with a range of mean ages from 58.4 to 67.9 years old. The follow-up duration ranged from 4 to 16 weeks. These studies compared the effects of oral melatonin intake against placebo control groups. Tables 1 and 2 present the characteristics of the included studies and participants, along with detailed summaries.
Table 1 Summary of the included studiesTable 2 Baseline characteristics of the included studiesRisk of biasUsing the Cochrane Risk of Bias 2 (R.o.b. 2) tool, most studies demonstrated a generally low risk of bias, with some concerns primarily related to measurement bias. Notably, Medeiros et al. (2007) had a high overall risk of bias due to issues with randomization and outcome measurement [30]. A detailed summary of the risk of bias assessment across domains for each study is presented in Fig. 2.
Fig. 2
Risk of bias assessment of the included studies
OutcomesSleep-related outcomesPittsburgh sleep quality index (PSQI)The pooled meta-analysis of the included studies demonstrated a significant difference in the PSQI between the melatonin and placebo groups, favoring the melatonin group (MD= -1.88, CI: [-3.07, -0.68], P = 0.002). There is no significant heterogeneity between the included studies (P = 0.46, I² = 0%) (Fig. 3A).
Fig. 3
Forest plots of sleep-related outcomes, including (A) Pittsburgh Sleep Quality Index (PSQI), (B) Epworth Sleepiness Scale (ESS), (C) Total Sleep Time (minutes), and (D) Sleep Efficiency (%)
Epworth sleepiness scale (ESS)The meta-analysis for ESS showed no significant difference between the melatonin and placebo groups (MD = -1.04, CI: [-2.81, 0.73], P = 0.25) with no significant heterogeneity (P = 0.79, I² = 0%) (Fig. 3B).
Total sleep time (minutes)The meta-analysis for total sleep time showed no significant difference between both groups (MD = 14.85, CI: [-5.45, 35.16], P = 0.15) with low heterogeneity (P = 0.33, I² = 12%) (Fig. 3C).
Sleep efficiency (%)The pooled analysis for sleep efficiency showed no significant difference between both groups (MD = 1.04% [-1.94, 4.02], P = 0.49), with low heterogeneity (P = 0.86, I² = 0%) (Fig. 3D).
Sleep latency (minutes)The meta-analysis for sleep latency showed no significant difference between both groups (MD= -4.70 min [-12.18, 2.77], P = 0.22), with low heterogeneity (P = 0.19, I² = 38%) (Fig. 4A).
Fig. 4
Forest plots of sleep-related outcomes, including (A) Sleep Latency (minutes), (B) REM Sleep Latency (minutes), (C) Frequency of Arousals, and (D) REM Sleep Behavior Disorder Screening Questionnaire (RBDSQ Score)
REM sleep latency (minutes)Three studies reported the outcome of REM sleep latency. The analysis showed no significant difference between the two groups (MD = -11.68 min [-27.62, 4.25], P = 0.15). The pooled studies were moderately heterogeneous (P = 0.10, I² = 57%), and heterogeneity was best resolved by excluding Medeiros et al. (MD = -8.16 min [-24.46, 8.13], P = 0.33), heterogeneity (P = 0.46, I² = 0%) (Fig. 4B).
Frequency of arousalsRegarding the frequency of arousals, the pooled studies showed no significant difference between both groups (MD = 0.88 times [-6.51, 8.27], P = 0.82), with low heterogeneity (P = 0.37, I² = 0%) (Fig. 4C).
REM sleep behavior disorder screening questionnaire (RBDSQ Score)Regarding the RBDSQ Score, the pooled analysis showed no statistically significant difference between the groups (MD = 0.74 [-1.38, 2.86], P = 0.50), with low heterogeneity (P = 0.88, I² = 0%) (Fig. 4D).
Parkinson’s disease-related outcomesUPDRS part III scoresThe pooled meta-analysis of the included studies demonstrated no significant improvements in the UPDRS Part III score between the melatonin and placebo groups (MD = -0.05 [-4.24, 4.14], P = 0.98), with low heterogeneity (P = 1.00, I² = 0%) (Fig. 5A).
Fig. 5
Forest plots of outcomes, including (A) UPDRS Part III scores, (B) Parkinson’s Disease Quality of Life (PDQ-39), (C) Non-Motor Symptom Scale (NMSS), (D) Headache, and (E) Fatigue
Parkinson’s disease quality of life (PDQ-39)The meta-analysis of the PDQ-39 showed no significant improvement in the (MD = -1.68, CI: [-7.23, 3.86], P = 0.55), with low heterogeneity (P = 0.18, I² = 41%) (Fig. 5B).
Non-motor symptom scale (NMSS)The pooled studies of the NMSS showed a significant difference between both groups (MD= -7.17, CI: [-11.71, -2.63], P = 0.002), with low heterogeneity (P = 0.50, I² = 0%) (Fig. 5C).
Side effectsTwo studies reported adverse effects, including headache and fatigue. No significant differences were observed between the melatonin and placebo groups (RR = 0.75, 95% CI: [0.40, 1.40], P = 0.36; RR = 1.25, 95% CI: [0.75, 2.10], P = 0.40, respectively). Low heterogeneity was noted (I² = 0%) (Fig. 5C and D).
Certainty of evidence assessmentThe GRADE assessment of the findings and the certainty of evidence are presented in Supplementary Material 2. The sleep-related outcomes demonstrated a moderate level of evidence certainty, as did the UPDRS-III outcome. In contrast, the PDQ-39 outcome was of low quality due to imprecision and heterogeneity.
Comments (0)